Bitcoin Dominance Is About Give a New Life To Altcoins!Hello, Skyrexians!
We have already mentioned the importance of different crypto assets dominance analysis. Today we are goin to update the main one CRYPTOCAP:BTC.D . Last month it makes us nervous with the potential intention to set the new high. Current formation looks like a triangle - trend continuation pattern and it scares many traders. Is this nightmare is going to be true, or altseason is coming?
Let's take a look at weekly time frame. Now we use the combination of our hand made indicators: Bullish/Bearish Reversal Bar Indicator and Fractal Trend Detector . Trend detector started printing the red candles, the bearish trend late in 2023, but those time this tendency shift failed. This time we have seen two red dot on other indicator and after that trend change. In our opinion this is much stronger confirmation that altseason is really coming.
You probably already know that predicted earlier the dominance drop to 27%, but today we are talking about short term forecast, 0.61 Fibonacci level below 50% is the target for February.
Best regards,
Skyrexio Team
___________________________________________________________
Please, boost this article and subscribe our page if you like analysis!
BTC.D trade ideas

another IHS on BTC.D? Chop chop more?We have successfully completed an IHS on a lower time frame (see my other chart)
Now we seem to have the beginnings of what could be another IHS on a higher time-frame?
Another scary pump of Bitcoin dominance incoming?
Interesting, let's see
(the chart is inverted)

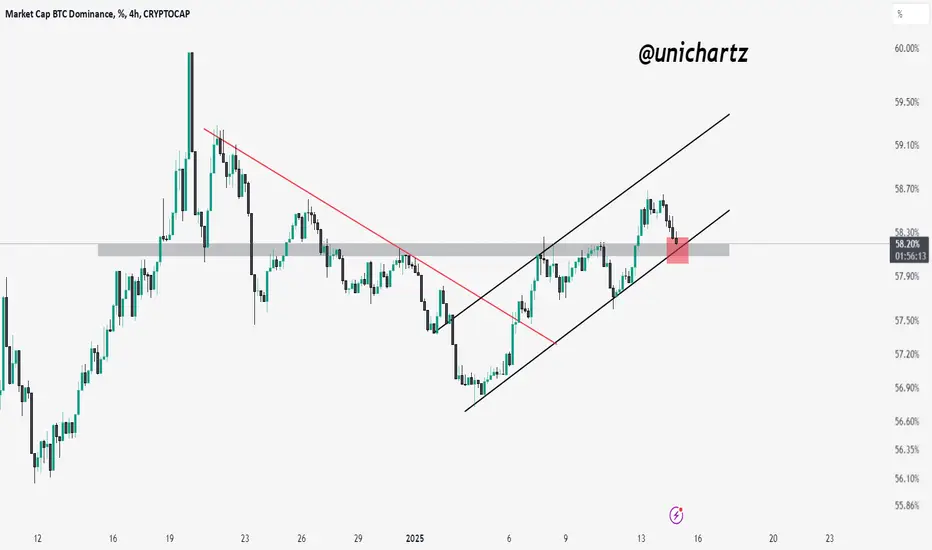
BTC.D Testing Confluence Zone: Will It Break Below?BTC dominance (BTC.D) is currently trading at a critical confluence zone, where the support of a rising channel intersects with a horizontal support level.
Many investors are closely watching this area for clarity on the next directional move. If the marked red zone (area of confluence) is broken, we could witness another leg of altseason as BTC.D trends lower.
Altseason is loading!Btc.D reached to resistant and recently it had a fake out break and trying new test from resistant if it be confirm we can see major altseason that we were waiting for
Hold your alt bag tight

BTC Dominance should dip soon.Looks like we’re close to breaking down for bitcoin dominance this is what I project. Let’s see what happens.

btc dominance$CRYPTOCAP: BTC.D
Today, I will talk about BTC dominance. I think BTC dominance will pump hard, making BTC bullish or strong. I can see BTC dominance can go to the 61-62 level again, making BTC perform better than adults. When BTC dominance reaches the 61.5 level, I will sell my BTC position because BTC dominance will dump from the 61.5 level. That's why I will buy alts coins when BTC dominance is bearish.
Right now I am holding btc

BTC.D updateBTC.D is reaching the midline of the weekly Channel and its daily resistance zone. I personally expect a correction in the coming days which can result in the pumping of the alt coins.
DYOR
Goodluck

$BTC.D: this is how they are cancelling any attempt at altseaonsSomeone is canceling the altseasons.
Every time the altcoin market starts to gain momentum, a sudden CRYPTOCAP:BTC correction halts its progress.
Altcoins are inherently riskier assets, and when fear enters the market, investors sell alts first.
Now that ETF providers hold significant amounts of CRYPTOCAP:BTC and CRYPTOCAP:ETH , they appear to be manipulating the market to maximize their Bitcoin profits. By triggering strategic crashes in CRYPTOCAP:BTC and CRYPTOCAP:ETH , they effectively prevent an altseason from taking off. Each crash leads to massive corrections in altcoins.
Today’s events are a smoking gun. The correlation with CRYPTOCAP:BTC allows ETF providers to instill fear and drive altcoin holders to sell, favoring Bitcoin.
Yesterday, all altcoins looked poised for a breakout. The MACD signaled a daily crossover, indicating sustained growth for the next two months. I even posted that CRYPTOCAP:ETH was likely to hit $3800 within a week—*unless* CRYPTOCAP:BTC crashed.
Guess what happened? CRYPTOCAP:ETH dropped 10% today—entirely due to manipulation.
There’s absolutely no reason for CRYPTOCAP:ETH to decline, except for psychological manipulation tied to its correlation with $BTC.
If altcoin holders don’t realize they’re being played by Bitcoin’s puppet masters, altcoins will continue to lose their appeal.
Investors hate losing money, right? ETF providers aim to redirect the crypto market’s wealth into their “new baby”—Bitcoin.
The result?
- BTC.D’s drop was reversed, driven by fear, as more altcoin investors panic-sell.
- USD.D increased as liquidated investors exited the market.
Where will that money go? Some will inevitably flow back into CRYPTOCAP:BTC because:
- Bitcoin has limited downside.
- Bitcoin is strong.
- Bitcoin is proven technology.
- Bitcoin isn’t a scam.
- Bitcoin is the most recognized and trusted crypto asset.
This marketing strategy is working. It’s been more than four years since we’ve seen a proper altseason.

BTC - Dominance Rise puts ALT Season on IceThe CRYPTOCAP:BTC.D index has developed an Inverse Head & Shoulder pattern on the 2H timeframe, which points to further trouble ahead until we get some certainty and clarity with how the new administration decides to move.
The recent shakedown on ALTs has been driven by higher than expected inflation and repricing of FED reserve rate cut expectations, with no rate cut expected in the next FOMC. Wednesday is a key macro day as the CPI, a key gauge of inflation is due to be released. This data ultimately shapes policy and a hot print could spell more trouble for risk assets.
Having said that, we're only a week a way from the most crypto friendly White House administration taking office.
Will the crypto friendly policies turn the page to enable Risk Assets to surge higher despite inflation woes?

BTC.D Death Cross Formation:
The “death cross” occurs when the short-term moving average (50-day MA) crosses below the long-term moving average (200-day MA).
This is considered a bearish signal, often indicating a potential decline in the market.
In your chart, the highlighted circle represents this potential crossover or the situation after it.
The narrow trendline indicates a symmetrical triangle or wedge formation, where the price consolidates before the breakout.
The breakout direction appears to be initially upward, breaking above resistance but eventually moving downward.
The blue horizontal line at around 59.21% dominance is a key resistance area.
Bitcoin dominance has broken above the triangle for some time but may struggle to remain above resistance.
After initial upward movement, the chart suggests a downward trajectory, possibly retesting lower dominance levels (towards the 55.50% and 54% areas).
This implies a potential altcoin resurgence or broader market uncertainty if BTC.D declines.
The red and green moving averages are important in defining the current trend.
A bearish cross between these moving averages aligns with the death cross narrative and signals caution.
Let me know if you’d like further assistance or adjustments!
DYOR. NFA

BTC.D; LONG TERM ANALYSIS (read the description)First of all sorry that my chart is not looking too messy and there are no weird indicators nor anything.
We have only two possible scenarios for bitcoin’s dominance.
1) The bearish pattern you can clearly see is broken after 2 years so two things might happen here: 1-1: BTC.D can have 60% touched in the coming days as a pullback to the broken resistance but what happens afterwards will be important.
1-1: if the pullback is confirmed ethereum will finally shine along with many altcoins.
the target for the dominance will be 45-48%.
What can happen afterwards: the price will keep moving in the pattern until a real breakout happens which will likely result in new lows for the dominance.
2) If the pullback is ruined and we see the support lost it will mean the pattern had a fake breakout & that would mean this current pattern is not a reversal one:
2-1: we can see new highs for the dominance if this is confirmed,
The target will be 70-72%. If bitcoin price falls too the market will bleed.🩸
But what can happen afterwards, two scenarios again:
1) Since the price will touch the top of the long-term trading range we can see the dominance moving towards the bottom again.
2) A double bottom will be confirmed, depending on the situation then, if dominance fails to break the shoulder at around 57% we can see even new highs but the chance of this happening is below 10% lol unless ethereum is destroyed lol.
So that’s all. I recommend yall to wait if you want to buy anything. And note that btc.d can go up and the price can still fall so beware and dyor.
Thanks for reading this.

BTC.D Bitcoin Dominance Setting Up For A Sell Off!What's up cat DegenJake here, Welcome all to a new trading week were going to start zeroing in on crypto as things are really starting to heat up in the crypto scene. With much anticipation we wait for a bullish Run, but for now we definitely see bears in control of BTC.
Here on BTC.D we definitely see it wanting to go upwards and take out some white horizontal lines of 4hr liquidity zones. & in another case scenario even be able to take liquidity
on the daily Yellow horizontal line.
Theres no denying that this chart has so much more liquidity to grab to the downside than it does to the upside anymore, But the market markers seem to be loving to shake out the retail investors and newcomers to crypto that aren't adapted to such rad volatility.
Personally i see these opportunities as further buy entries for ALT's and BTC.
Based off this chart we can see ALT's correcting about 16% in the incoming days then pumping to VALLHALLA.

Bitcoin dominance (decreasing = Altcoin season)We are currently in an uptrend for Bitcoin, targeting approximately 250k.
For altcoins to grow in dominance, Bitcoin's dominance needs to decrease.
The price of altcoins is mostly related to Bitcoin. When Bitcoin decreases, altcoins tend to follow. However, when Bitcoin consolidates or slightly increases, altcoins often experience massive upward movements.
The best-case scenario for altcoin dominance would be a golden Fibonacci level around 45%, or alternatively, a bounce at the Gann Fan 0.5 level.

BTC.D made a good setup of choch TP 40 %HI ,
made a good setup of change of caractar
Take profit 40 %.
with divergence on D1
Good luck

BITCOIN DOMINANCE ANALYSISBitcoin (BTC) dominance is a metric used to measure the relative market share or dominance of Bitcoin in the overall cryptocurrency market. It represents the percentage of Bitcoin's total market capitalization compared to the total market capitalization of all cryptocurrencies combined. Since Bitcoin was the first asset, it has remained the largest by market cap, which is why its dominance in the market is a number that many people follow. We describe the assets tracked in this chart as crypto assets because it includes tokens and stable coins, not just cryptocurrencies.

Get ready for ALT-SEASON!We got confirmation on breaking uptrend channel downwards in last few weeks and we all know what that means. More CRYPTOCAP:BTC.D goes down better for alt-coins. 47-51% is the range I am looking for. There are few alt-coins haven't made major moves in last year, I will post about it soon. Keep posted!

sharing my altcoin roadmapJust sharing my roadmap for the next couple of years
CRYPTOCAP:TOTAL2
BINANCE:BTCUSDT
COINBASE:BTCUSD

Bitcoin Dominance at a Tipping PointBitcoin Dominance is testing a trendline if it breaks above this trendline this will be bad news for the altcoins. If it is rejected from here we will see good moves in altcoins


BTC.D READY FOR RALLY Bitcoin dominance has broken the rising wedge pattern to the downside, creating a large block order zone during the breakout.
Following this, it has retested both the created block order zone and the broken rising wedge.
The next expected move is to enter a distribution phase from this point and decline further towards the 48% level.
Similar movements to the previous rally are being observed. BTC has broken the descending wedge, retested it, and we expect a downward move after the distribution phase.🚀🚀🚀🚀

BTCD breaking downLooking at past halving events and how btc dominance moved, we either already have seen the btcd top or it will happen by end of January. Then if we follow the same patterns from the past, it will take a 4 to 6 month altseason.
The narrative that the altseason won't be like previous half seasons seems like BS. In the previous bull season the btcd bottom was at 40% and this time around it looks like it will bottom around 42% (maybe even lower due to FOMO).
So buckle your belts and hold on to your seats ladies and gents.

BTC Dominance Chart as an indicator(My first shot at really zooming out like this. Let me know what you think)
This is a BTC Dominance chart going all the way back to the end of the last Bull market cycle and then through the bear market to present day. This chart basically shows you how much of the entire crypto market is BTC. When the BTC dominance is on the rise, this suppresses the price of the other coins, but when the dominance drops its very bullish for the stables, alts, memes as well.
The last bull run at the peak, the BTC dominance bottomed out at 38%
Any constructive criticisms, funny comments, advise, adjustments, tweaks, whatever let me know what ya think.

BTC Dominance: Volume Insight!As on the chart: I believe the volume suggests the big alt season will come soon, and that BTC dominance is correcting. And that, given the current scale of the move, the alt season will be less impressive than both of those before. Each alt season has effectively been less impressive than the last, with last cycle's alt season not even able to break the lows of the previous alt season dominance-wise!
The two sets of lines indicate a first corrective phase on dominance, consolidation where volume drops off, and then the really big dominance correction where once again rises. The pattern is very clear and visible to all!
This 'in a few months' view aligns with my EW analysis and time-cycle analysis, which is why volume as another confirming factor gives me additional confidence.
