BTC Dominance: Volume Insight!As on the chart: I believe the volume suggests the big alt season will come soon, and that BTC dominance is correcting. And that, given the current scale of the move, the alt season will be less impressive than both of those before. Each alt season has effectively been less impressive than the last, with last cycle's alt season not even able to break the lows of the previous alt season dominance-wise!
The two sets of lines indicate a first corrective phase on dominance, consolidation where volume drops off, and then the really big dominance correction where once again rises. The pattern is very clear and visible to all!
This 'in a few months' view aligns with my EW analysis and time-cycle analysis, which is why volume as another confirming factor gives me additional confidence.
BTC.D trade ideas

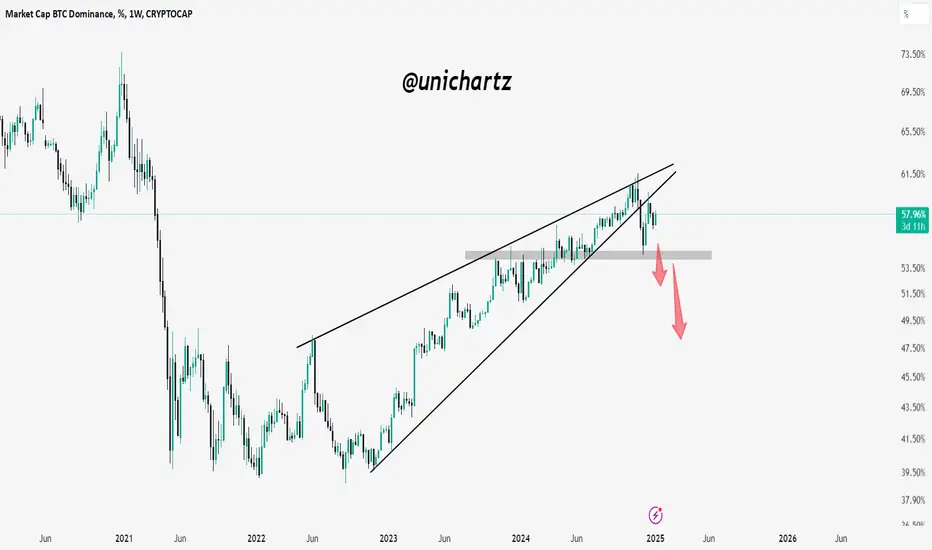
BTC.D Breakdown the Next Altcoin Bull Run Closer Than You Think?Bitcoin dominance (BTC.D) is a crucial metric that reflects Bitcoin's market share relative to the overall cryptocurrency market. A rising dominance often signifies Bitcoin outperforming altcoins, while a declining dominance suggests increased strength in altcoins or a broader altcoin rally. The current chart provides critical insights into the state of Bitcoin dominance, the potential implications for market dynamics, and the timeline for future movements.
Key Observations and Technical Insights
1. Breaking the Rising Wedge Pattern
The weekly chart shows a classic rising wedge pattern that Bitcoin dominance has adhered to for an extended period. A breakdown from this pattern is a bearish signal, indicating a potential shift in dominance from Bitcoin to altcoins.
The wedge breakdown was accompanied by significant bearish momentum, validated by a retest of the breakdown level.
This technical development is a strong indication that BTC.D has entered a new phase of its trend.
2. Current Consolidation Zone
Following the breakdown, BTC dominance has entered a consolidation phase within the highlighted rectangular box (approximately between 53.2% and 58%).
The consolidation suggests market indecision as Bitcoin retains relative strength but altcoin activity starts to increase.
Volume levels during this phase are moderate, reflecting a lack of aggressive participation, which is typical before a major directional move.
3.Key Levels to Watch
Resistance: The upper boundary of the box (58%) aligns with prior rejection levels. A move above this could indicate a temporary resurgence of Bitcoin dominance, potentially due to increased Bitcoin-led market rallies.
Support: The lower boundary of the box (53.2%) is a critical support zone. A sustained break below this level could confirm the next bearish leg.
4. Indicators Supporting the Bearish Bias
Ichimoku Cloud: The dominance has started interacting with the cloud's lower boundary, which acts as dynamic resistance. A clean break below the cloud would further confirm bearish momentum.
MACD Divergence: The MACD histogram is tilting bearish, signaling weakening upward momentum. A bearish crossover on the MACD line would solidify downside expectations.
RSI: The RSI is trending near the midline, showing no extreme conditions. This gives room for further downside before entering oversold territory.
Market Implications and Projections
1. Impact of a Breakdown Below the Box
If BTC dominance decisively breaks below the 53.2% level, it will likely lead to a significant shift in market dynamics.
A drop toward the marked lower levels (approximately 48%, 42.8%, and 39.9%) would indicate the onset of an altcoin season, characterized by robust performance in altcoins.
Historically, such breakdowns in BTC.D have coincided with increased speculation and capital rotation into altcoins, signaling the start of a bull run across the cryptocurrency market.
2. Bull Run Timeline
The estimated timeline for this critical move is Q1 2025, which aligns with broader market cycles and macroeconomic expectations. Institutional interest in crypto, combined with improved market sentiment, could amplify this trend.
3. Potential Scenarios
Bullish Case for BTC.D: A reversal above 58% would require significant Bitcoin-led rallies, possibly fueled by macroeconomic uncertainty or a Bitcoin ETF approval. This scenario delays the altcoin season but strengthens Bitcoin as the primary investment vehicle.
Bearish Case for BTC.D: A sustained decline below 53.2% would confirm altcoin strength and could trigger rapid capital rotation into alternative assets, particularly in high-liquidity altcoins and DeFi protocols.
This chart provides a professional-grade analysis of Bitcoin dominance and its potential impact on market dynamics. The breakdown from the rising wedge, the ongoing consolidation, and the bearish indicators suggest that BTC.D is on the brink of a major directional move. Traders and investors should closely monitor the consolidation box boundaries and prepare for a shift in market structure as BTC dominance declines.
The Q1 2025 timeline for the next leg down aligns with historical patterns and macroeconomic projections. A break below 53.2% will likely usher in a new phase of the crypto market, driven by altcoin strength and increased retail participation. Stay vigilant, as this period could mark the beginning of the next crypto bull run.

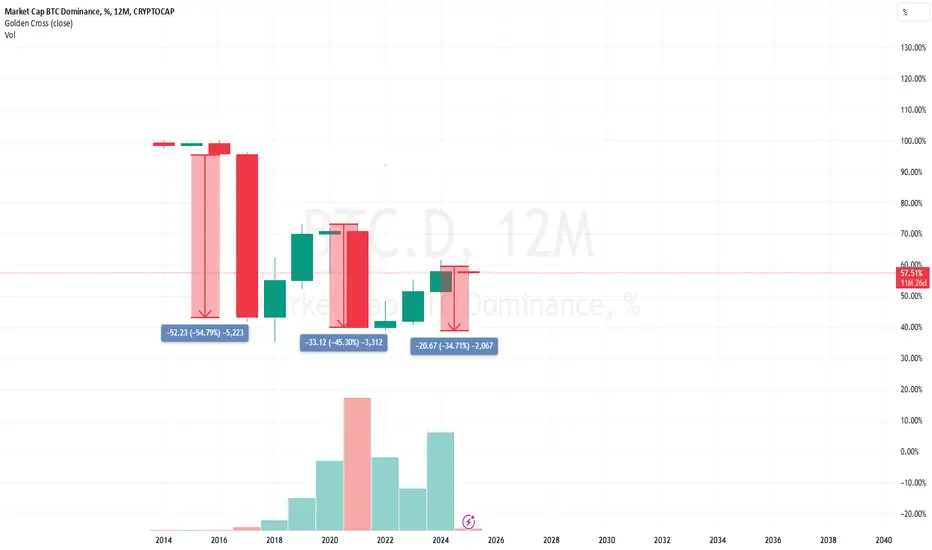
Bitcoin Dominance Macro Vision#BTCDominance We have gone 245 days without any major drops, the first time it has taken so long to fall, it has been more than 35 days apart. However, after 210 days the dominance value dropped and it was a mini altseason, but nothing compared to the previous ones for the moment. An exit or sale of everything is projected with dominance at 45%. CRYPTOCAP:BTC.D

BTC Dominance Breakdown: Altcoins Poised for a Rally?BTC dominance has broken below a rising wedge and is retesting the 57.80% resistance.
If rejected, dominance could drop to 53.50% or 50.00%, signaling potential capital flow into altcoins.
BTC.D1 . Increase in Bitcoin Dominance: This could happen if Bitcoin outperforms other cryptocurrencies, especially in times of market uncertainty, making it the preferred asset for investors.
2 . Stable Dominance: Bitcoin dominance might stabilize as the market matures, with Bitcoin maintaining a significant but steady share as other cryptocurrencies grow in value and adoption.
3 . Decline in Bitcoin Dominance: If altcoins continue to gain traction, particularly with technological innovations and use case developments, Bitcoin's dominance could decrease as more investors diversify into other digital assets.

BTC.D DOWNSell off pushing alts into support/lower area of their ranges, potential for more down, accumulation is picking up.
DOM has hit a wall, wicking away on the 4hr from the daily 50% signaling new capital rotation.
DT inauguration soon, sell off, sideways before pump?
Labor market data under Biden admin looks fake. Crypto likely to see the effects and rally soon as fed does fed things continuing QE without labeling it QE.

BTC.D: Critical Triangle Breakdown | Alt Season Signal?Current: 57.98% |
Pattern: Large descending triangle since November peak
Technical Analysis:
1. Macro Structure
- Multi-month descending trendline resistance
- Double rejection at 60% level
- Key support at 56% zone
- Volume profile decreasing in consolidation
2. Key Levels
- Major resistance: 60%
- Current resistance: 58%
- Critical support: 56%
- Target zone: 52-54%
3. Signals
- Triple rejection at descending line
- Volume decreasing in triangle
- Weak bounces from support
- Bearish RSI divergence forming
Trading Scenario:
- Targets:
T1: 56% (initial support)
T2: 55% (measured move)
T3: 54% (max target)
Market Implications:
- BTC.D drop typically signals alt season
- Monitor top 10 alts for rotation
- ETF approval could affect dominance
DYOR - Not financial advice. High-risk market period with ETF decisions approaching. Size positions accordingly.

Altseason 2025 scenario.Here’s a bullish scenario for 2025: BTC.D Weekly Chart - a pattern that often precedes an Altcoin season. Prediction: It might occur in January next year.

btc.d updateas it looks we are possibly at the top of wave 5 so we should see btc dominance fall with an abc correction and we should see a lower low if this plays out within 24-48hr

BTC.D update #BTC.D made it's 1st and 2nd down trend waves I think this Down trend can provide liq for alt coins to fly ! It's better now be out of market and just see what will going on

IHS on LTF for BTC.Das per title, on the short term timeframe BTC.D should go higher
where next we reassess when reach it

When is altcoinseason?
I think altcoinseason is getting closer.
We have to follow the trend line, the dominant one has already reached a sensitive area, it may go up a little more, even up to 66%, who knows, maybe even a little more, but when the trend line breaks, that's when we'll have the first serious signs from the start of altcoinseason.
It is quite difficult to reach the 70% area because the market in general has matured and matures from cycle to cycle.

BTC DOM VS USDT DOM!!TL:DR - ALTS GONNA BOOM IF BTC HOLDS.
BTC dominance (BTC.D) and USDT dominance (USDT.D) with the following observations:
BTC Dominance (Right Chart):
• Current Level: BTC.D is at 57.62%.
• Resistance Zone: A marked resistance zone between 58.00% and 62.00%, indicating potential rejection if BTC.D rises into this area.
• Support Zone: A support zone is visible around 55.00%, suggesting BTC.D could drop to this level if selling pressure increases.
• Projected Movement: The green line indicates a potential drop and oscillation within the range, implying consolidation or retracement in BTC’s dominance.
USDT Dominance (Left Chart):
• Current Level: USDT.D is at 3.93%.
• Resistance Zone: Highlighted near 4.40% to 4.60%, showing potential rejection if USDT.D rises to this zone.
• Support Zone: Around 3.60%, indicating USDT dominance could fall to this level, with buyers likely stepping in.
• Projected Movement: The green line suggests a possible bounce from the support zone, followed by oscillation and eventual testing of the resistance zone.
Implication:
• BTC Dominance Drop: Indicates an increase in altcoin activity as funds move from BTC to other cryptocurrencies.
• USDT Dominance Rise: Reflects risk-off behavior, with traders holding stablecoins amid market uncertainty.

All we need now is ...MONEY $$ , Look at those resistance from the trendline or the incoming Fair Value Gap. We can get thru them only if $$ is flowing into them + Bear get short squeeze. We have the CHOCH on the Daily, the party has just started. Let's monitor it carefully

Possibly no alt season for now
Greed indicator is at 76 and could be close to 80 tomorrow. The previous BTC dominance monthly candle closed in green and two daily candles are green so far. The BTC dominance may be moving towards 67% to hit 50% fib and the trendline.

Next Alt sessionBTC.D tends to drop right after its halving cycle; this may be the last altcoin season.
BTC dominance reveals how to navigate crypto cyclesHello everyone,
this one is for patient (long-term) traders/investors, not for those chasing daily gains or short term swings.
We are looking at BTC dominance chart. BTC dominance is currently at 60%, which is pretty high.
Everyone who follows cryptos for some time should know how crypto cycles work. BTC is king and always leads the way. BTC if the first one to start the bull run, altcoins follow. When BTC is near its peak, money transfers into ALTs --> start of ALTSEASON.
The first peak of altcoin season was January 2018. BTC dominance was at 35%. After Jan 2018 we went into a bear market. BTC dropped in value, ALTCOINS dropped even more. Consequently, BTC dominance went up.
BTC dominance reached top at 74% in Jan 2021. That is when ALTSEASON started.
THIS DOES NOT MEAN THAT BTC REACHED TOP in Jan 2021.
BTC rose from 40k to 70k between Jan 2021 and Nov 2021, but ALTs in this period made bigger gains.
BTC dominance in this period plummeted from 74% to 40%, creating a base for future.
From Jan 2023 BTC has been rising and increasing its dominance, currently sitting at 60%. I am positive it will not break high of Jan 2018. Next strong resistance is in the area of 64-67%, I expect dominance to reverse in this area.
BTC has already made a new ATH, but total crypto market space is not at an ATH yet. So ALTs are lagging in comparison to previous cycle.
I believe we are at the start of ALT season and I will be looking into ALTs for my last gains this cycle. Check my other posts to see which ALTS I am considering. I will also be posting some other ALTs in coming days/weeks, so subscribe to stay notified.
Good luck to everyone.

Crucial area for BTC dominance ! Altcoins prediction ?We are in a very important zone in terms of BTC dominance. A retest with an extension of the downtrend would be a new boost for Altcoins. However, an upward break of this zone would be a bad sign for Altcoins in the short term.

Bitcoin Dominance to fall & the 10K Eth run to commence CRYPTOCAP:ETH is set to have a fantastic year this year with SIX:BTCD set to to start slowing down & eventually fall letting the long awaited CRYPTOCAP:ETH run to 10K start

ALTSEASON within Q1 of 2025?Many of us have been anticipating an altseason, especially considering it's been about 3 years since the bull run began, yet we still haven't experienced a significant one. Several factors seem to be holding it back, including high Bitcoin dominance, delayed institutional interest in altcoins, weak altcoin fundamentals, and challenging economic and macro conditions, such as elevated interest rates and recession fears, which limit speculative investments in riskier assets.
However, my analysis suggests that an altseason may emerge within the 𝐖 wave and this phase could provide a glimpse of an altseason, potentially lasting around 90 days, or within 𝐐𝟏. Following this, we may enter a larger corrective phase during the 𝐗 wave, presenting a generational buying opportunity. This setup could pave the way for another altseason during the next leg down in the 𝐘 wave.
𝐃𝐢𝐬𝐜𝐥𝐚𝐢𝐦𝐞𝐫 : The information provided here is for educational purposes only and should not be considered as financial or investment advice.

BTC.D Clear Downside - Alt Season is here.Here you can see the rejection. Its monthly time frame. It Means 4-6 months will be good for alt coins. DYOR. Not a financial advice.


BTC Dominance vs USDT Dominance on breakoutBullish cup and handle pattern on BTD Dominance / USDT Dominance ratio chart on a daily basis.
