#CHRISTMAS RALLY INCOMING OR JUST A TRAP?CRYPTOCAP:BTC Dominance is Finally Seeing a Rejection!
The upcoming weekly close will be critical for ALTCOINS.
The rejection looks good and it's important for BTC to stay stable for the altcoins to pump.
The weekend is here and you don't decide on a trend on the weekend, you must wait for a weekly close and how traditional markets open.
So more clarity will be seen on Monday.
Is this the start of the altcoin rally you've been waiting for?
Or is there more pain ahead?
The answers will reveal themselves soon.
So make sure you follow me on all socials.
More updates will be posted on confirmation!
I’ve shared 13 altcoins on request in my TG, and they’re already up 10%-25% in the last 4 hours.
Also, do not forget to hit that like button and share your views in the comment section.
Thank you
#PEACE
BTC.D trade ideas

Bitcoin Dominance at Major Resistance: Alt Pump Incoming?
🚨 Bitcoin Dominance Update 🚨
Currently sitting at 58.69%, Bitcoin dominance has reached a critical confluence of horizontal and trendline resistance.
📉 Key Observations:
- Dominance retraced precisely to the Golden Ratio (0.618 Fibonacci) level.
- This area marks a potential reversal zone.
💡 What This Means:
A decline in Bitcoin dominance could signal the much-anticipated altcoin season as capital flows out of BTC into altcoins.
🗺️ Key Levels to Watch:
- A breakdown from this resistance could lead to massive altcoin pumps.
- On the flip side, a breakout above this resistance could invalidate this setup.
📊 Keep your eyes on this setup, and let’s prepare for potential opportunities in the altcoin market. 🚀
🔔 Follow for more trade ideas and market insights!
BitcoinDominance Altcoins CryptoTrading AltSeason BTC

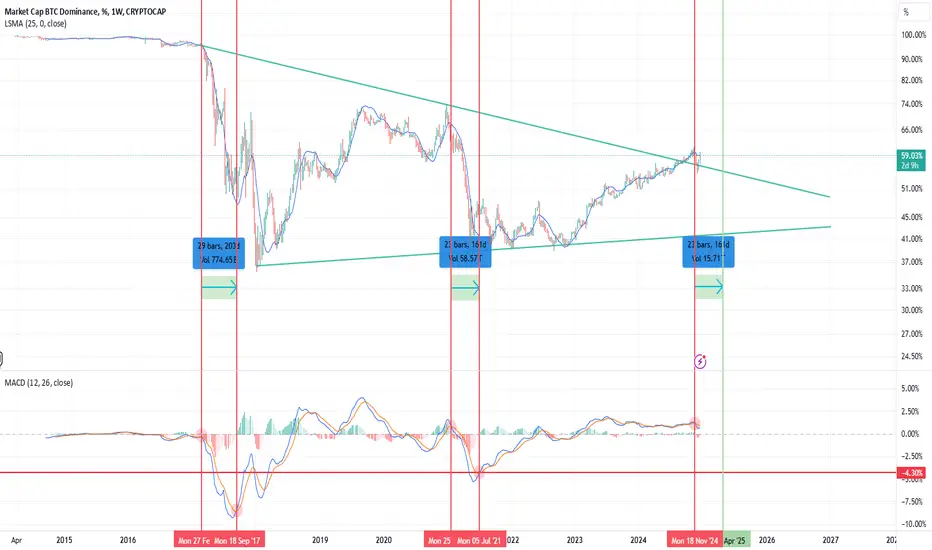
BTC.D Long-term SpeculationLooking at this chart objectively, it is currently in a lifelong downtrend and we should now expect a rapid and sustained decline to around 13-17% from where we are now in a wave 3 of 3. This changes if dominance exceeds 63.32% or if the next move down doesn't reach the 1.618 extension and starts to look like the C wave of an ABC correction of an uptrend...

You see what i see? BTC.D will soon drop hardWill drop hard and alts will go up, dont get trapped by the whales

This My Thesis on Altcoin Season: When Alt Season???Yesterday, we had some scary dips in the crypto market, and many people switched to panic mode, they felt the bull season was over.
Well, the bull season is barely 1 year and 3 months old, and it is difficult to call the top when some historical patterns are yet to be seen in the market.
When Bitcoin is pumping, a couple of altcoins are yet to pump as much as BINANCE:BTCUSD , and when Bitcoin dips, they dump harder. This has left a lot of newbies in confusion lately.
They are beginning to lose hope in their altcoin bags. Suppose history is an important factor in investment. In that case, it is correct to say that BTC will soon lose its dominance at 68-70%, and there will be a capital rotation into viable altcoins that have strong communities, utilities, and better technologies.
Observe the chart, I used a weekly timeframe so that you will have a better grasp of what is happening in the market.
BTC will likely squeeze out more capital from altcoins before it reaches the peak of its dominance.
Brace up, invest smartly, and most importantly take profit with wisdom and be patient with your moon bags.
Data don't lie, but if that is not the case this time, I will be glad to embrace my mistakes.
What mistake?
The mistake of depending too much on historical data and not admitting that history, sometimes, does not usually repeat itself.
For now, enjoy the flow of the market.
Cheers to 2025! It was an incredible year for us.
Do you like this analysis? Share with your friends, like the analysis, and follow me for more.
Do you have a contrary opinion? Leave a comment down below, you can present your case without insulting anyone.

Btc Dominance The possibility of moving these daysThis is only my personal opinion, do not accept analysis without personal review, wishing you success.

WHY ALT-COINS ARE DUMPING!!?hello to everybody and welcome back for another analysis.
today is kinda different and we are gonna talk about BTC dominance and the impact it can have on the alternate coins and it's very important.
the reason that the alt-coin market has been all red is actually because of the BTC dominance that is going towards the 60% market cap, and on the other side the BTC price itself is dropping significantly and this alone can cause a huge dump in alt-coin markets.
so be very careful these days for any long entry and manage your risks.
for all holders that want to buy any alt-coins, I suggest that they wait for the dominance to drop and maybe they can consider buying.
Remember, this is not financial advice; it is just my personal opinion that I wanted to share with you all.
THX for reading and have a great day.

Btc.D Here is the plan:
Btc.d has much liquidity lying between 59.3-62
It reclaimed Nov bottom exactly on 15Dec. The daily close above 59.3 means moving towards 62ish.
For BTC; it needs to gather momentum exactly between 84-73; this will give our base towards 150k.
I started buying alts because majority are below 70% Fibs; where smart money starts to accumulate. Good luck to all; stay safe and stick your plan.
Closing 2 days below 59.30%, is the entry; hopefully last week of Dec or First week of Jan25.

BTC Dominance will fallBTC.D breaks the trendline and AO indicator also shows divergent. Soon we may enjoy the altcoin seasons !!

BTC Dominance - Dreams come trueDid you survive the correction? The alt season will begin soon. BTC dominance is likely to drop significantly. Good luck to everyone!

Btc dominance Looks like it will get rejected at the 0.61% on the btc dominance . This going down means altcoins going up . There is no reason to be bearish for alts , btc can drop to 87k who cares . Altcoins will gain more marketcap


Is the Bitcoin Dominance chart fake and useless?Why is the Bitcoin Dominance chart in the 4-hour time frame the opposite of the daily time frame? It is upward in 4 hours, downward in daily!

Analyzing BTC Dominance: key levels to watchBitcoin Dominance (BTC.D) is a crucial indicator for understanding market sentiment and the flow of capital between Bitcoin and altcoins. Observing its levels can provide valuable insights into the overall market dynamics.
In the daily timeframe, BTC Dominance is currently hovering around 58.41%. The chart highlights two significant zones:
Resistance Zone (~66%-68%): If BTC Dominance trends upward, this level could act as a strong resistance. A rejection here might signal a shift in capital back to altcoins.
Support Zone (~40%-42%): On the downside, this area represents a potential long-term support level. A break below could indicate a major capital rotation out of Bitcoin and into altcoins or stablecoins.

#Altseason coded!CRYPTOCAP:BTC dominance is in major downtrend!
#Alts market cap OTHERS TOTAL2 and TOTAL3 looking good!
For #Altcoins, corrective waves occurring in short time frames are temporary and are buying opportunities.

BTC Dominance Chart - BITCOIN DOMINANCEBTC Dominance is the most important chart to follow to understand whether the crypto market is in an altcoin or Bitcoin season.
"We had a great projection regarding the Bitcoin Dominance bearish shift around the 60% level, and it played out perfectly. I’ve linked that projection to this post for reference.
Currently, Bitcoin Dominance is testing the weekly supply zone as a bearish retest. This aligns with the premium side of the Fibonacci, adding to my conviction that we’re likely to see a bearish reversal from here, forming a lower high. This lower high could potentially trigger another leg down in dominance, setting the stage for a strong altcoin season.
I expect this shift to happen very soon.

BTC.D important zones of support and resistance!!Join our community and start your crypto journey today for:
In-depth market analysis
Accurate trade setups
Early access to trending altcoins
Life-changing profit potential
Let's analyse BTC dominance:
BTC.D has recently broken below a significant 24-month support trend line, triggering a surge in the altcoin market. While a brief retest of this level is possible, BTC.D is currently trading within a rectangular pattern on the daily chart.
The 200-day EMA on the 3-day chart is identified as a crucial support zone, where a minor pullback may occur. Conversely, the 100-day EMA on the 3-day chart is seen as a key resistance level, likely capping any further upside in BTC.D.
Overall, the weakening Bitcoin dominance suggests a potential continuation of the altcoin rally. However, traders should monitor BTC.D's price action and key technical indicators for potential shifts in market sentiment.
Key Levels:
Support: 53.81%
Resistance: 53.20%
If you find this analysis helpful, please hit the like button to support my content! Share your thoughts in the comments and feel free to request any specific chart analysis you’d like to see.

"ALTCOINS: HOLD OR SELL? BTC Dom at a Critical Turning Point!🚀 Hey Traders! 👋
If this analysis resonates with you, smash that 👍 and hit Follow for premium setups that actually deliver results! 💹🔥
🔥 Market Recap
Last night, we witnessed a massive liquidation cascade across the entire crypto market. Altcoins took a heavy hit, with many dropping 20-30% overnight, wiping out billions of dollars.
🔑 Key Takeaway:
This is why I always stress—never trade leverage without a stop-loss. Protect your capital first. Hope you all followed this golden rule!
📊 Market Outlook: Where Are We Heading?
BTC Dominance:
Breaking down from a rising wedge on the weekly time frame—a classic bearish signal.
Currently retesting the breakdown zone, indicating a potential sharp decline ahead.
🌟 What This Means:
If dominance drops further, spot altcoin holdings will likely surge.
This is the time to accumulate, not panic-sell.
💎 Opportunities Ahead
Many altcoins are retesting key support levels after breaking out on the daily time frame:
FET, W, PEPE, LTC, APT, RENDER, and more.
Patience is key here. Hold onto your spot bags and use this dip as an opportunity to accumulate strong projects.
🚀 The Road Ahead
Over the next few days, we anticipate a strong recovery across the market, with alts pumping hard. Stay calm, stick to your strategy, and ride this wave.
💬 Your Move:
What’s your strategy for this phase? Are you accumulating or waiting for more clarity? Drop your thoughts in the comments below—we’re in this together! 🌊🔥
👉 Follow us for more timely updates and winning trade setups. Let’s crush it! 💪

BTC Dominance Breakdown? Bearish Setup Ahead!Analysis: 📉
BTC.D is trading within an ascending channel, currently at the upper resistance line (~58.4%). A potential bearish setup is forming, indicating a decline toward the lower channel support and a possible breakout downward. Targets can be set within the shaded support zone
Key Levels:
Resistance: ~58.4%
Support: ~55% (critical zone for consolidation)
Channel Breakdown Target: ~54%
Ascending Channel:
The price is trending within an ascending channel, marked by parallel resistance and support lines.
The chart suggests the price has recently touched the upper resistance of the channel.
Bearish Divergence Projection:
The shaded horizontal box towards the bottom represents a critical support area around the 55% dominance level.
then
The current level (~58.35%) is identified as a possible resistance, reinforcing the bearish outlook.
🚨Risk/Reward: Attractive if the price confirms the breakdown. Watch for volume and price action around the lower channel support for continuation or reversal signals.
Disclaimer: Not financial advice. Trade with proper risk management.

TOTAL2 AND 3 SOON TO ERUPTAltseason around the corner as soon as this Rising Wedge plays out BTC.D breaks down

The exact timing of the Altcoin season !As you know, with the drop in Bitcoin dominance, altcoins yield higher returns compared to Bitcoin. Conversely, when Bitcoin dominance rises, Bitcoin yields higher returns compared to altcoins.
From the point where we placed the red arrow on the chart, it seems that the bearish waves of Bitcoin dominance have begun.
Wave A has been completed, and we are now in Wave B.
Currently, it appears we are in Wave B/X, which is a diametric pattern.
After this diametric, we expect Bitcoin dominance to enter Wave C, which is a bearish wave.
We anticipate that the altcoin season will begin from a high supply level.
This is our perspective on Bitcoin dominance.
Before altcoins undergo further correction, there will be a recovery in wave e of this dominance.
For risk management, please don't forget stop loss and capital management
Comment if you have any questions
Thank You

bitcoin dominance chart- video ideabitcoin dominance chart- video idea
Expect Bitcoin to increase while alts fall till feb next year
