Bitcoin Dominance AnalysisBitcoin Dominance is forming a rising wedge pattern on the 4-hour timeframe, which is a positive signal for altcoins. A rising wedge is typically a bearish pattern that often breaks downward. We could see a significant rally in altcoins once the rising wedge breaks.
BTC.D trade ideas

BTC.D (Dominance at Critical Fibonacci Confluence) 2025 Weekly
**Summary:**
Bitcoin Dominance (BTC.D) is testing a major Fibonacci confluence near the 66% level. This zone historically acts as a major pivot and may signal either a continued dominance rally or a potential reversal setting the stage for altseason. We use three layered Fibonacci retracements to outline dominant trend zones, key resistances, and projected targets.
**Chart Context:**
This chart uses **three distinct Fibonacci retracements** to map the historical and projected behavior of BTC dominance:
1. **Primary Fib** (100% to 0%): Captures the macro move from BTC.D \~100% down to its 0% level at \~0%, which aligns with the first altseason (2018–2019).
2. **Secondary Fib** (100% to 38.88%): Maps the first bearish wave to identify potential recovery levels. BTC.D retraced up to the 61.8% (\~73.68%) but failed to break further.
3. **Third or the Current Fib** (73.68% to 38.88%): Maps the latest bearish fall in BTC.D. As of now, BTC.D is hovering at the 78.6% retracement level of this move, indicating heavy resistance.
**Key Technical Observations:**
* **1st TP (Resistance):** 66% — Strong Fibonacci confluence zone:
* Fib2 48.6% ≈ Fib3 78.6%
* Major reversal zone historically
* **2nd TP (Support):** 52.25% — Multi-Fib confluence:
* Fib1 48.6%, Fib2 61.8%, Fib3 38.2%
* **3rd TP (Ultimate Support):** 38.88% — Historical BTC.D bottom, aligned with the first altseason.
* Intermediate Fibonacci confluences between 48%–60% serve as layered support during decline phases.
**Indicators:**
* No external indicators used; pure multi-frame Fibonacci confluence.
* Price action structure and historical patterns highlight potential market rotation zones.
**Fundamental Context:**
The current phase of the market reflects increasing speculative activity in altcoins while Bitcoin consolidates. Historically, high BTC.D correlates with Bitcoin-led rallies, while a sharp drop often triggers altseason.
* Growing inflows into ETH, SOL, and possible now XRP, and mid-cap alts suggest capital rotation.
* If BTC.D faces rejection from 66%, the market could enter a new altseason phase.
* Macro tailwinds (e.g., easing monetary policy, risk-on sentiment) support altcoin performance in the medium term.
**Philosophical or Narrative View:**
BTC.D acts as a barometer of market risk preference. As confidence expands beyond Bitcoin, money flows into altcoins—like tributaries branching off the main river. The rejection from major confluences signals this psychological shift, marking phases of creative decentralization.
**Related Reference Charts:**
* TOTAL3 Fibonacci Setup (Altcoin market excluding BTC & ETH):
* TOTAL2 Correction Probabilities:
**Bias & Strategy Implication:**
* **Primary Bias:** Bearish rejection from 66% followed by correction to 52% and potentially 38.88%.
* **Alternative Scenario:** Brief breach above 66% before reversal.
* Traders may consider rotating into altcoin exposure if BTC.D confirms reversal at the confluence zone.
**Time Horizon:**
* Mid to Long Term (1–6 months outlook)
* Weekly timeframe tracking
**Notes & Disclaimers:**
* This analysis is for educational purposes. Market conditions may evolve rapidly.
* Use proper risk management when acting on dominance signals.

Biggest Altcoin Season of this Bull Cycle is Coming! As you can see, there is a Massive Ascending Broadening Wedge forming on the #Bitcoin Dominance!
Currently dominance is located almost near the top of the wedge. More likely we will see its ascend up to 67% which will be marked as top before the dump.
The breakdown of this wedge will signal a beginning of a HUGE Altcoin Season (comparable to Autumn of 2021 or Autumn of 2023) when not only small cap, but major altcoins will be sent to new highs. With high probability it will begin in August and will last till December this year.
Mark my words & be prepared for the last opportunity of this bull cycle!

BTC.D can it go up for ever?BTC.D: A Long-Term Weekly Analysis of Bitcoin Dominance
This post is about the overall long-term trend of BTC.D, not the day-to-day action. All analysis is based on the weekly timeframe.
Fundamental Catalysts for a Trend Change
A significant downturn in Bitcoin Dominance would likely be preceded by a combination of these factors:
US Rate Cuts: An increase in market liquidity from easier monetary policy could fuel a
broader crypto rally, benefiting altcoins.
Shift in Retail Interest: A rotation of attention towards altcoins, which can be tracked by
crypto-related content views. (Note: The rise of AI Search may alter how we track this
compared to traditional Google search metrics).
"Bitcoin is Expensive" Sentiment: As BTC's price becomes psychologically high for retail
investors, they often look for higher potential returns in lower-priced altcoins.
Technical Readout (Weekly Chart)
1. Price Action & 50 SMA
So far, I'm not seeing any signs of a trend change in the price action itself. A decisive break and hold below the 50-week SMA would be a strong indicator of a major trend change. However, other indications will likely appear before that happens.
2. MACD Indicator
Currently, even a bearish MACD crossover on this timeframe would not be enough to confidently signal a larger trend reversal. It could easily just be part of a short-term pullback or consolidation.
3. Diagonal Trendline On RSI
A failure to move above the yellow diagonal trendline could be an early sign of weakness. However, on its own, this is not a strong indicator and requires other signals for confirmation.
4. Stochastic RSI
There is nothing worth mentioning on the Stochastic RSI at this time; it is not providing a clear signal.
Disclaimer:
The information provided in this post is for educational and informational purposes only. It does not constitute financial advice, investment recommendations, or a solicitation to buy or sell any financial instruments. All investments involve risk, and the past performance of a security, market, or trading strategy does not guarantee future results. I am not a financial advisor. Please conduct your own thorough research and consult with a qualified financial professional before making any investment decisions. You are solely responsible for any investment decisions you make.

Diamond on the Daily
Diamond on the Daily after an extended uptrend could signal a potential reversal in the very near future. Resistance on the Daily (blue line) would make this Diamond Pattern complete. Anything can happen, and usually does lol, but we could see a significant pullback. Time will tell!

Bitcoin dominance deeper viewBased on the volume trend and the chart pattern, it can potentially be down to %58.

Why disappointed? Btc Dominance update here Just Trust the process
BTC DOMINANCE last leg
You can see here BTC Dominance already broked it's uptrend and started it's downtrend it is just taking a move up to retest.
Soon you will see if after touching the black box area it breaks the structure on lower time frame get ready for huge Altseason 🚀 🚀 🚀 🚀 🚀 🚀 🚀
Don't worry it's just a pull back
Only the strongest will survive
This is the beauty of the Market
Hold your horses good days are waiting for you
They just want you to sell and get disappointed.
Follow me for more premium content free

BTC Dominance New Update (12H)We are truly at a critical point for Bitcoin dominance.
It’s possible that the main drop in Bitcoin dominance has already begun. If the green zone is lost, dominance could experience a deep decline, especially since the final wave of this diametric pattern | wave G | has touched the 0.618 Fibonacci level.
That said, there’s still a chance that the green zone might once again push the price near the previous high before we witness the drop in dominance. However, there are also signs suggesting that the main drop may have already started. Follow the chart closely and monitor it with precision.
For risk management, please don't forget stop loss and capital management
Comment if you have any questions
Thank You

BTC.DWill this year ever see this dang thing turn over 🥲 lol
It’s really something to see most alts not do a thing especially ETH.
While BTC has been flirting with all time highs for a while now.
What will the next half of the year bring hopefully the alt season we been waiting on since November .
$BTC.D – Testing Rising Wedge Support (4H)📊 $BTCdominance is at the lower trendline of the rising wedge on the 4H timeframe.
⚠️ A breakdown from this structure could ignite an altseason rally — watch closely!
🚀 Eyes on the reaction around this critical support.

Bitcoin Dominance, BTC ATH and ALT Seasons since 2017-some facts
There is little doubt now, that this Crypto cycle is very different from previous cycles and the main reason for this is the Bitcoin Dominance ( BTC.D) of the Market.
The reasons for this Dominance is complicated but we can certainly point towards the arrival of ETF's as one of the principle factors.
Corporations simply Buy Bitcoin, Hold it and Trade the ETF's - The Key Principle here being that the Coins are HELD Long term.
As we can see from the main chart, we have a key point in the BTC cycle called the Bitcoin Halving. To many extents, the explanation of this is not relevant right now.
But what you can see is how, previously, after the BTC Halving, we saw a drop in BTC.D,
This was due to the money Flow out of BTC and into ALT coins.
As more ALT coins were bought up, the demand drove the price higher and so their dominance increased, driving BTC.D down
This has not happened this cycle due to bulk buying of BTC for ETF's and BTC being Held Long term.
We can also see how , as we approached a certain time span After the Halving, we saw a sharp rise in BTC.D as we headed towards the next BTC ATH as the BTC buying picked up.
Again, this is not happening this cycle as the Bitcoins are being held long term.
What we can also see on the main chart is how we would normally be approaching a period of expected BTC ATH ( green vertical box )
And the HUGE question is, Will we get a Bitcoin ATH in this period ?
This is, to many extents, impossible to answer but as demand for Bitcoin continues and coins become harder to find, the price should continue to rise.
The tricky bit is, now, with a Bitcoin costing over 100K usd, it becomes harder to move the price. Only Corporations can afford to bulk buy.
So, again, things are different.. Retail is struggling to find a foot hold in the Bitcoin market, seeming to think that a Bitcoin is too expensive for them.....forgetting that they can buy a bit and that will also increase in price by the same %.
And so they look to the ALTs, fast volatile price rises and high returns,
This is seen very clearly in this chart that shows us when we had previous ALT seasons after the Halving
See how, after a period of time after Halving, the ALT Seasons appeared when the BTC.D dropped.
And that has simply just NOT happened this time.
It has to be said, it did try to appear. ALT season tried to happen.
See how after 210 days after halving this cycle, BTC.D did drop sharply but, it found a line of support and bounced back, Killing the ALT season dead in its tracks
There have been a lot of attempts since but the Market has been Bloody for ALTS, with sharp rise and Falls destroying confidence..... And Bitcoin continues to Rise.
So, where are we now ?
This Daily BTC.D chart may offer some ideas
BTC.D PA is currently at TOP of long Term range and finding it hard to get over that line of resistance.
BTC.D Weekly MACD , while not overbought, is curling over Bearish
BTC ATH's have previously been attained from Oversold areas as MACD Rose back higher.
The Volatility has gone and MACD is ranging smooth
SO, in conclusion, it is anybodies Guess right now if we will ever see an ALT season again.
Technically, on many fronts, we are poised, ready for it, even if it is a mini one.
But as we have seen on many occasions this cycle, Bitcoin is a very desired asset now and Demand drives price.....and so the Sell off that we need to drive an Alt season just may not occur.
One thing that is Absolutely certain though, we are highly likely to see another Bitcoin ATH
Stay safe everyone and Love one another. It is Free to do and is worth more than anything

BTC Dominance Update 03.06.2025🚨 BTC Dominance Update – The Moment We've Been Waiting For! 🚨
As I highlighted in my last analysis, BTC Dominance (BTC.D) just completed a deep retracement and bounced back perfectly from the black line I previously marked. 📉🖤 That bounce confirms one key thing: the last leg up was just a retracement—not the start of a new BTC.D rally!
And what does that mean for us?
🔥 It’s finally time for Altcoins to shine! 🔥
BTC Dominance is starting to give up its grip, and that means capital is flowing back into our beloved Alts. This shift has officially begun. 🚀💸
As I also mentioned in the previous update:
📍 A breakout of the black line will be our first strong confirmation of a long-term bullish trend in BTC Dominance. But as long as we stay under it, **Altcoins have room to breathe**—and run! 🏃♂️💨
So, are you ready to take advantage of this opportunity?
⚠️ Stay sharp. Stay focused. Watch those setups.
This could be the beginning of the next Alt season wave! 🌊🌈
Let’s ride it together. 💪🚀
#Altseason #BTC.D #CryptoUpdate #TradeSmart

No Alt Season For You YetAccording to Fibonacci retracement levels, you’ve been getting scammed by the so called crypto experts about the dominance weakling for 2 years. This chart shows that the dominance broke below 0.618 level where people started calling for alt season, but when 0.618 turned into support non of the scammers on trading view warned you that alts will get crushed. Afterwards, dominance surged to above the 0.786 level. Soon after breaking above the 0.786 level domiance momentarily broke below this level where the crypto scammers told you that the alts season is coming. Surprisingly, the chart printed a weekly close above the 0.786 level and this level became the new support level for dominance. It has been a good support level so far and the next resistance level stands at 70-73 %. The fact is that your crypto gurus are as clueless as you and I, so analysis your own charts and don’t listen to these fake crypto experts.

Why there is no hope for alts at least before 73% BTD.DHey,
I'm watching market for last 1year to see what happens where.
No long Story, CRYPTOCAP:BTC.D needs to hit 73% first, Like next 1-3 months,After that we can see a HUGE altseason where everyone will lose their mind.
GL
DYOR

BTC.D – Rising Wedge Under Pressure🔍 CRYPTOCAP:BTC.D is currently tracing a rising wedge pattern, with price pressing against the trendline resistance.
⚠️ Watch for a potential rejection or breakout. A confirmed breakout and retest could signal stronger BTC dominance ahead!
👀 Remember, BTC dominance often moves inversely to altcoin market cap — this setup could impact alt season momentum. Stay tuned!

Phoneix is coming backdoes not include financial advice.
the graph is back to its 2019 appearance
let's see if he can spread his wings this time

TOTAL3(except Stables) Vs BTC.D🔍 Left Chart – TOTAL3/BTC (Altcoins vs BTC)
Shows relative strength of altcoins vs. Bitcoin.
Currently at 0.29, retesting previous support (yellow line).
Clear breakdown from 0.30–0.32 zone, which was an important range.
🟥 Red drops at support = further altcoin weakness likely.
🟡 Moons/suns = former balance zone → now resistance.
This suggests altcoins are underperforming BTC—capital may be flowing back to Bitcoin (or out of the market).
🔍 Right Chart – BTC Dominance (% Market Cap)
BTC dominance is approaching the key 64.57% resistance level (yellow line).
If BTC dominance breaks out, it confirms capital rotating into BTC and away from altcoins.
🟥 Red drops above = a potential reversal/resistance zone—but if broken, altcoins may bleed more.
📊 Implication:
Altcoin vs BTC pair is weakening, while BTC dominance is strengthening.
This combo suggests a "Bitcoin-only" phase, often seen during risk-off periods.
Traders may prefer to rotate into BTC or stablecoins, avoiding alts for now.

BTCD They say nothing goes up in a straight line… well BTC dominance have plowed its way to the top half the year has gone and we have yet to see a real significant turnaround after going up several years.
My thesis is that we tank super hard it won’t be gradual at all.
Time wise..? I figured it should have turn around at 62.% but we have that crazy wick up the up side . And continued to fill it in going up to 65% where we are still ranging.
Very curious to see where the 4 months going lead us .

ETH/BTC vs btc dominanceethereum received a reaction as we expected from the current demand zone in the bitcoin pair, and it seems inevitable that the upward momentum from the current area will continue. on the bitcoin dominance side, the same situation exists, but I think we will witness a bearish absolute process.


BTC & BTC.D – Key Moves in 1H TF
BITSTAMP:BTCUSD CRYPTOCAP:BTC.D
🚀 CRYPTOCAP:BTC is breaking out from a falling wedge on the 1H timeframe — currently in a healthy pullback phase. Bulls need to hold $107.2K–$109.3K to flip bias fully bullish, with resistance re-tests ahead.
📈 Meanwhile, CRYPTOCAP:BTC.D is forming a rising wedge on the 1H — a bearish pattern that could break down and boost altcoin momentum.
⚠️ Shorter timeframes always come with more risk, so stay sharp and watch those key levels closely!

BTC.D Divergence Detected – Altcoin Window Ahead ?Hello Traders 🐺
In the past few weeks, I decided to publish fewer ideas in order to step back, observe, and see what’s really going to happen in the market — especially in the Altcoin market.
Now I believe it's a good time to take a look at the chart and break down what’s most likely to happen:
As you can see on the weekly chart, we have a descending channel on the RSI, which means the relative strength of BTC.D is diverging from the BTC.D chart itself.
But why does this matter?
Let me explain:
As a trader, you should always follow the bigger picture. The higher the time frame you analyze, the more reliable your analysis becomes.
If you only follow lower timeframes like 4H or 1H, chances are high that you’ll get manipulated by the bigger players — because the market is extremely volatile and requires real discipline to survive and grow.
But what about the immediate short term?
📉
In my opinion, BTC.D is most likely about to test the 0.786 or 0.88 Fibonacci levels in order to form a double top pattern.
So we can expect a bit more downward pressure on Altcoins, and this area could be considered a great entry point if you’re planning your next move!
I hope you enjoyed this idea — and as always, remember:
🐺 Discipline is rarely enjoyable, but almost always profitable 🐺
🐺 KIU_COIN 🐺

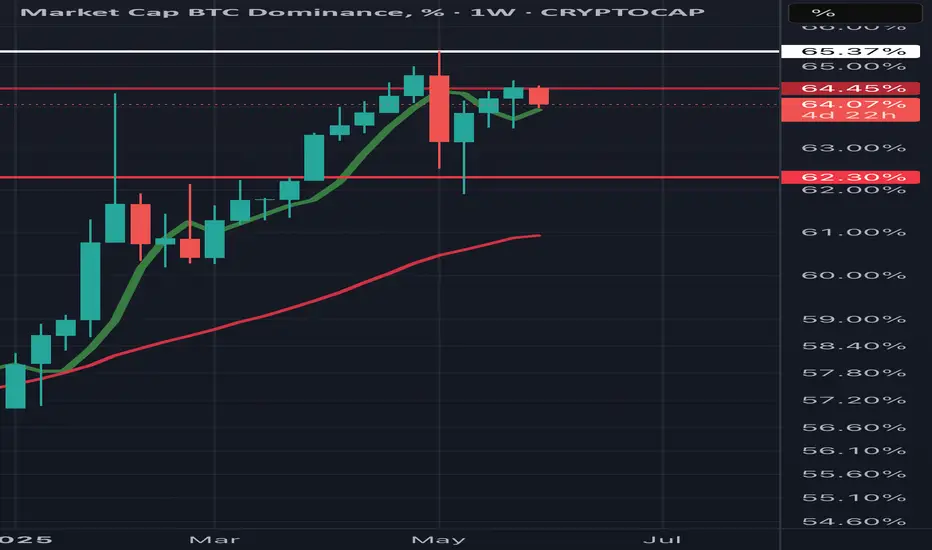
$BTC.D Dominance forecast: update May 2025📉 BTC Dominance (%BTC.D) Update – At Resistance, Altseason in the Balance
Back on April 5th, I published a forecast highlighting the critical 65% resistance level on BTC Dominance. That analysis still holds: BTC.D reached 65% and got rejected, pulling back to 62% as of now.
⚔️ What’s Happening?
Bitcoin dominance is compressing, and we're approaching a make-or-break moment:
🔹 Resistance confirmed at 65%
🔹 We bounced down to 62% — not up
🔹 Market is hesitating, and the next move will shape the short-term direction for alts
🔍 The Bigger Picture
Bitcoin pumped hard recently, mostly due to:
MACD reversal on the weekly
Oversold conditions now turning bullish
Renewed institutional interest in risk-on assets
But let’s be clear:
🚫 We’re not in a full altseason yet.
What we’re seeing is cautious altcoin rotation, not a blow-off alt rally.
📊 Tech Indicators
MACD: Overheated
RSI: Still has room to move up
So technically, BTC.D could still break out above 65% — but it hasn’t yet.
⚠️ What to Watch:
If BTC.D breaks out above 65%, expect:
➡️ Altcoin bloodbath
➡️ BTC.D could head toward 70%, crushing the mini-altseason
But if BTC.D continues to drop from here?
➡️ Altseason starts to heat up
🔮 Outlook
A true altseason might not arrive until September/October. For now, the market is stuck in a range of uncertainty.
Keep your eyes on:
BTC.D reaction at 62%–65%
TradFi stress (bond markets, macro fears)
Bitcoin strength and ETH/BTC ratio
🧠 Take profits when you can. Protect your capital.
📌 Follow me for future updates—and don’t forget to DYOR.
📎 Original forecast:
