Bull Run 2025 !! Btc.d droppingi am right and told u guys.Saw my last post, now wait for pivot exit. just before a rate cut.
BTC.D trade ideas


Altseason Has Been Started (But I Am Not Sure...)Hello, Skyrexans!
Let's carefully make update on CRYPTOCAP:BTC.D because previous analysis where I bet for local top slightly above 65% is playing out even stronger than I supposed. Today I will show you why altseason could be already started, why I am not sure and where is the critical level.
Earlier I told that daily time frame does not suit for this Elliott waves cycle measurement, but we have 155 bars there, slightly above 140 bars, so we can count it as a valid. Moreover we can see zero line cross on Awesome Oscillator, but again only slightly. That's why I am not sure if uptrend on dominance is over or we shall wait for earlier predicted wave to 67%. But anyway I am sure that 60-61% will be reached before, so it was not a mistake to be in altcoins from 65.3%. When price will reach Fibonacci level we will see how it will approach it and make a decision about our altcoin's holdings.
Best regards,
Ivan Skyrexio
___________________________________________________________
Please, boost this article and subscribe our page if you like analysis!

BTC DOM TF H4BTC dominance is currently at support, will it retest the 63% area, the decrease in BTC dominance requires consolidation to continue the decline and this is a good sign for Alt Coin

Start of the Altcoin Rally - (not Altcoin Season)My analysis approach involves applying the Fibonacci function. I use the trend-based Fib extension to determine the target level, and the Fib retracement to determine the correction level. I also utilize the Elliott wave principle. Both produce the result shown. For clarity, I'm representing the A-C wave in turquoise, drawn from the (0) point to the (A) point to the (B) point to the (C) point. Beforehand, I drew the trend-based Fib from the (0) point to the (A) point to the (B) point, which then represents the area (target level) in green, yellow, and red. When the price reaches the target level (ZL), the Fib retracement is drawn from the (0) point to the (C) point, which then represents the potential correction level. The result shows that the price reached the 1.618 Fibonacci level (green line) at 65.30%, followed immediately by a countermovement to the south, which likely caused the altcoins to pump. However, I believe that the altcoin season only started when the (0) point was broken. Before that, I expect a reaction to the north when the (0) point is reached, eventually reaching the 0.783 Fibonacci level (purple line). After that, it's off to the south. I would describe the end of the altcoin season in a separate idea.

Bitcoin Dominance is testing the monthly 100 EMA — and stalling.Bitcoin Dominance is testing the monthly 100 EMA — and stalling.
Price action shows clear hesitation at a key macro level.
If this holds, alts could catch a bid for the first time in months.
Break it? Altcoins stay sidelined.
Critical moment for market rotation.

BTC.D is started to melting downThe MARKETSCOM:BITCOIN dominance bounced off a very critical level. It seems that the altseason is just started. The upcoming altseason will be face melting. Fill your bags with valuable alts ...

4 X Crypto Dominance charts showing Where the money goingCRYPTO MARKET DOMINANCE CHARTS
These are 4 hour charts, showing PA from Mid April to now.
BTC.D - ETH.D
OTHERS.D - USDT.D
RED line = 50 SMA
BTC.D - Dips, Showing money flow into other Assets. PA has fallen below the 50 SMA and yet the price has remained static above 100K. The fact that the Dominance chart is dropping is more a sign of the increase in Selling, Profit taking and the increase in Dominance of other Assets and the fact that the price is unchanged, slightly higher, also shows the demand for BTC remains strong.
ETH.D - Climb showing some ETH recovery though no where near the climb that Bitcoin has made. The ETH Dominace can also be reflecting the increased Dominance of ALTS on the ETH network. In the last 24 hours, The ETH dominance has Fallen slightly
OTHERS.D - Rapid climb - Top 125 coins minus the Top 10 ny market dominance.
MID to LOW Cap ALTS taking most of the Money. This will include all ALTS on any Vlockchain, including the TH network. Some Massive gains here signaling ALT Season though I am uncertain how long this will ast.
BE CAUTIOUS
USDT.D Drops showing money leaving Stable coins and moving to Assets. When stable coins get sold off, it is a sign of confidence in the market, Foe me, MOST of the money flowing into ALTS right now are coming from the Stable coin sell off
As I mentioned just now, I remain cautious about this right now,
Watch that BTC.D like a Hawk because THAT is the signal of change in this.
The Table below explains ( sorry for the formatting )
BTC.D- BTC - ALTS
increase- increase- Decrease
increase- Decrease- Decrease Rapid
increase- Stable- Stable
Decrease- Increase- Increase Rapid
Decrease -Decrease- Decrease / Stable
Decrease -Stable- Increase

BTC DOMINANCE We got the rejection Inside the channel, that is the good indication for alts It’s the beginning of all season you have to just accumulate the alts at that point
Welcome to ALT SEASON (Real) | BTC.D & ETH/BTCCRYPTOCAP:BTC.D is rejecting off 2021 POI and deviating this cycle's high having just closed the weekly under 64%. Coupled with CRYPTOCAP:ETH strength showing signs of a trend reversal after downtrending for 4-year against $BTC. Likely see CRYPTOCAP:ETH trade upwards of US$5000 this year as ETH outperforms BTC.

BTCDThe 200day should be the main target to get to first and under before we get to excited …
still looking good. Was once support will now be resistance.

BTC DOMINANCE MAY 11 2025 may 11 2025.Sunday
need a clean break of the uptrend
current market scenarios
m2 global money supply charts and bitcoins comparison
crytpo lark
coin beauru
toray innovation markets
crypto nagato
dogecoin curated alex charts
trumpcoin in 2025
sellers from 100,000 top
nico serey and altcoin season
xrp .60 to $1-2.50 bull euphoria bull run and massive whale accumulation and buying
interest rates
china and trump agreement on tarrrifs and physical dominance of money.
continue to go mark up where crypto market and market cap will go also following money inflow and whales activity
intelligent cryptocurrency
photos notes

BTC Dominance New Update (12H)This analysis is an update of the analysis you see in the "Related publications" section
We had a bullish diametric for Bitcoin, and it seems that the price has reached the highest point of this diametric. Wave E of this diametric, which is a bullish wave, is nearing its end.
We refer to this as the highest point because Wave G might not reach the peak of Wave E.
We expect a rejection from the red box, and this rejection could be very strong. Smaller altcoins could experience a significant pump.
A daily candle closing above the invalidation level would invalidate this analysis.
For risk management, please don't forget stop loss and capital management
Comment if you have any questions
Thank You

Bitcoin Dominance Important UpdateHello, Skyrexians!
CRYPTOCAP:BTC.D showed rapid decrease and as a result we have some changes in the analysis. Hope you remember the yellow Elliott waves cycle which according to my previous analysis was not finished. But now looking at the Awesome Oscillator I changed my mind and now we in the higher degree wave 4.
We will switch from 12h time frame to the daily and can see that wave 4 is already in progress. This wave is going to be ABC shaped and in my opinion reach 0.5 Fibonacci level at 61% or even lower to 60%. Then the final wave 5 will reach 67%. Wait for the update I will tell you when wave 4 is finished.
Best regards,
Ivan Skyrexio
___________________________________________________________
Please, boost this article and subscribe our page if you like analysis!

Total 3-btc.d-usdt.d
"The timeframe for review is the daily timeframe. 🗓️
Generally, if we examine TOTAL3 📊, USDT.D 📉, and Bitcoin dominance 👑, we see that TOTAL3 is engaged with a weekly resistance 🚧.
Bitcoin dominance 👑 is engaged with a support 💪 that is visible on the weekly timeframe 🗓️.
And Tether dominance USDT.D 📉 is also engaged with a support 💪 that is visible on the daily timeframe 🗓️.
Considering this 🤔,
It can be said that Bitcoin dominance 👑 might have an upward movement 📈 within the 4-hour timeframe ⏳.
Tether dominance USDT.D 📉 might also have an upward movement 📈, but our main support is at 3.98 👇, so it will likely continue its downward trend 📉.
TOTAL3 📊 is also engaged with a significant resistance 🚧, so altcoins 💰 might also have a correction 📉 within the 4-hour timeframe ⏳.
Of course, we haven't seen any weakness ⚠️ in the 4-hour timeframe ⏳ for any of these indicators yet. By observing weakness ⚠️ and its confirmation ✅, the above expectations can be considered 🤔.
I emphasize 📢 that the opportunity to buy altcoins 💰 has not arrived yet ⏳.
By observing weakness ⚠️ in Bitcoin dominance 👑 and confirming that weakness ✅ along with the growth 📈 of TOTAL3 📊, a suitable opportunity to buy altcoins 💰 can be considered 🤔."

BTC Dominance Weakening – Altcoins Gaining Strength?🔥 BTC Dominance Alert
📉 BTC.D is showing signs of weakness, creating an opportunity for altcoins to shine!
👀 Watch for a potential shift as alts start to gain momentum.
🎯 Key observation—keep an eye on the alt market, as dominance wanes and alts may take the lead.
🌱 We could see more green across altcoins as BTC.D weakens!

This Has Happened To Bitcoin Dominance ...And Alts Are Ripping!Trading Fam,
For the first time since December of 2024 Bitcoin Dominance has dropped from this ascending channel ...and the drop is nothing to be scoffed at! Dominance has dropped and it dropped hard, possibly signaling that finally, for the first time in 4 and a half long years, altcoin season may be starting!
Now, I know this altcoin season will probably not be like those we have seen in the past. There are simply too many altcoins out there. This will dilute the market in ways we have not experienced in the past. Nevertheless, the best of the best will shine bright and will be where money is made.
This is just the beginning. If Bitcoin dominance continues its trend downward (and I believe it will), I see the best altcoins doing 10-20x from here. And yes, some of these will be memecoins - Fartcoin, SPX6900, Trump come to mind (to name just a very small few).
If you are not in the game right now, I'd suggest preparing yourself. This stuff is going to take off so fast that it will make heads spin. FOMO will be rife. You've had 4 and a half long years to study and do your research, now it the time to put all of that knowledge to the test.
I suspect the cycle will be quick. Like 6-8 months quick. While Bitcoin continues to make steadfast gains and all the attention, headlines, and focus remain on it, Altcoins will start to scream in the background. Our new SEC chairman is crypto friendly. Age old illegal lawsuits by Gary S.(Satan) Gensler and the SEC are being lost or dropped at an exponential rate. This freeing effect will enrich the crypto community in ways never imagined.
Don't give up now. This is not the end. We are only beginning.
If there is anything that I have learned over my years of investing in future thinking products and assets it's that the collective is extremely slow in adapting technologies that will be the future. On average, the collective is often 15-20 years behind. The collective is nervous, unsure, anxious, hesitant, and doubtful. But we've known all along that crypto is the future. Believe. This is the beginning. Good things are about to happen to those who have been patient.
Best,
✌️ Stew

BTC Dominance is breaking — Altcoin season has begun!BREAKING NEWS
When BTC dominance breaks while Bitcoin itself goes up, it means we've reached altcoin season. This is happening right now! Get ready for the altcoins to explode.

BTC.D Bearish confluence along with rising ETH.DYou can also take a look at BTC/QQQ and BTC/USD which seem to face strong resistance as well.
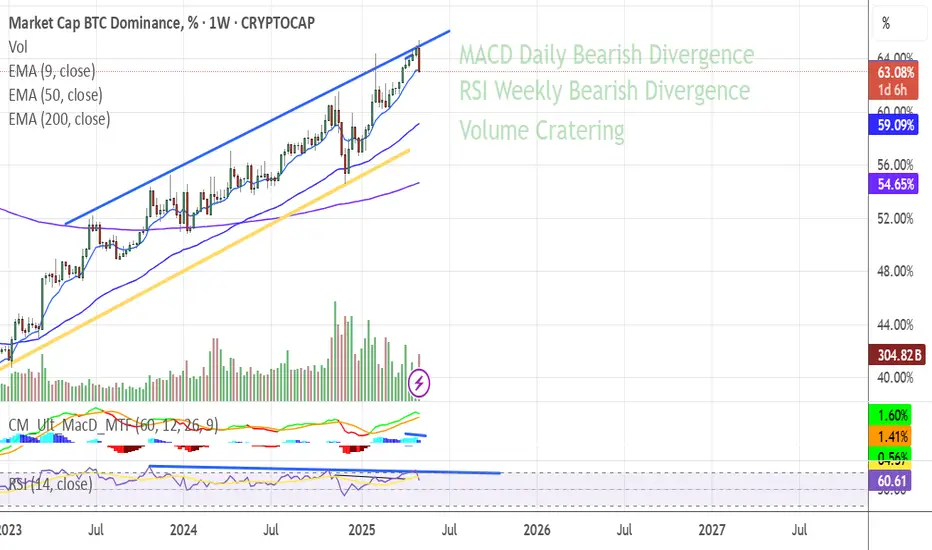
Bitcoin Dominance TA, Bearish SignalsRecently I spotted a very strong, long-term bearish signal on this index. A triple-bearish signal as it is present with three indicators. I am talking about a bearish divergence.
Volume has been dropping significantly as the index moves higher.
The weekly RSI peaked October 2023 and has been producing lower highs. The MACD peaked July 2023.
These are long-term, but let's have a closer look and consider the daily chart.
Here we have some interesting signals as well, let's start with the candles:
—Here we have a rising wedge ending in a rounded top and long-term double-top. The uptrend is also in risk of failing. A breakdown of this uptrend, which can happen anytime, would result in a strong crash of this index.
Next is the daily RSI:
—The peak happened November 2024. There is also a short-term lower high as the peak this month happened on the 7th of April, the index peaked on the 22nd.
—The daily RSI is already trending lower.
Clearly the most interesting and revealing of all three indicators is the daily MACD. Let me show you the chart first and then I'll describe the signals:
—Here the lower high is so strong that reveals what is coming to this index. The MACD peaked in February and produced a lower high this month, April. Notice the bearish cross, it happened yesterday.
The daily MACD and RSI trending down with short-term, mid-term, long-term and long long-term bearish divergence all point towards a lower reading on these oscillators.
The last major drop for this index happened in November 2024 with the bottom hitting a month later, December 2024. At this time Bitcoin produced a very strong advance as well as the entire Altcoins market, it was awesome.
It is surely interesting to notice that the index recovers and moves higher while Bitcoin continued to grow. But at that time the Altcoins were starting their correction. Most of the Altcoins peaked late November 2024 and some in early December 2024. So this index is more related to how the Altcoins behave rather than Bitcoin.
When it drops, it does not mean that Bitcoin will drop but that the Altcoins will grow. When it grows, it does not necessarily means that Bitcoin is moving up but that the Altcoins are moving down.
We know the Altcoins are set to produce their strongest growth period since 2021. This Bitcoin Dominance index works as confirmation. It leaves no room for doubt.
» Doubt can remain open as to whether the start of this rise will happen tomorrow or within a few weeks. Short-term, anything goes; the market can become erratic and produce some strong shakeouts, specially preceding a major wave of growth. But after 2-3 weeks, it is 1,000% certain that the entire Cryptocurrency market will be bullish and up. Regardless of what this index does or anything else for that matter. When the time is ripe, the market grows.
The time is ripe right now... You will be happy with the results.
Namaste.

ALL WHAT YOU NEED IN CRYPTO MARKET IN ONE analysis HERE Bitcoin Dominance: The Approaching Cycle Peak and Major Correction Signal
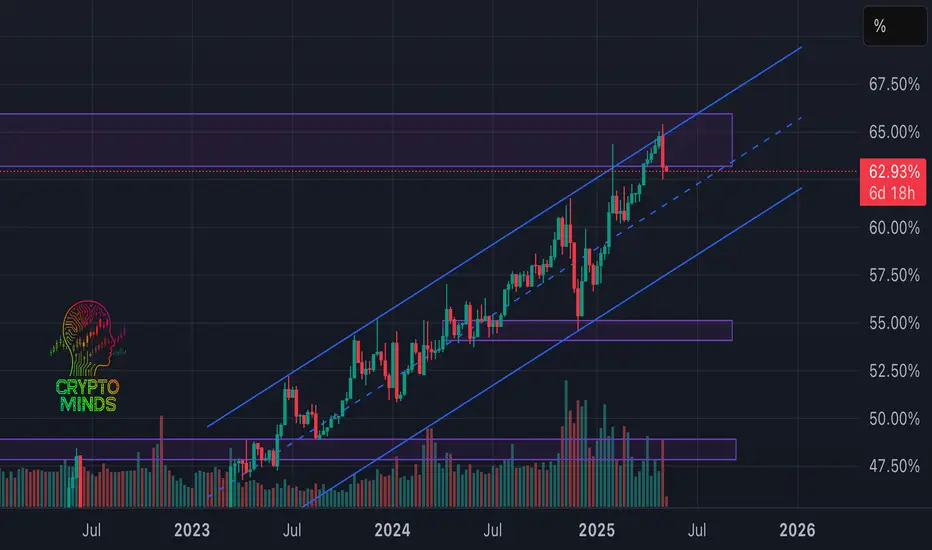
The Bitcoin dominance chart from May 10, 2025, reveals a fascinating technical formation that forecasts a significant market shift in the coming months. Currently at 63.39%, BTC dominance has reached a critical inflection point that demands investor attention.
Pattern Analysis: Terminal Extension Phase
The weekly chart shows Bitcoin dominance has formed a clear ascending channel (yellow boundaries) since the 2022 bottom. What's particularly noteworthy is how price action has reached the confluence of two major resistance zones:
1. The long-term descending resistance (white diagonal) dating back to 2021's 73.63% peak
2. The upper boundary of the current ascending channel
This dual resistance intersection creates what technical analysts call a "Terminal Extension Pattern" - typically the final phase before significant trend reversal.
Distribution Structure Forming
The two horizontal red zones represent likely distribution ranges where institutional investors may begin rotating capital from Bitcoin into altcoins. These distribution zones are strategically positioned at:
- Primary zone: 62-65% (current trading range)
- Secondary zone: 55-58% (first major support)
Projected Correction Pathway
The blue arrows map the anticipated dominance decline:
1. Initial rejection from current levels (63-65%)
2. Corrective bounce at first support (55-58%)
3. Secondary decline toward 50% psychological level
4. Final capitulation toward 38.84% over 6-12 months
Market Implication: "The Great Rotation"
This technical setup suggests the cryptocurrency market is preparing for a significant capital redistribution from Bitcoin toward alternative cryptocurrencies. The declining volume (-0.40%) despite upward price movement (+0.03%) indicates diminishing momentum, a classic divergence preceding major reversals.
The implications are substantial for portfolio strategy - while Bitcoin may continue appreciating in USD terms, altcoins may outperform substantially on a relative basis through 2026, creating exceptional opportunities for portfolio rebalancing.
Investors should monitor the 65.38% level closely as the final resistance before confirmation of this multi-year reversal pattern.
OTHERS.D chart analysis here
and for ETH-BTC analysis here
and for ETH.D analysis here
HELP US WITH LIKE AND FOLLOW GUYS .. THANK YOU

btc DBTC DOMINANCE UPDATE
I think it will rebound from Fibonacci 4.23 in the coming weeks and will be positive for the currencies. Wait for the bullish rockets.

DECEMBER PUMP REPEAT?1-The Btc.d has fallen super greaty. it was suppose to fall from the OB it is staying on due to this, when market went more high it actually helped increase seller movement.
2-The weekly rsi, Daily Smc and Rsi, all together suggest a massive drop close to 60%.
3-The weekly last low will not break, it can be swept but not break. In this condition after massive drop a massive high of Btc.d will occur.
4-If market actually close below weekly high and new week candle didnt close bullish or swept the previous weekly high. the Alts Will Pump crazily.
5-The Alternative Of this means Bullish for BTC.D and Bearish for Alts.
6-Be Alert in news, if massive rally comes due to news book least 70% because market is gonna crash harder.
7-Trade carefully,with patience and earn well.
Hope We all Get Good Profits.
