BTCAUD trade ideas
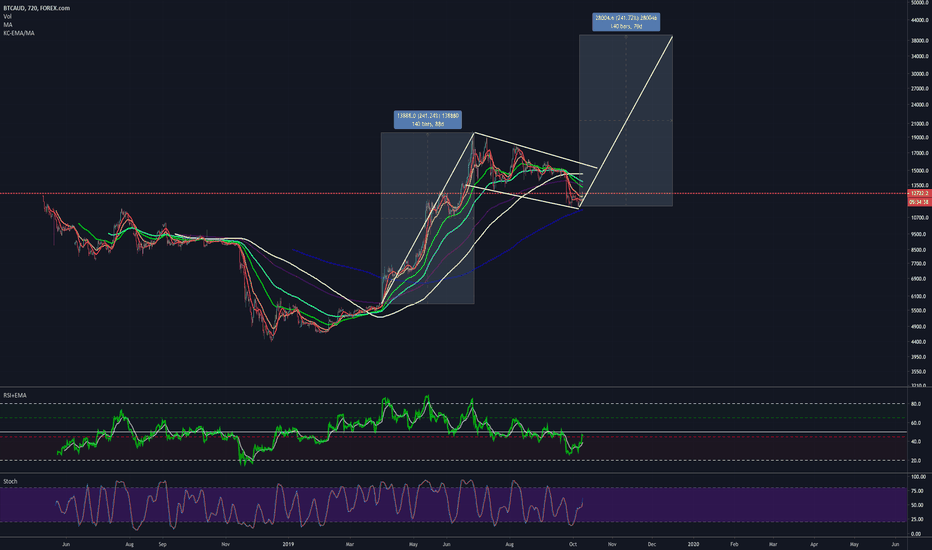
CUP & Handle target Fibo Projection parabolaThis chart projection is valid for all BTC vs Fiat. We are in a parabolic move that targets AU$900.51
In my opinion BTC will want to test the bigger number. $1,000 and could go even higher and stay sky high, as BTCs are of limited availability and still subject to laws of supply and demand it is hard to put a final price target.
BTAUD Trading above the 76.4% Fibo It is interesting to compare BTCAUD vs BTCUSD, BTCJPY, BTCGBP, BTCEUR etc
pull up an Ichimoku chart and add Fibo retracements too.
AUD is leading the way !!! it is well above the 76,4% retracement, the other fiat currencies have some catching up to do.
Price above the 76,4% means there is a good chance it does a full 100% and test the highs.
The Ichimoku chart is interesting as it helps follow and understand strong trending markets, it gives you an idea where to go long, till the trend stops. The green line you see at 186 is the place where to expect bounces, and a cross over of the green line with the blue line will tell you the trend maybe changing, as it showed between July and Mid September when it fell into the cloud.
Now we are back in the up trending market and the cloud is near 176. Bullish till we trade bellow the cloud.


