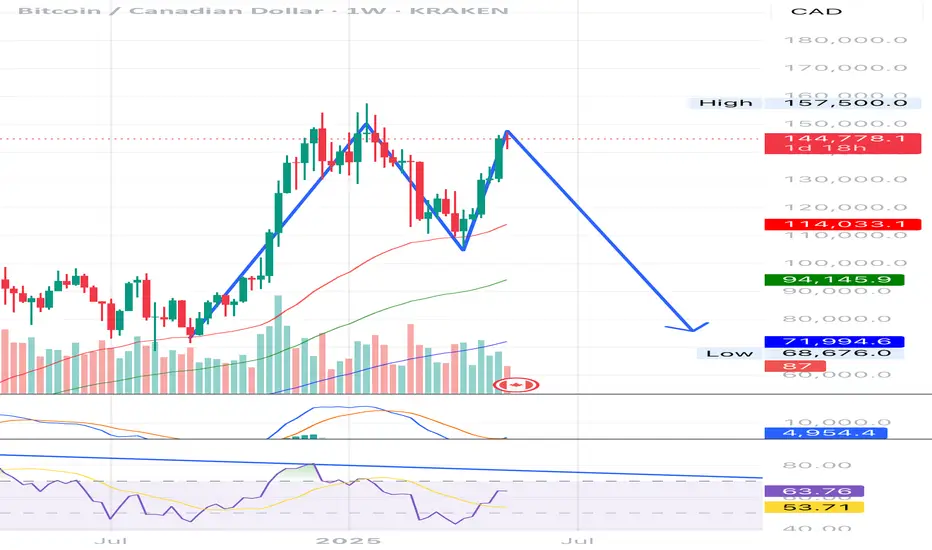
Bearish move coming in BTCCAD?Double top pattern may be formed in BTCCAD.
It’s a possibility that 3rd time rejection from RSI resistance may happen and form double top pattern. Would wait for 2-3 weeks more for a better signal.
BTCCAD trade ideas
Bitcoin doing a retest ! As advised earlier,
BTC is doing a retest of its breakout. Once it reaches between 105-110k CAD, it will go up again. Add between these levels.
It has also adjusted the highly inflated RSI.

Bitcoin to correct 18-20%Bitcoin has risen after its breakout from the trendline owing to a C&H pattern, however after every breakout comes a retest which hasnt been done in btc till now.
In my opinion we can see a selling rally till around 105k CAD.

BTC Bullish Trend Weekly BTC-CAD Chart.
Clear breakout of C&H Pattern done, Current RSI at 77, resistance of around 85 levels. Approx 145,000 levels. Profit booking can be done at these levels, gap filling can be done.


See how BTC heads towards all of my lines my intersecting lines I think I've come up with a way to follow BTC and other coins with my lines and TR Main

I use lines to find the sweet spots in the chartFinds the sweet spots in movement and heads towards them.

Til TR Main Hybrid System works for me, I don't work for it. That Man's a great Teacher. You should listen. Astutely

Follow my chart and if it works I will say how I chart with lineFollow my chart and if it works I will say how I chart with lines and TR Main Hybrid System. Showing is better for me. I am not a good explainer.

Trend line analysis - Weekly Trend line analysis - Weekly Timeframe
These curves & triangles highlight support/resistance zones on a weekly timeframe. Fairly conventional methods used. RSI & MACD incidators aswell. There are two triangles highlighting the possible RSI outcome if the support/resistance zones hold out.
I believe it will break out upwards after completing this formation but hold a neutral sentiment.

Possible Triple BottomIm suprised no one else from what ive seen saw this pattern forming. Not financial advice

Possible Triple bottomI am really suprised no one else saw this but this could be a triple bottom forming on the daily chart

A strong correction will mean strong future supportIf Bitcoin follows the Fibonacci , to the .382 or .5, the result should be a strong support structure for future growth.
I think it should then be considered a healthy market correction after such a long monthly bullish move.
There most likely will be a lot of BUY opportunities in the .382/.5 zones.
This is not professional advise. Do your own research.


Possibility for BTC priceIf we check what happened the last time BTC drop in this run. It dropped 30 % and rise 100% (in 30 days). The current drop was 24%, if BTC react close to the same way it did in January. By the end of march we could see 111000$ CAD per BTC. It is only if the price rise the same way. In the past, March hasn't been a good month for BTC bulls.
So far, for this drop, nothing to worry about since we're still close of the 20 EMA.
Let's see how things goes.

$BTCCAD BreakoutStrong support ~$44k with bullish signs. Planning on getting more BTC on the next dip.
Seeing a head and shoulders and BTC wedging, getting ready for a breakout IMO!


We should be able to run until the 23.6% fibonacci retracement.Something has to slow the upward climb of Bitcoin. 5% in the last 2 days.


BTC Long Term: Breakout by December past ATHFairly interesting to note that BTC / CAD has been trading within an ascending triangle. Given the slope at the base is at a fairly high angle, bulls seem to be succeeding over the bears.
This is typically a bullish sign and we do see a compression of volume as is associated with this consolidation pattern.
Needed for confirmation is an increase in volume over the month of December the break out past the resistance level. If there is no increase, there is a high likelihood that this trend will continue past the apex, given that the potency of a triangle dwindles if the pattern hasn’t broken out by 2/3 of the shape.
If successful, the price objective would land us past 87000.

Pushing upStay above 21 daily MA at 11900 and 21 weekly MA at $10900. A break below 21 daily would be bad as it's showing signs of acting as support. A break below 21 weekly would show a likely change to bearish trend. I have written about the significance of 21 weekly MA before. The Price is pushing at top of bolligerband with 2 standard deviations on the daily chart. That is a bullish signal in my opinion also. There is still a threat of post having dump in but I don't see it in the chart and try to follow what the charts show not the news.

