You Really Think that the Altcoin Season is Over?The way it looks is that Bitcoin Dominance yet again approached and rejected our Fibonacci resistance. If that resistance holds, we do expect a strong, yet potentially short altcoin season.
But remember, not all coins will produce super gains, only a very small portion of them. In our private channel we have shared those that we believe could be those "gems"
BTCDOMUST.P trade ideas

Altcoin Surge Ahead: Bitcoin Dominance Trend Analysis🔅The Bitcoin Dominance chart is presenting signals of a potential trend reversal or, at the very least, a substantial pullback. The repeated failure to breach the supply zone on two consecutive occasions highlights the resilience of altcoins against Bitcoin.
🔅The current hold within the supply zone indicates a pivotal moment where the long-anticipated altcoin season might begin or continue its ascent. This juncture could offer compelling buying opportunities for various altcoins, both in the short and long term.
🔅Further updates and insights on these potential opportunities will be shared in our VIP channel.

BTCDOMUSDT-IN BEARISH TRENDBTCDOMUSDT is in a bearish trend and start printing LLs and LHs, price get rejected where it forms H&S pattern and also rising wedge, we can expect the price to hit our target easily, what do u guys think? let me know.

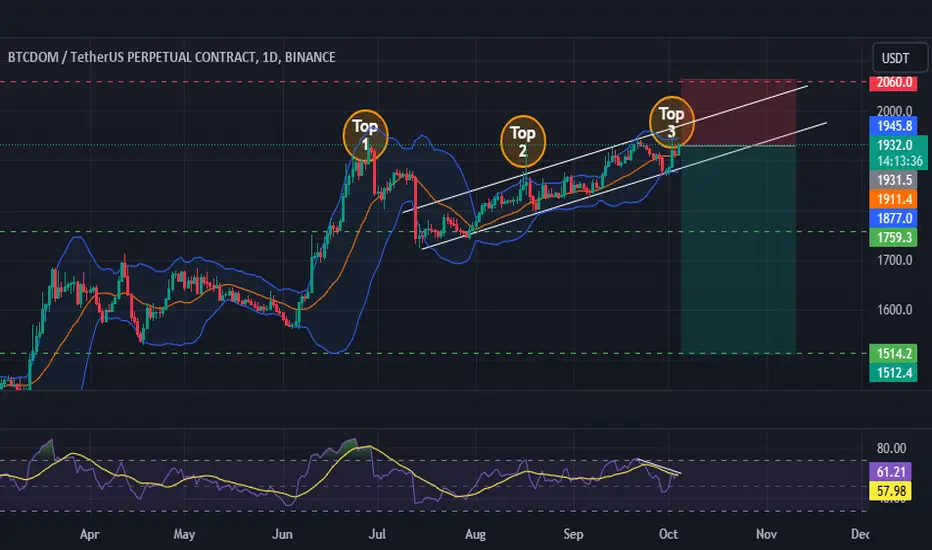
BTCDOM | What goes up, must go downFrom a purely technical standpoint
The chart before us has several distinct signs of bearish activities.
RSI Bearish Divergence
Rising Wedge (It's not broken yet but it's a matter of time)
Triple Top pattern (Not fully confirmed, but it's also a matter of time)
A Short trade should work fine here
Stop loss : 2060
Take profit 1 : 1759.3
Take profit 2 : 1515.2
BTC DOMINANCE Hello Trader BINANCE:BTCDOMUSDT.P
NEW ATH (all time high). will it be noise or even break again? for today btc dominance officially touched its ath.
Please add a comment and Positive feedback and
constructive criticism are important to authors and the
community.
Disclamer: Not Financial Advice
all leverage 20X

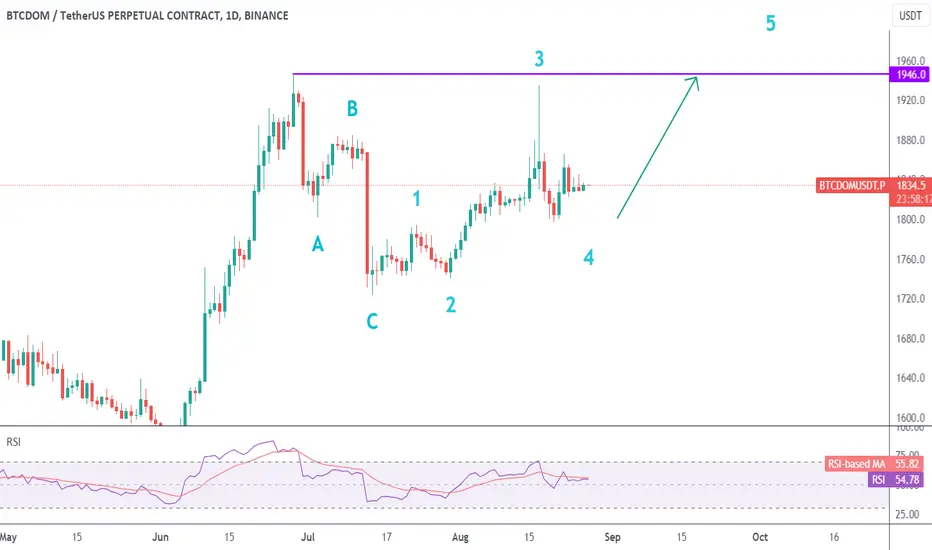
BTC.D Should target new highs
My current wave count considers we're in wave 4 correction, and I expect further upside from here, targeting June's high.
This favours BTC when compared to altcoins.
BTCDOMINANCE FREE FALL INCOMIN ??BTC dominance is currently in the extreme overbought zone in lower tf as shown by the indicators.
In my opinion and according to my analysis, a short term recovery is coming soon as it is being rejected by the golden pocket..
and double top is on 15 min chart..
NFA

BTCDOM Cup and Handle FailurePreviously, I shared a Cup and Handle formation on BTCDOM. The target for the Cup and Handle was 500 billion.
Yesterday, following the favorable ruling about XRP’s legal standing this pattern broke below the 340 billion support level.
It is still a bit early to call an altseason because there was no retest of the 340 billion level as resistance. Regardless, the drop in BTCDOM is a positive sign for altcoins.
NFA.
What do you think? Please share in the comments.
Best Wishes.

Bitcoin Dominance is Close to its TopTLDR:
• BTCDOM is in the final stages of a Cup and Handle Formation.
• Max target for BTCDOM is 500 billion.
• I estimate that BTCDOM still has two or three months of upside. During this time Bitcoin will perform better than most alts. However, BTCDOM is close to toping. Once BTCDOM realizes its full potential I expect the alt valuation in BTC terms will increase.
Background:
• In a previous TV idea, I covered the TOTAL 3 Chart (linked). My conclusion was that the altcoin bear market is close to its end. I wanted to corroborate or refute this Assessment by reviewing the BTC Dominance chart. I am happy to tell you that my bias seems to be accurate.
• To be clear Bitcoin is mega-bullish and I expect it keep being bullish. The only aspect of bitcoin I expect to diminish is its dominance in the crypto market.
Chart Analysis:
BTCDOM is in the final stages of a perfect Cup & Handle formation. These include the following:
1. Uptrend: BTCDOM was in an uptrend since May 21st until June 22nd . During this period BTCDOM rose by 195%.
2. Correction/Cup: Since March of 2023 BTCDOM was in a correction. This correction took the shape of a rounding bottom. The lowest point of this correction touched the 0.382 fib retracement. This is a valid Cup.
3. Handle: During the Months of March and April BTCDOM consolidated in a Bull Flag which is valid for a handle.
4. Breakout: BTCDOM broke out to the upside on the weekly candle of April 24th. BTCDOM tested the 338 billion level as support on the weekly candle of May 29th.
5. Target: The target of this Cup and Handle formation is the 500 billion level. Currently Bitcoin is at 387 billion.
Conclusions:
This may sound bearish for altcoins. However, I would like to point out a few issues.
A. it is not guaranteed the BTCDOM will reach the 500 billion level.
B. Even if it will, it took us 10 weeks to get to the halfway point, so we have 2 or three months of an extreme BTCDOM at the most.
C. Markets are forward looking. If I can analyze the chart and see what is coming, you can bet your last Satoshi that the VCs and whales see it as well. My guess is that they are accumulating big-time.
D. Ask yourself: Would I long an asset that already made a 250% gain? or would you look for an undervalued asset that still has a lot of upside?
E. BTCDOM is close to oversold on the weekly RSI. Does it have some room for more upside? Sure. However, BTCDOM is close to the top.
Please read my TOTAL 3 analysis for more context.
NFA.
What do you think? Please share in the comments.
Best Wishes.

BTC dominance chart June 2023Hi guys,
If indeed Elliot Waves theory works as good as I think then the target for BTC's dominance should be in between the blue lines designated area and come down to the marked levels.
RSI bear div on the W seems to support this scenario.
Happy hunting !

btc dominancealts coins will get a good chance to rally to the upside if this supply zone is respected

Hard landing coming?The acquisition of Bitcoin, other than stable currencies, fell in wave A in five strong waves, and then rose in three waves to retest the summit. It is possible that wave C will be completed, and there will be five waves of decline in the shaded area.. Let us see what will happen
Note: The analysis fails if it closes higher than the area 1712

Breakout! Altseason is COMING!We just broke under last buyers volume.
The cryptocurrency market is known for its volatility, and it is not uncommon to see rapid fluctuations in prices that can make or break investors' portfolios. One phenomenon that is often observed in the cryptocurrency market is an "altseason." An altseason is a period when the prices of alternative cryptocurrencies, or "altcoins," rise significantly in comparison to Bitcoin, the world's largest cryptocurrency by market capitalization.
Altcoins are any cryptocurrencies other than Bitcoin, and there are thousands of altcoins in circulation. Some of the most well-known altcoins include Ethereum, Ripple, Litecoin, and Dogecoin. These cryptocurrencies have their own unique features and use cases, and many investors believe that they have significant potential for growth.
The conditions that lead to an altseason are complex and multifaceted. However, there are several factors that are typically associated with an altseason:
Bitcoin dominance drops: Bitcoin dominance refers to the percentage of the total cryptocurrency market capitalization that is accounted for by Bitcoin. During an altseason, Bitcoin dominance typically drops as investors shift their attention and funds to alternative cryptocurrencies.
Rising demand for altcoins: During an altseason, there is typically an increase in demand for altcoins. This can be due to a variety of factors, such as new use cases, innovative technology, or positive media coverage.
Bullish sentiment: During an altseason, there is typically a bullish sentiment in the market, as investors are optimistic about the potential of altcoins to outperform Bitcoin.
Positive news and developments: Positive news and developments, such as new partnerships, upgrades to existing technology, or regulatory developments that are favorable to cryptocurrencies, can also contribute to an altseason.
Bitcoin's stability: While an altseason is characterized by a drop in Bitcoin dominance, it is also important for Bitcoin to remain relatively stable during this period. If Bitcoin experiences significant price fluctuations, it can disrupt the altcoin market and lead to a decrease in demand for altcoins.
An altseason can be an exciting time for cryptocurrency investors, as it offers the potential for significant profits. However, it is important to keep in mind that altcoins are often more volatile than Bitcoin, and investing in them can be risky. It is crucial to conduct thorough research and due diligence before investing in any cryptocurrency, and to manage risk effectively to protect one's investment.
----
A breakout is a term used to describe a sudden and significant price movement in the financial markets. Breakouts occur when the price of an asset, such as a stock, commodity, or currency, moves beyond a key level of resistance or support, typically on high volume. These key levels are often referred to as technical levels, and they can include trendlines, moving averages, or previous highs or lows.
One strategy that traders often use to take advantage of breakouts is called "buying the dip" or "selling the spike." This strategy involves waiting for a breakout to occur, and then entering a position on a pullback or retracement. For example, if a stock breaks out to the upside and then pulls back to retest the breakout level, a trader might enter a long position on the pullback, with a stop loss below the breakout level.
Another strategy that traders use to take advantage of breakouts is called "momentum trading." This strategy involves entering a position as soon as the breakout occurs, with the expectation that the price will continue to move in the direction of the breakout. This strategy can be risky, as the price can sometimes reverse course quickly after a breakout, resulting in losses for the trader.
Overall, breakouts can be exciting and profitable opportunities for traders, but they require a high degree of skill and discipline to navigate successfully. Traders who are able to identify breakouts early on and manage their risk effectively can potentially achieve significant profits in the financial markets.

BTCDOMUSDTNobody Knows Where is Price Going.
Hey traders, here is the analysi.
If you guys like my analysis please hit like👍 and follow.
Thanks.
DISCLAIMER- This is not financial advice.
SMART MONEY CONCEPT.
identify Liquidity Or Become Liquidity

BTC Dominance touch resistanceBTC Dominance
If price can breakout the resistance than it will be higher.
But stay aware from fake breakout.

Say hi to alt'sbtc dominance is forming a double top, a fall from its resistance can give kaboom to its fellow alt coin's, all eyes on link and sol to name a few.

BTCDOMUSDTHey traders, here is the analysi. If you guys like my analysis please hit like👍 and follow. Thanks. DISCLAIMER- This is not financial advice. SMART MONEY CONCEPT

ALTCOINS IN BTC OUT, Shorting DominanceI believe the rally will continue with altcoins therefore causing BTC to lose its power in short-term.
Invest at your own risk.

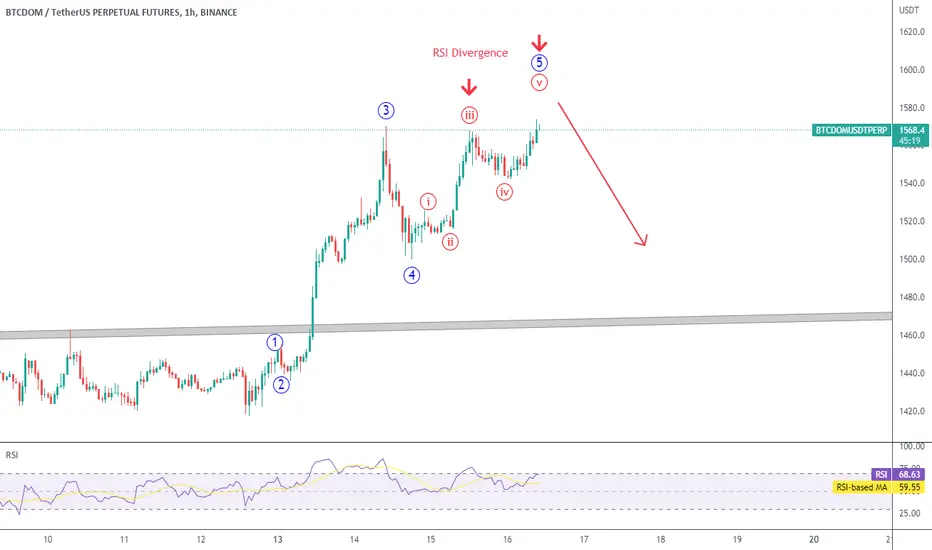
BTC.D - Short term pullback expected
In the 1H chart, BTC Dominance is finishing a 5 wave sequence and showing bearish RSI divergence. I expect a pullback to blue wave 4 level, which is the closest support.
This would favor alts against Bitcoin.
BTCDOMUSDTHey traders, here is the analysi.
If you guys like my analysis please hit like👍 and follow.
Thanks.
DISCLAIMER- This is not financial advice.
SMART MONEY CONCEPT

$BTCDOM/USDT 2D (#BinanceFutures) Big falling wedge breakoutBitcoin Dominance Index seems about to reverse, ahead of the Ethereum Merge it's an opportunity to hedge against big Altcoins.
⚡️⚡️ #BTCDOM/USDT ⚡️⚡️
Exchanges: Binance Futures
Signal Type: Regular (Long)
Leverage: Isolated (2X)
Amount: 11.8%
Current Price:
1197.3
Entry Zone:
1192.8 - 1144.0
Take-Profit Targets:
1) 1168.4
2) 1380.2
3) 1469.0
Stop Targets:
1) 1069.7
Published By: @Zblaba
Risk/Reward= 1:1.25 | 1:2.15 | 1:3.05
Expected Profit= +21.08% | +36.26% | +51.46%
Possible Loss= -16.90%
Fib. Retracement= 0.382 | 0.559 | 0.702
Margin Leverage= 2x
Estimated Gain-time= 3-4 months
Tags: #BTCDOMUSDT #BTCD #BitcoinDominance #Index #Futures #Derivatives #Dominance
Component Info:
www.binance.com

BTCDOM | BULLISH CHANNEL BROKENBTCDOM has been trading in a bullish parallel channel .
Now the price has broken the channel downward side after being rejected by resistance.
Binance BTCDOM Index is a cryptocurrency price index reflecting the market dominance performance of Bitcoin . The BTCDOM Index is a metric that traders can use to quickly get a sense of Bitcoin's value relative to that of the broader cryptocurrency market.
The BTCDOM Index provides insights into the market and can be used as a tool to speculate on Bitcoin’s relative strength against altcoins. Essentially, the index measures the demand for Bitcoin relative to altcoins.
In short, When altcoins gain market share relative to Bitcoin , the BTCDOM index loses value. Conversely, when Bitcoin gains market share relative to altcoins, the BTCDOM index will gain value.
Manage your trades accordingly.

BTCDOMUSDT SHORT ENTRYHere we can see that "BTCDOMUSDT" in 1 day time frame has a trendline resistance at "1432" and a support zone at "1341". If the price takes rejection from the resistance zone we can look for a good SHORT TRADE here. Entry zone at "1432" with a Tight Stoploss at 1455" ans a Target of "1340".
ENJOY!!!!!
