SELL BTC 13.7.2025 (scalping M15)Counter-trend trade order: SELL at THE TOP
Type of entry: Limit order
Condition:
- If the price break down at 122,041 confirming the down trend.
Note:
- Management of money carefully at the price of bottom (122,041)
Set up entry:
- Entry sell at 122,821
- SL at 123,334
- TP1: 123,041
- TP2: 121,389
Trading Method: Price action (No indicator, only trend and candles)
BTCDOWNUSDT trade ideas

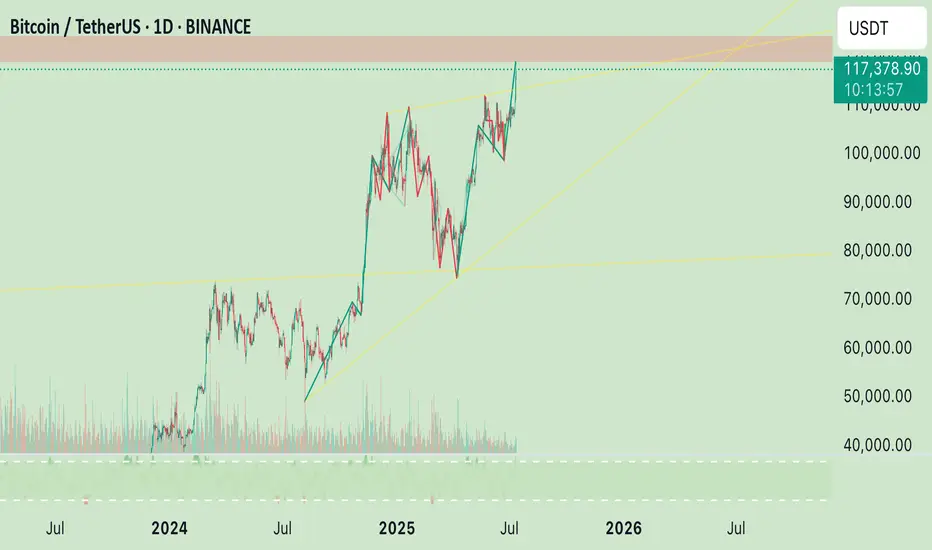
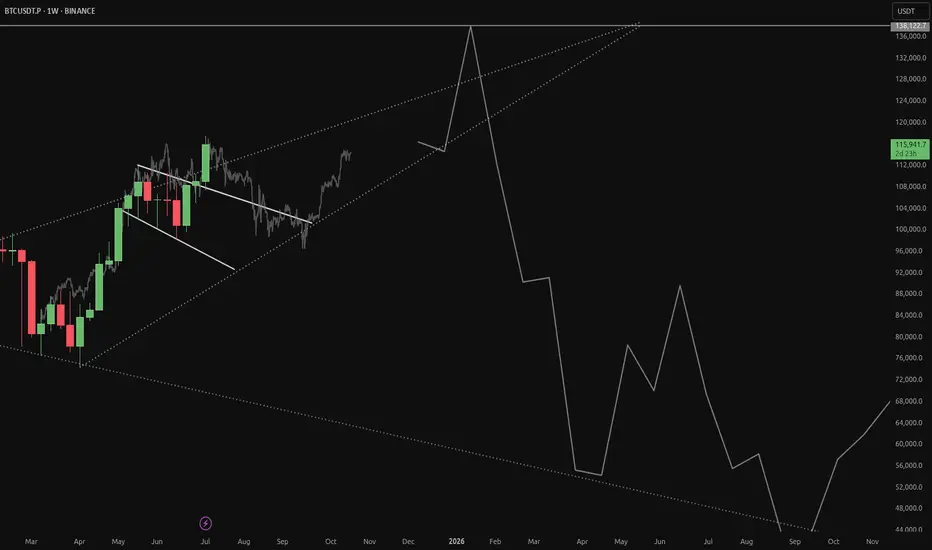
Historical Top?It wasn't triangle. Just one of the bull trap.
But how about this ath?
I think this is trap, too.
2021 April~December movement.
Do you remember at that time?
If you do, you won't open a short postion.
Finale makes incredible Alt BullRun, always.
This month is the most important for checking annual trend.


BTCUSDT idea within the next 24 hoursas explained in the video, im taking the trades as projected in my video...
i will share any update if anything changes

btc 120k then 115in im opinion btc will go up 120k max then fall to 115k , bcs there are a lot of sl's :D

BTC — Harmonic Parabolic Scenario 1. Rise to 110–111k by July 4–5
2. Drop into July 9–10
3. Parabolic move after July 10
4. TP: ATH+
5. Stop: scenario invalid if no breakout

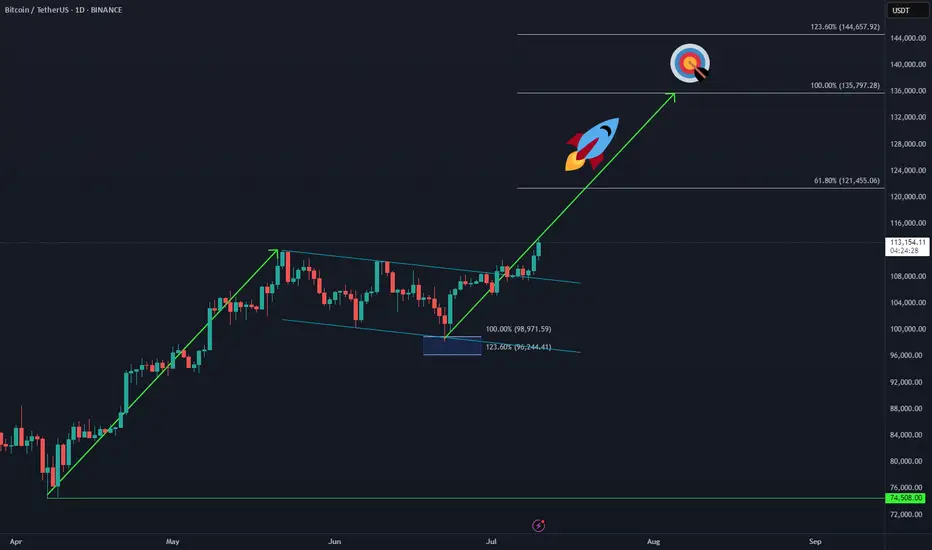
Bitcoin Makes New ATH – Next Sequence in Play 🚀 CRYPTO:BTCUSD has officially broken into new all-time highs, confirming the next bullish sequence is underway.
The upside projection now opens toward the $135K–$144K zone, aligning with long-term Fibonacci extensions and cycle projections.
📌 As always, it won’t be a straight line—expect step-by-step progress, with consolidations and pullbacks along the way. But the structure remains bullish, and the path is unfolding.
BTC — Chop → Range Low Sweep → Range High1. Watch for push to range mids (119.4–121.3)
2. Anticipate move back to range low (115,750) — buy zone
3. Target range high (125,000) after sweep
If no sweep to RL — scenario invalid

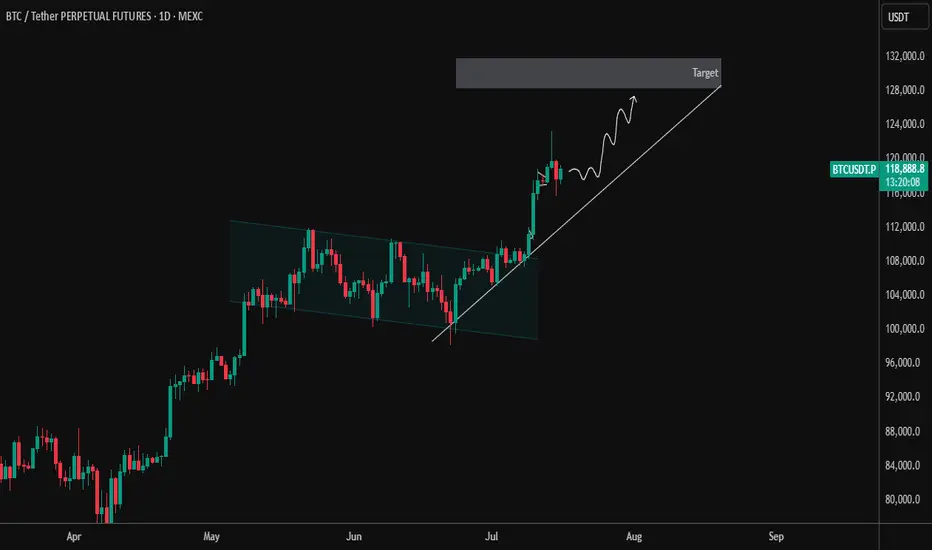
BTCUSDT 1 Day – Breakout and Retest Completed | Next TargetBTC has officially broken out of the descending parallel channel that dominated price action from mid-May to early July. After a successful breakout, price pulled back for a clean retest of the channel resistance, which has now flipped to support — a classic bullish continuation signal.
🔹 Key Technical Highlights:
✅ Breakout from descending channel structure
✅ Retest of breakout zone confirmed with strong bullish candles
🔼 Current Price: ~$118,971 (as of chart time)
📈 Short-Term Structure: Following a clean higher-low formation with ascending trendline support
🎯 Target Zone: $128,000–$130,000 (next key resistance area)
As long as BTC maintains this ascending support line, the momentum remains with the bulls. Any dips toward the trendline may offer good long opportunities with proper risk management.
📌 Watch for:
Rejection near the target zone
Bullish continuation patterns like flag/pennant on lower timeframes
Volume confirmation during breakout attempts
Let the trend be your friend. Trade safe! ⚡

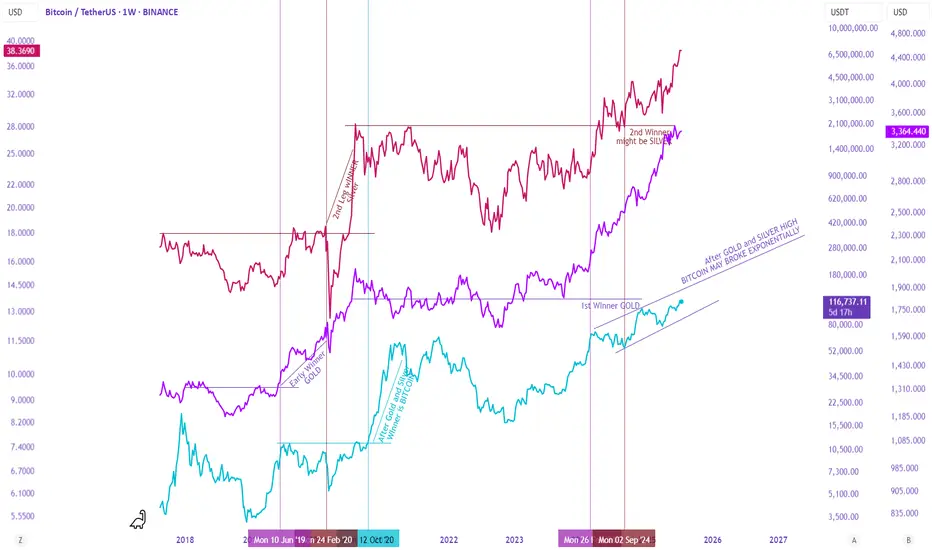
Gold, Silver, and Bitcoin – A Staggered Anti-Currency Rotation?There seems to be a complex yet recurring relationship between Gold, Silver, and Bitcoin during anti-currency phases (when fiat weakens).
First Leg – Gold Leads
Gold typically leads the first leg, breaking out to new highs. Silver follows but lags—trending up without breaking major resistance. During this phase, the Gold/Silver ratio expands.
Second Leg – Silver Takes Over
Eventually, Silver breaks resistance and becomes the second leg leader. As it outperforms Gold, the Gold/Silver ratio contracts back to mean.
Bitcoin, during this time, is usually bottoming or entering Stage 2 (early uptrend). This time, it has already broken resistance but is rising slower than in past cycles.
Third Leg – Bitcoin Dominates
As Gold and Silver peak and begin to correct, Bitcoin accelerates, often making new all-time highs (ATH).
This staggered rotation played out during the 2018–2022 cycle. Let's see if history rhymes in this cycle.
BTCUSDTmy entry on this trade idea is taken from a point of interest below an inducement (X).. I extended my stoploss area to cover for the whole swing as price can target the liquidity there before going as I anticipate.. just a trade idea, not financial advise
Entry; $113312.6
Take Profit; $117985.3
Stop Loss; $112314.0

BitcoinBitcoin/TetherUS (BTC/USDT) Trading Analysis - Jul 15, 2025
Key Observations:
Price Movement:
Current Price: $117,692.46
24h Change: -2,148.72 (-1.79%)
Range: Low of $116,250.00 to High of $119,940.83
The price is currently near the lower end of the day's range, indicating bearish pressure.
Support and Resistance:
Support Levels:
Strong Support: $112,000.00 (marked as S/L)
Intermediate Support: $113,500.00 and $110,000.00
Resistance Levels:
Immediate Resistance: $119,900.00
Higher Resistance: $120,000.00 and $122,500.00
Profit Levels:
The "Profit" section lists potential take-profit targets, with the highest at $135,000.00.
The price has recently dipped below the $120,000.00 psychological level, suggesting weakening bullish momentum.
Trend Context:
The chart spans from June to September, but the current price action (July) shows consolidation after a potential pullback from higher levels.
The presence of multiple support levels ($112K–$116K) suggests a critical zone for buyers to defend.
Actionable Insights:
Bearish Short-Term: The price is below key levels ($119,900–$120,000) and has broken below $118,250.00. A retest of support at $112,000.00 is plausible.
Bullish Reversal Signal: If BTC holds above $112,000.00 and reclaims $120,000.00, it could target $122,500.00 or higher.
Risk Management: A break below $112,000.00 (S/L) may trigger further downside toward $110,000.00 or lower.
Conclusion:
The market is currently in a corrective phase. Traders should monitor the $112,000.00 support for potential reversals or breakdowns. A close above $120,000.00 would shift bias to bullish.

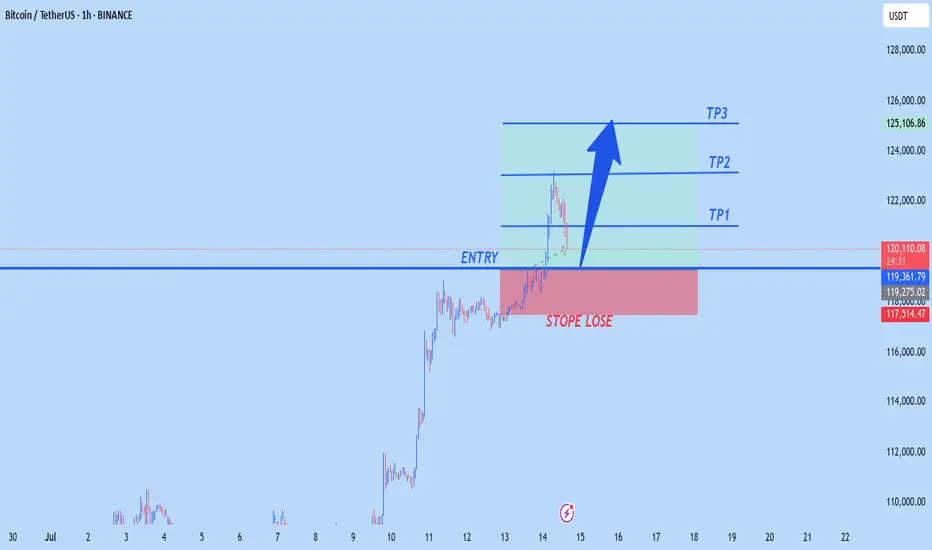
BTCUSD NEW OUTLOOKBtc buy from 119,000
TP1 122,000
Tp2 123,000
Tp3 125,000
STOPE LOSE 117,500
Trade at your own risk
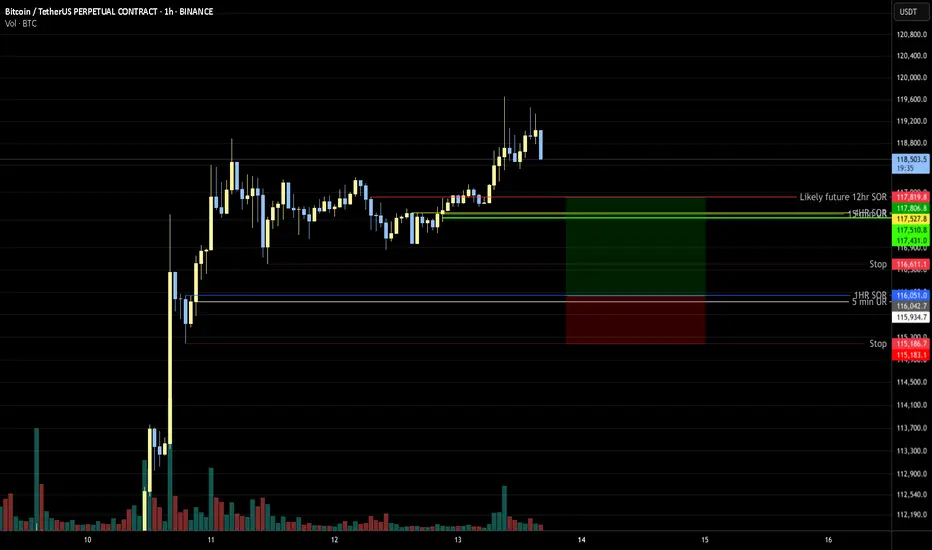
2 RRBitcoin has risen significantly, if it retraces some it will likely stop at the indicated range. Target will need to be selected after the entry based on the development of the chart.
BTCUSDT – Market Update & RecommendationBTCUSDT – Market Update & Recommendation
In my previous analysis published on June 1, 2025 (TradingView), I mentioned the corrective pullback towards the $100k area before BTC resumed its next upward wave.
My latest evaluation (posted recently on my personal blog, linked in my TradingView signature) stated clearly that BTC would rise toward $110k, then experience a minor retracement to around $108.2k before consolidating and reaching new ATH between $118k–$125k.
At present, BTC has successfully touched the $118k mark and is undergoing a minor correction—this is a critical consolidation phase before price approaches the significant $125k distribution zone.
Recommendation:
Investors holding BTC purchased below $108k should closely monitor price action to secure profits as necessary.
Consider signals for potential Swing Short positions based on monthly (M) timeframe bottoms. This is a powerful and extended signal, potentially lasting until the end of 2025.
Caution is advised for any new BTCUSDT positions at this time.
Link:

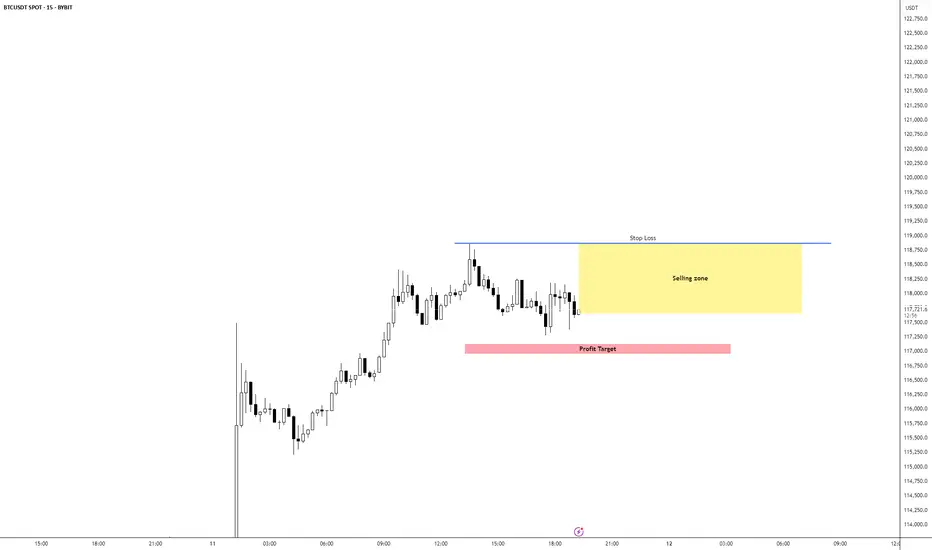
BTC/USD Short IdeaBTC/USD is currently bullish overall but seems overextended, Expecting a pullback to the 5m Equilibrium levels which would be our TP area. 1M has switched bearish adding confluence to our setup.
I would be layering short positions inside the yellow selling zone
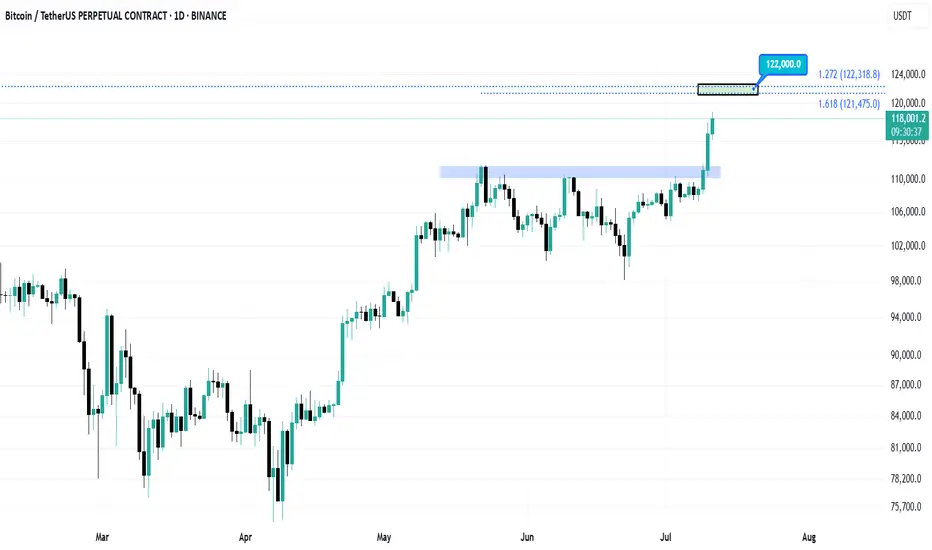
BitcoinThe next target for Bitcoin is $122,000.
I will update the chart when this target is reached.
Follow so you don't miss the next analysis.
BTCUSDTBitcoin came and made its move according to the FVG, which was in the $98,000 to $99,000 range, but considering the war that took place between Iran, the United States, and Israel and that affected the markets, I expected it to reach the $91,000 or even $85,000 area and then make a move, but considering the previous analysis and consolidation in the $109,000 area and the breakout of $110,000, it started its move and is expected to go up to $120,000 in the short term and up to $144,000 in the medium term.

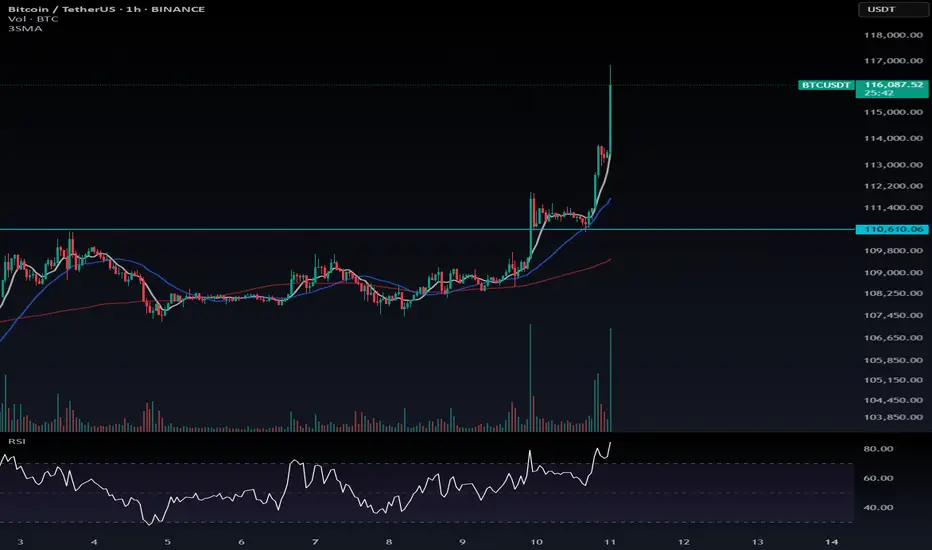
Hope you entered that long position!🚀 Hope you entered that long position!
I really tried to help you catch this move — and now it looks like Bitcoin has hit its first target.
If you want, you can take some profit here. But my suggestion? Hold that position with the mindset that some short-term profit might be missed, but the overall trend still looks strong.
📉 There’s a possibility of a minor pullback down to 110,610, even as a quick shadow — and then the upward move could continue.
📌 If you're holding altcoin positions, take profit on them. BTC dominance hasn’t dropped sharply yet, so alts are more likely to see pullbacks. Bitcoin still has more room to run in my view.
💬 Did you catch the trade?
🟢 In profit or waiting for higher targets?
Drop a comment 👇 Let's see how everyone's doing!
Bitcoin Breaks All-Time High: What’s Next?Bitcoin (BTC) has once again captured the world’s attention by smashing through its previous all-time high (ATH). This milestone has sparked excitement and speculation across the crypto community and beyond. But the key question remains: Will BTC continue its upward trajectory, or is a correction on the horizon?
Long-Term Outlook: The Bullish Case
In the long run, the fundamentals for Bitcoin remain strong. Several factors support a positive outlook:
Institutional Adoption: More institutional investors are entering the market, providing greater liquidity and legitimacy.
Scarcity and Halving Cycles: Bitcoin’s fixed supply and periodic halving events historically drive long-term price appreciation.
Macro Trends: Ongoing concerns about inflation and fiat currency devaluation continue to make BTC an attractive hedge.
Given these dynamics, we believe Bitcoin’s long-term trajectory remains upward.
Short-Term Caution: A Correction May Be Coming
While the long-term view is optimistic, the short-term picture may be less rosy:
Overheated Market Indicators: Rapid price surges often lead to overbought conditions, increasing the likelihood of a pullback.
Profit-Taking: After breaking ATH, some investors may lock in gains, adding selling pressure.
Technical Resistance: Historical patterns suggest that corrections often follow major breakouts.
We anticipate a potential correction, possibly pulling BTC back to the $90,000 range. This adjustment could unfold in the coming week or weeks as the market digests recent gains.
What Should Investors Do?
Stay Calm: Volatility is part of the crypto landscape. Corrections are healthy for sustainable growth.
Focus on Fundamentals: Remember why you invested in BTC in the first place.
Consider Dollar-Cost Averaging: Spreading out purchases can help mitigate the impact of short-term swings.
Conclusion
Bitcoin’s break above its all-time high is a testament to its enduring appeal and the growing confidence of investors. While a short-term correction may be likely, the long-term case for BTC remains compelling. As always, prudent risk management and a focus on fundamentals are key to navigating the exciting—and sometimes turbulent—world of crypto.
Do not consider it as investment advice.
#crypto #bitcoin #analysis
