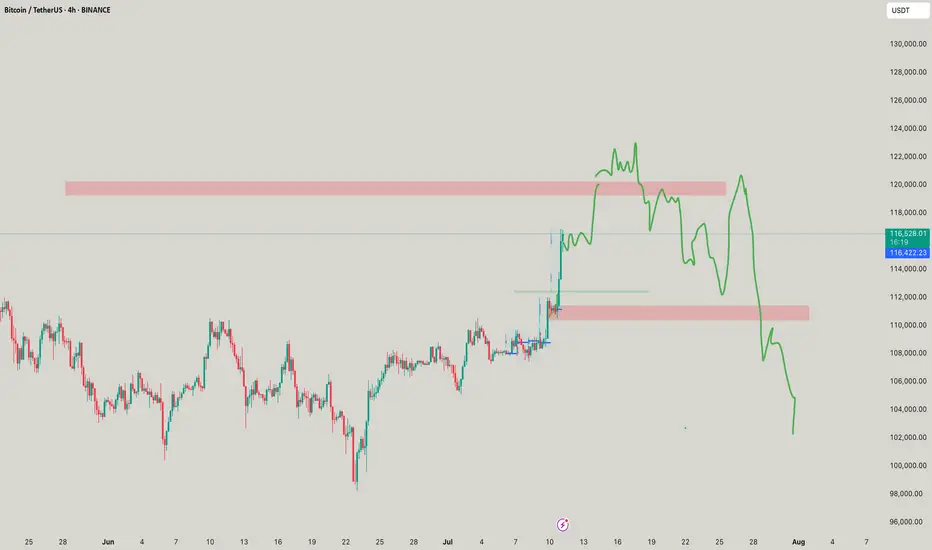
BTC sideways above 115k💎 BTC PLAN UPDATE (July 17)
NOTABLE NEWS ABOUT BTC
Bitcoin Price Forecast: BTC Recovers as Trump Steps In to Revive Crypto Legislation Momentum
Bitcoin (BTC) saw a mild recovery, trading around $119,000 at the time of writing on Wednesday, after falling nearly 2% the previous day. This rebound followed an announcement by U.S. President Donald Trump on Wednesday morning, stating that the GENIUS Act is ready to be passed by the House during the legislative “Crypto Week”, sparking optimism in the crypto market. Furthermore, institutional demand continues to grow, with spot Bitcoin ETFs recording over $400 million in inflows on Tuesday, extending the growth streak since July 2.
TECHNICAL ANALYSIS
🧠 Pattern Overview:
The chart clearly displays an Elliott Wave pattern (1) → (2) → (3) → (4) → (5) along with Fibonacci Retracement and Extension levels, helping to identify potential support and resistance zones.
1. Elliott Waves:
Wave (3) was completed around the $122,144 zone and the market is currently in the corrective wave (4).
Wave (5) is expected to move upward with targets at:
• 1.618 Fibonacci Extension: ~$127,404
• Or further: ~$130,747
2. Support Zone (grey area below):
Located around $115,000 – $116,000, which is:
• The 0.5 – 0.618 retracement of Wave (3)
• Aligned with the EMA200 and dotted black trendline support.
If the price falls into this area, it’s highly likely to bounce back and form Wave (5).
3. Danger Zone if Broken:
If this support fails, price may fall deeper to:
• $113,200 (0.786 retracement),
• Or even lower: $111,600 – $111,800
4. Potential Scenarios:
Two main outcomes:
• Continued Uptrend: Price bounces from the support zone and heads toward $127,000 – $130,000
• Breakdown: If the support breaks, a deeper decline may occur, breaking the wave structure.
Follow the channel for continuous and up-to-date analysis on XAUUSD, CURRENCIES, and BTC.
BTCDOWNUSDT trade ideas

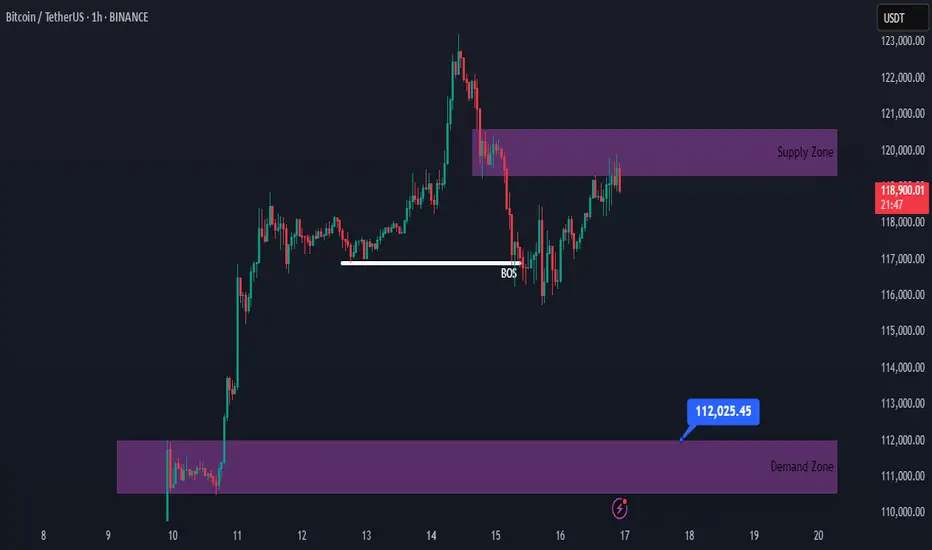
Bitcoin Bullish, but a Correction Might Be AheadHello traders!
Obviously, Bitcoin has a strong bullish momentum.
However, after noticing a minor shift in market structure, we may see a correction toward the 112,000 area.
If the supply area doesn’t break, we can look for a sell position here.
#BTC #Bitcoin
BtcUSDTafter btc create new all time high, to tell us that the uptrend continue, i will like to see a temporary pull back to around 110k to join the bull run again. trading a pull back can be risk.
but no risk no win. trade what you see

Bitcoin Full analysis: Buy the dip confirmed, 123240 key__________________________________________________________________________________
Technical Overview – Summary Points
__________________________________________________________________________________
Momentum: Very bullish across all timeframes; healthy compression above previous range.
Key Supports: 115731–110481 USDT (structural, 1D to 1H).
Major Resistances: 123240 USDT (multi-frame pivot).
Volume: Normal, no climax or distribution — flows support the dominant bias.
Risk On / Risk Off Indicator: Strong bullish HLTF signal; short-term neutral intraday.
ISPD DIV: Neutral on all timeframes.
Multi-TF Behavior: Bull rally, no excess, no euphoria or capitulation; market holds above key levels.
__________________________________________________________________________________
Strategic Summary
__________________________________________________________________________________
Global Bias: Strong bullish – MT/LT “buy on dips” confirmed.
Opportunities: Progressive buying (117800, 115731 USDT), continuation on breakout >123240.
Risk Zones: Possible pullback if clear rejection below 123240, swing invalidation if close <115731-111949.
Macro Catalysts: Awaiting FOMC late July, short-term volatility limited. Watch geopolitics, extreme compression.
Action Plan: Swing entry: 118300–119000. Stop: 115500. Target: 123200 then 126000+. R/R ≥2.5. Adjust risk management before FOMC.
__________________________________________________________________________________
Multi-Timeframe Analysis
__________________________________________________________________________________
1D: Bullish momentum, supports at 105054/107939–110483. Risk On / Risk Off Indicator strong buy, healthy volume, ISPD neutral.
12H: Consolidation below 123240, aligned supports 110481/115731, healthy structure.
6H: Confirmed momentum, continuous compression, no major sell signals.
4H: Rally structure robust, corrections limited and on support.
2H: Key support band 115731–110481, volume supports rebound, possible rotation below 123240.
1H: Rally confirmed, no panic selling detected.
30min/15min: Intraday consolidation, micro-range below resistance, stable volume, Risk On / Risk Off Indicator short-term neutral.
Cross-TF summary: CLEAR momentum across all frames, no significant divergence, high-quality HTF supports. Next >123240 breakout likely fast and dynamic.
__________________________________________________________________________________
Technical & Fundamental Synthesis
__________________________________________________________________________________
Technical Synthesis: Broad bullish confirmation; buy-the-dip valid on 117800/115731, no aggressive downside signal. Swing positions above 118200 to be favored, expect acceleration after clear break of 123240.
Stops & Invalidation: Swing stops below 115731/111949. Closing below = increased risk, “off” bias.
Fundamentals: Optimal pre-FOMC swing window, US market in wait-and-see mode short term. Neutral/volatile geopolitics, no immediate shocks.
On-chain: Heavy accumulation, historic compression, ETF flows strong (but on short pause). Imminent volatility squeeze possible either way.
Recommendation: Actively monitor 123240 (breakout above), 115731 (below = increased caution). Adjust stops and sizing, remain highly responsive, especially as FOMC approaches.
__________________________________________________________________________________

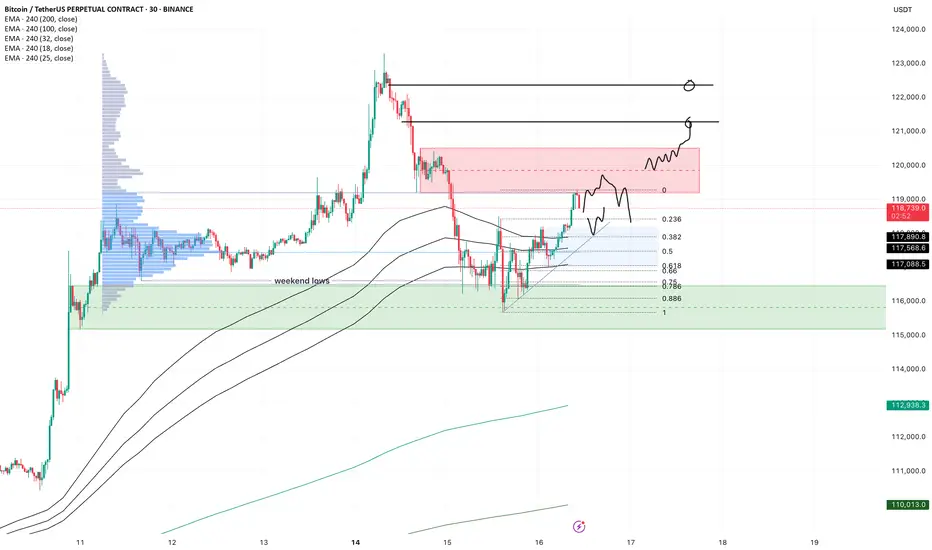
BTC - intradayA lot of volatility, which is nice for trading either way.
The high we set on Monday morning gave a very strong rejection, but in the end we simply took out the weekend lows, then reclaimed and are now grinding higher into the imbalance we left.
Price is now coming into the first resistance, so we watch for either a reversal or see if price keeps grinding through this orderblock, in which case we expect the higher imbalance also to get taken out.
If that happens, I expect a lower high which creates bad highs, then into some ranging price action before we sweep the highs again. (a range trader can dream, rigth?)
For today, look for pullbacks into the blue zone. If the slow grind trend is strong, somewhere between the 0.618 and 0.382 is where I'd expect a reaction if we flush a bit at nyo. We have confluence with H4 trend, trendline, fibs and range poc here.
For now all the m1 lows are holding on low timeframe, I wouldn't get overly bearish or even looking for hedges before that breaks.
If price rejects here and loses the poc, look for a sweep of the lows first. There is a lot of OI build up and I expect some longs to be flushed, but that's no excuse to get bearish at the lows before they break. Just like yesterday, price reclaimed the low immediately, that was your moment to long.
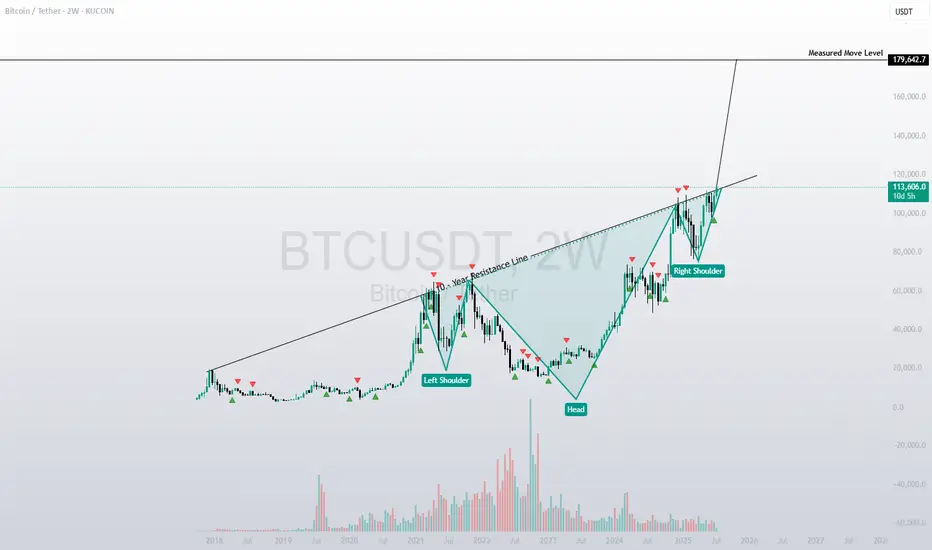
Bitcoin Analysis – 2W Timeframe
📌 As long as price holds above $113K, the trend remains bullish.
🎯 Next targets:
• T1: $151,635
• T2: $175,596
🔍 Any pullback toward $113K is a buying opportunity in a strong uptrend.

Bitcoin Rush: The Carnival and Concerns Behind $120,000Bitcoin Rush: The Carnival and Concerns Behind $120,000
The Bitcoin market is staging an epic rally - the price has broken through the $120,000 mark, setting a new record high. But behind this jubilation, the market has shown signs of overheating.
Market Status: Risks Hidden in the Frenzy
Price Performance: Hit a new high of $123,000 on July 15, up nearly 20% this year, with a total market value of $2.2 trillion (the fifth largest asset in the world)
Market Sentiment: Fear and Greed Index 72 (extreme greed), but more than 100,000 people were liquidated in 24 hours, with a loss of $510 million
Technical Signals: RSI reached 70.9 (overbought zone), and the 30-day unrealized profit and loss ratio reached the 80% percentile
Three major rising engines
Institutional entry
Spot Bitcoin ETF net inflow of $118 million in a single day (BlackRock holds more than 700,000 coins)
MicroStra Tegy's holdings value exceeds $50 billion
Trump Media Group and other listed companies join the "coin hoarding trend"
Regulatory support
The U.S. "Cryptocurrency Week" deliberates on three key bills
Hong Kong passes the "Stablecoin Ordinance" (effective on August 1)
The EU MiCA framework begins to be implemented
Macro support
The probability of the Fed's September rate cut is 72.3%
The weakening of the U.S. dollar + trade protection policies boost risk aversion demand
Bitcoin's positioning shifts from "speculative assets" to "digital gold"
Key technical signals
Breakthrough pattern: daily "three white soldiers" candle + ascending triangle breakthrough, target 128,000-132,000 U.S. dollars Yuan
Key position:
Support: $116,800 (near term), $112,000 (key)
Resistance: $121,500 (short term), $140,000 (long term)
Risk signal: H4 chart RSI reaches 77, MACD histogram shrinks
Future outlook
Short term: If the $112,000 support is maintained, it is expected to challenge $140,000
Risk: Falling below $108,500 may trigger a chain of liquidations
Cycle law: Referring to "peaking 550 days after halving", this round of bull market may peak in October
Breakout trading strategy (suitable for aggressive traders )
Entry conditions:
Price stabilizes above $123,000 with increased trading volume (at least 1.5 times the 20-day average volume)
4-hour chart closes above the previous high for three consecutive positive lines
Targets:
First target $128,000 (1.618 Fibonacci extension level)
Second target $135,000 (psychological barrier + upper channel track)
Stop loss setting:
Day trading: Falling below the $120,000 round mark
Swing trading: Falling below the $116,800 support platform
Conclusion: Bitcoin is writing a new chapter in history, but investors need to be wary of "extreme joy leads to sorrow". Remember: when others are fearful, I am greedy, and when others are greedy, I am fearful - this old saying always applies to the crypto market.

#BTC Update #6 – July 11, 2025🟠 #BTC Update #6 – July 11, 2025
Bitcoin has surged nearly 9% from the supply zone and is currently trading around the $119,000 level. However, looking at the current volume, the momentum seems to be fading.
If a correction takes place, the potential support zones are:
✨First stop: $114,000
✨Second stop: $113,000
✨Third stop: $111,500
After a pullback, the next target may be around $122,000. However, macroeconomic risks are rising. The U.S. is considering a 500% tariff on Russia imports, and in the past, even a 100% tariff triggered a sharp drop in Bitcoin.
Since BTC has already made a significant move up, I don’t think opening a Long or Short position is wise at the moment. Just observing for now.

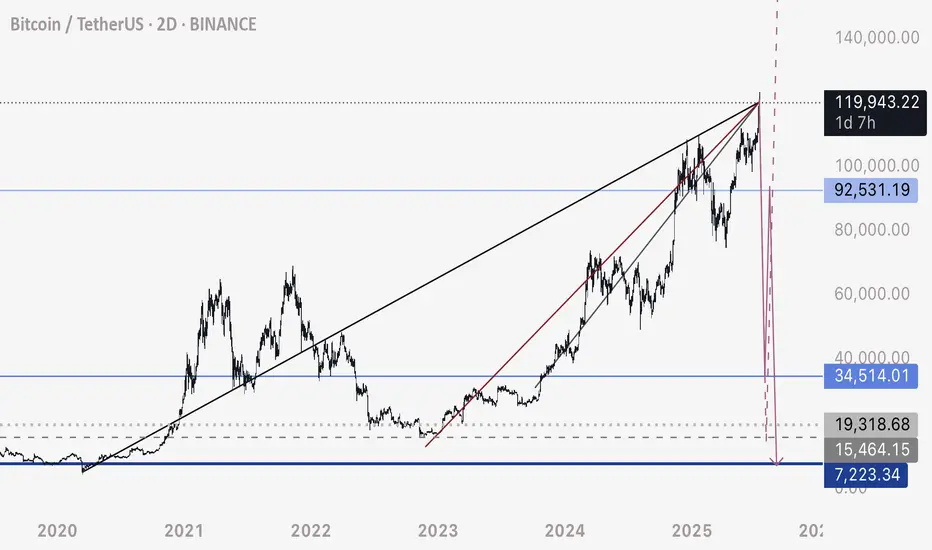
BTCUSD – Is This the Macro Top? Sell?This analysis is based on a convergence of classic technical signals, structural wave counts, and institutional order flow. Together, they strongly suggest that we may be witnessing a macro distribution phase, possibly leading into a larger correction.
1. Elliott Wave Count (Supercycle and Cycle Degree)
-Clear channel from 2018–2025 defining the entire impulsive structure.
-Final wave V is subdivided into five minor waves, with the fifth showing characteristics of an ending diagonal (low momentum, overlapping waves).
-Sructure is consistent with terminal wave exhaustion, including a false breakout and multiple rejections.
2. Volume Profile and Institutional Flow
-High-volume nodes at the top (Coinbase/Binance) align with historical distribution zones, not accumulation.
-Likely OTC activity as smart money exits quietly near all-time highs.
-VPVR shows major support clusters far below current levels (100k–88k), highlighting inefficient price zones above.
3. Weekly Technical Indicators
-RSI (classic and McAfee-based): long-term bearish divergence vs price.
-Stochastic RSI: extended overbought conditions; full cycles often reverse from this zone.
-MFI (Money Flow Index): >80 — historically precedes top formation in BTC.
-MACD: approaching a potential bearish cross in the coming weeks.
-WaveTrend Oscillator: peaking — behavior matches major tops in 2021 and 2017.
4. Moving Averages & Structural Support
-EMA21 (Weekly): ~96k — likely target for wave A of a corrective phase.
-EMA50: ~87k — coincides with cluster of historical buying interest.
-EMA100/200: ~68k and ~50k — long-term value zones if correction deepens.
5. Pivot Levels & Price Structure
-Price reached R1 (112,400) and is showing rejection — classic pivot reversal behavior.
-S1/S2 (~100–92k): probable short-term correction zones.
-S3/S4 (<88k): targets for deeper wave C or end of macro correction.
6. Institutional Behavior & Sentiment
-Large buying volume at the highs does not represent breakout momentum — likely retail absorption of institutional selling.
-Momentum divergence and false breakout behavior reinforce the distribution thesis.
-Sentiment: overly bullish news and euphoria align with classic retail top behavior.
Conclusion
This confluence of Elliott Wave structure, volume profile, indicator exhaustion, and institutional flow activity points to a high-probability macro top in Bitcoin. While no analysis is infallible, the alignment of so many signals is rare and demands attention.
Disclaimer:
This is not a recommendation to sell. This is a technical analysis intended purely for educational and analytical purposes.

Bitcoin breaks through $120,000Bitcoin breaks through $120,000: long opportunities under the resonance of fundamentals and technical aspects
I. Fundamentals: Multiple positive factors drive the bull market
Institutional funds continue to pour in
The net inflow of US spot Bitcoin ETFs reached US$2.7 billion in a single week (a single-week record in 2025), and BlackRock IBIT's management scale is close to US$100 billion410.
Listed companies (such as MicroStrategy) continue to increase their holdings, with a total holding of more than 850,000 BTC, worth nearly US$100 billion6.
Policy easing expectations strengthen
The US "Cryptocurrency Week" deliberates on three key bills (the "GENIUS Act" and the "Clarity Act", etc.). If passed, it will clarify the regulatory framework and eliminate market uncertainty210.
The Trump administration promotes crypto-friendly policies, including the "National Strategic Cryptocurrency Reserve" plan, to boost market confidence69.
Macroeconomic environment support
Expectations of Fed rate cuts are rising, funds are flowing into risky assets at an accelerated pace, and Bitcoin's safe-haven properties as "digital gold" are strengthened13.
2. Technical aspects: Breaking through key resistance, upward space opens
Key breakthrough confirmed
Bitcoin breaks through the $120,000 mark, completely gets rid of the $90,000-110,000 oscillation range, and forms a daily level "ascending triangle" breaking through 210.
RSI (daily) is in the healthy range of 60-70, no overbought signal appears, MACD golden cross continues, showing strong upward momentum 69.
Support and target
Short-term support: $118,000 (previous high conversion support), if it falls below, look at $112,000 (20-day moving average).
Upward target:
Short-term: $135,000-140,000 (Fibonacci extension level + institutional bullish consensus) 910.
Medium- to long-term: $200,000 (forecast by Standard Chartered Bank, Bitwise and other institutions) 48.
Derivatives signal
Short positions intensify the rise: $740 million of short orders were liquidated within 24 hours, forming a "short squeeze" positive feedback 26.
The options market is piled with bullish bets, and the open interest of $150,000 call options expiring in December has surged by 10.
Long-term ideas, entry strategies
Positions can be opened in batches at the current price (around $120,000), with a stop loss set at $115,000 (key psychological support).
If it stabilizes in the range of $118,000-115,000, you can increase your position.
Target and risk control
First target: $135,000 (technical resistance + institutional consensus).
Second target: $150,000 (trend continuation + policy catalysis).
Be wary of short-term fluctuations: If it falls below $115,000, the trend needs to be re-evaluated.
Configuration suggestions
Main position is Bitcoin, and auxiliary position is Ethereum (ETH breaks through $3,000, with great potential for catch-up) 10.
Avoid high leverage, and pay attention to the volatility that may be caused by the implementation of US regulatory details in August 18.
Conclusion: Bitcoin is driven by policy, capital, and technology, and the bull market pattern is clear. There may be short-term fluctuations, but the trend has not changed, and buying on dips remains the main strategy.
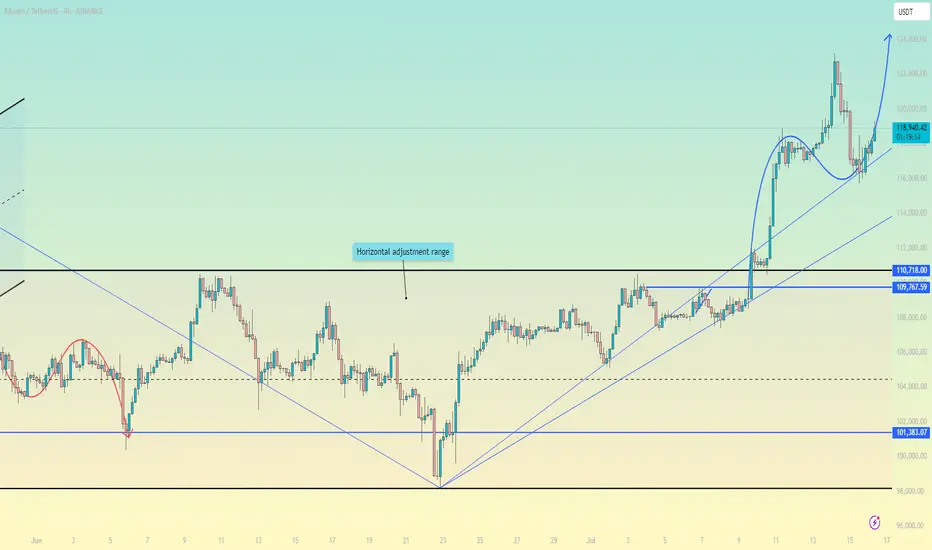
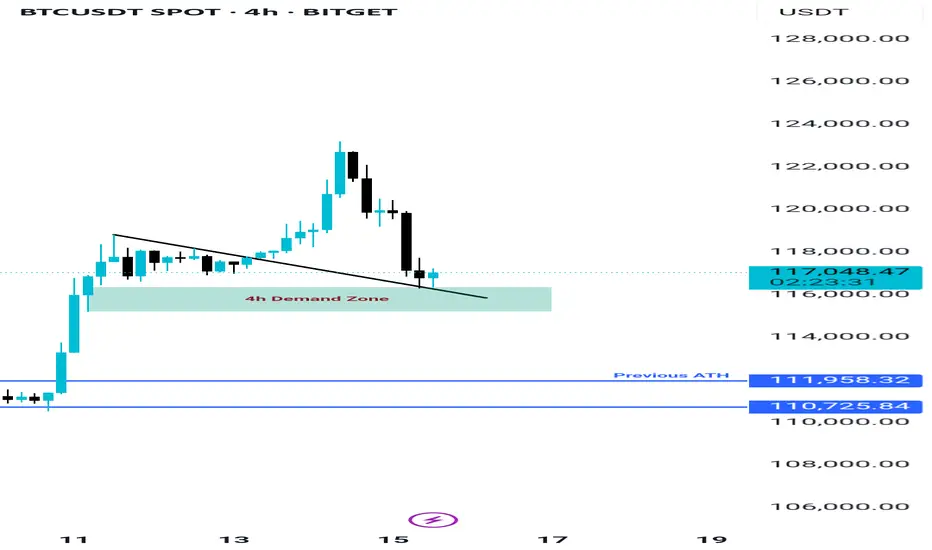
Bitcoin to 128kThere is a strong support between 113k to 115k for Bitcoin, as you see that is the 61% of the Fibonacci, and it is just the start for the rally.

BTC still Holding the Demand Zone, Bitcoin is currently holding the demand zone between $116K and $117K, which also aligns with the retest area of a previously broken trendline—making this zone quite strong. If BTC manages to close above $117.8K on lower timeframes, we could see the beginning of a new uptrend targeting around $130K. However, if this zone fails due to any unexpected news or events, the next key support lies between $111K and $113K.
What i see, still normalBTC has now found resistance at the mid trendline, once this flips support we look for massive uptrend

BTC - Last Attempt at Predicting TopThis is my last attempt at predicting the top of this upwards move on the HTF.
Adjusting these trendlines to where BTC pumped to, which was a lot higher than initially anticipated, it does look to me that these trendlines are still respected.
There are 3 bearish ascending lines that price has been interacting with - I assume we are looking at a crossing intersection of them, per the chart here.
If BTC continues higher without a very fast, drastic free fall - I will be looking at other possibilities. If price moves above 122,000 again, I would consider this invalid - as I suspect the resistance level sits around 120,000 to 120,500 area.
I will be looking for a very fast drop to consider this possibility as valid and likely from here on.
$BTC RISING WEDGE ~ {LONG TERM VIEW}I don't feel like writing, everything is clear. Bitcoin is bullish right now, but keep an eye on this pattern.

Weekly trading plan for BitcoinBINANCE:BTCUSDT has currently set a new ATH, trading in the 121k-122k range. While no clear reversal signals are present yet, we're seeing early signs of a 4h RSI divergence. Without solid confirmation, short positions remain risky - price could liquidate shorts multiple times before any meaningful reversal. Key local level to watch is 119k
Trade safe and stay adaptive

Bitcoin's Next Move: Planning the Counter-Trend ShortThis 30-minute BTC/USDT chart provides an excellent case study. After successfully identifying and trading the breakout from the consolidation range (highlighted in the brown box), the focus now shifts to a new, potential trade setup.
Asset: Bitcoin / TetherUS (BTC/USDT)
Timeframe: 30-Minute
Recap: The price has powerfully broken out of its previous range, a move that was anticipated and resulted in a successful long trade.
Current Situation: Following the strong, nearly vertical rally, the price is approaching the psychological $120,000 level. Runs like this are often followed by a period of profit-taking or a short-term pullback.
The New Trade Plan: A Bearish Setup
The chart now displays a new short position setup. This is a bearish, counter-trend trade designed to profit from a potential price rejection.
Strategy: To sell or "short" Bitcoin at a higher price, anticipating a pullback. This is a riskier strategy than trading with the trend, but it's based on the idea that the sharp rally is due for a correction.
The Setup is as follows:
Entry (Sell): $120,222.31
Take Profit (Target): $119,323.25
Stop-Loss (Invalidation): $120,579.09
In summary, after the breakout rally, the plan is to watch for signs of exhaustion. If the price pushes up to the $120,222 level and gets rejected, this trade aims to capture the resulting downward move towards the $119,300 area. The stop-loss is placed tightly above to manage risk in case the powerful uptrend continues without pausing

BTCUSDT Forming Strong BreakoutBTCUSDT is looking increasingly bullish as the pair continues to hold above its key support level, building a solid foundation for the next major leg up. The chart clearly shows a strong breakout pattern forming with higher highs and higher lows, signaling that the momentum is shifting in favor of the bulls. The well-defined support zone highlighted on the chart has repeatedly acted as a launchpad for buyers, making this area crucial for traders to watch closely. A breakout above the recent consolidation could open doors for a significant rally toward the 140% to 150% gain levels projected.
Volume for BTCUSDT remains robust, confirming the strong interest from both retail and institutional investors. This is a good sign because healthy volume typically precedes strong price action and follow-through. As Bitcoin continues to dominate the crypto market, it often sets the tone for the entire altcoin space, so a strong BTC rally could spark renewed optimism across the board. Traders are now keeping a close eye on whether BTC can maintain its position above the key psychological levels shown on the chart, as this could trigger another wave of buying momentum.
Investors are increasingly looking at BTCUSDT as a safe bet in an otherwise volatile market. Bitcoin’s fundamentals remain strong, with growing adoption, continued development, and macroeconomic conditions that could favor a hedge like BTC. Combined with the current technical setup, the outlook is promising for a big move to the upside. As we approach the next few weeks, the market sentiment suggests that any dips towards the key support level might be seen as attractive buying opportunities.
✅ Show your support by hitting the like button and
✅ Leaving a comment below! (What is You opinion about this Coin)
Your feedback and engagement keep me inspired to share more insightful market analysis with you!

Flawless ExecutionA picture-perfect trade on CRYPTOCAP:BTC from start to finish. 🎯
The Plan: Wait for the breakout above resistance.
The Result: A powerful move straight through our target zone.
Clean analysis, clean execution, clean profits. On to the next one.
#Bitcoin #Trading #Crypto #TechnicalAnalysis #BTC

Bitcoin hits a new high! Is this time really different?Bitcoin hits a new high! Is this time really different?
Bitcoin hits a new high! On July 11, BTC broke through $117,000 in one fell swoop, completely igniting market sentiment. Shorts were completely defeated, and 230,000 investors were liquidated within 24 hours, losing $541 million, of which 89% were short orders-this market is simply rubbing shorts on the ground!
But this rise is different from the past.
🔥 Why is Bitcoin so strong this time?
Institutions buy frantically: Bitcoin spot ETFs such as BlackRock and Fidelity continue to attract money, with net inflows exceeding $1.44 billion in 2025. What's even more exaggerated is that listed companies buy directly-143 companies around the world have hoarded 850,000 BTC, worth $95.3 billion! MicroStrategy alone holds 576,000 bitcoins and makes a fortune!
Expectations of Fed rate cuts: The market is betting that the Fed will cut interest rates this year, the dollar is weakening, and funds are pouring into Bitcoin for risk aversion.
Regulatory relaxation: Hong Kong, the EU and the United States are all promoting cryptocurrency compliance. The Trump administration even plans to establish a "national cryptocurrency reserve" to make institutions feel more at ease entering the market.
📈 Technical side: Can it rise again?
Breaking through key resistance: Bitcoin has stabilized at $112,000, the daily level "ascending triangle" breakthrough has been confirmed, MACD golden cross, RSI healthy (not overbought).
Next target: $120,000! But if it falls below $107,000, it may face a correction.
Be careful of high leverage: The current market is dominated by futures, and the spot/derivatives trading volume ratio is only 0.07. Once it pulls back, it may trigger a chain of liquidations!
⚠️ Risk: Don't be blinded by FOMO (fear of missing out)!
Short-term overbought: H4 level RSI has reached 72 and may pull back at any time.
Policy variables: If the Fed postpones the rate cut or the situation in the Middle East worsens, BTC may fall to $55,000!
Regulatory uncertainty: Global policies have not yet been unified, China still bans cryptocurrencies, and the problem of stablecoin reserves has not been completely resolved.
🚀 Operational suggestions: How to operate?
Radicals: Buy when it falls back to around $110,500, with a target of $120,000 and a stop loss below $107,000.
Conservatives: Wait until it stabilizes at $117,500 before chasing the rise, or wait until it falls back to the support level before entering the market.
Long-term holding (HODL): Institutions are hoarding coins, why are you panicking? But don't bet all in, keep some bullets to deal with black swans!
🎯 Conclusion: The bull market continues!
This wave of Bitcoin's rise is driven by institutions + policies + liquidity. Unlike the retail carnival in 2017 and 2021, this rise is more sustainable. But the market will not only rise but not fall, and it may fall back in the short term. Don't use high leverage!
Remember: make money in a bull market and make money in a bear market. Don’t be afraid of missing out (FOMO), and don’t be greedy. Only by surviving can you get the next wave of dividends! 🚀
(PS: If you haven’t bought it yet, don’t worry, wait for a pullback before buying it. There are always opportunities in the market, but if the principal is gone, it’s really gone!)
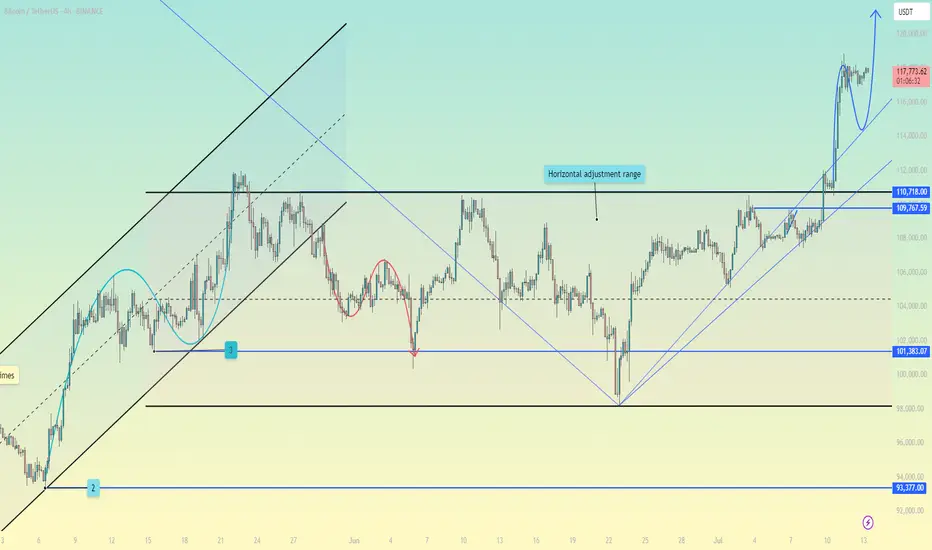
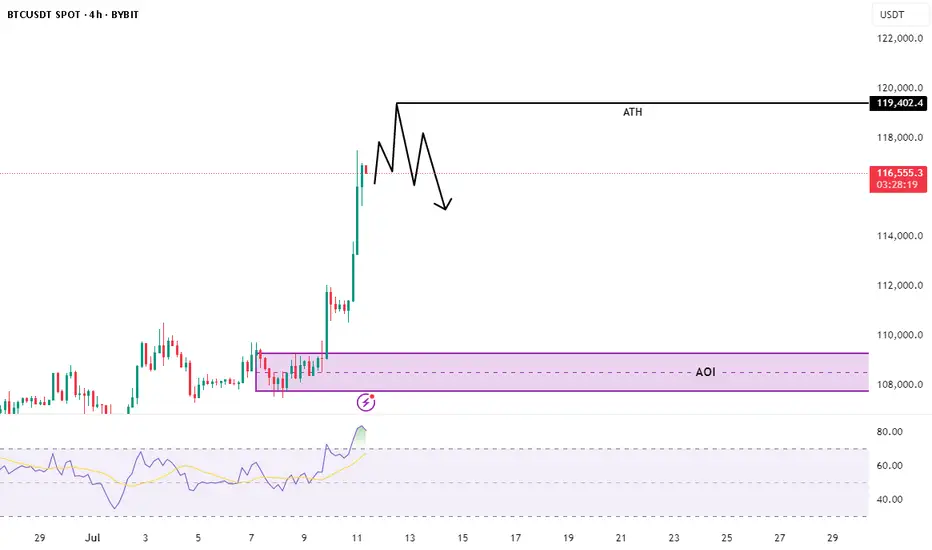
Chart Explanation: BTC/USDT (4H, Bybit)📊 Chart Explanation: BTC/USDT (4H, Bybit)
🟢 Current Situation:
BTC is pushing toward its All-Time High (ATH) level at $119,402.
We've seen a strong vertical rally with minimal pullbacks — classic "euphoria phase" behavior.
Price is currently around $116,500, getting close to major resistance.
⚠️ Key Observation – Bearish Divergence:
The Relative Strength Index (RSI) is showing bearish divergence:
Price is making higher highs
RSI is making lower highs
This signals momentum weakening, despite price moving up — a possible reversal warning.
🚫 Why No Trade (Yet):
You're not entering a position now because:
Price is near ATH — a major liquidity area where fakeouts are common
You expect a potential rejection or liquidity sweep near ATH
No confirmed reversal or entry trigger yet
🟣 What You're Watching:
The AOI (Area of Interest) marked around $108,000–$110,000
This is likely a previous consolidation or demand zone
If price retraces and gives a clean setup (e.g., bullish structure, volume, RSI reset), then you may consider a long entry
🔍 Summary:
You're being patient and strategic, observing potential weakness in momentum . now 119.4k will be next ATH. In my point of view .
No trade now — waiting for confirmation or a pullback into your AOI zone.
👉 Follow me on X for real-time market updates & trade ideas! 👇
#BTC #Bitcoin #Crypto #Trading #TA #RSI #Divergence
BTC - See you at 120k!As said to all 120k shall be your park stances! Lets see how it breaks the range of 120-125k huehuehue
BTC Bull Run Idea - 10 Year Resistance Line BreakIf we break through that 10 Year Resistance Line - 180k is the measured move