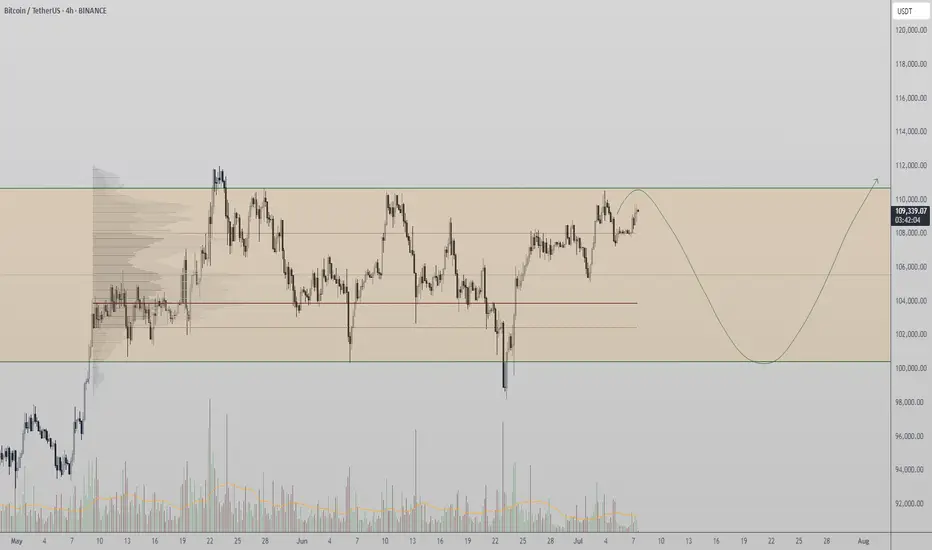
BTC updateHere is the next upside Target. But - we're overbought, so better (for longs) wait for pullback. Also, better for safety.
Good Luck!
BTCDOWNUSDT trade ideas
#BTC/USDT Bitcoin Recovers Above 108,000 $#BTC
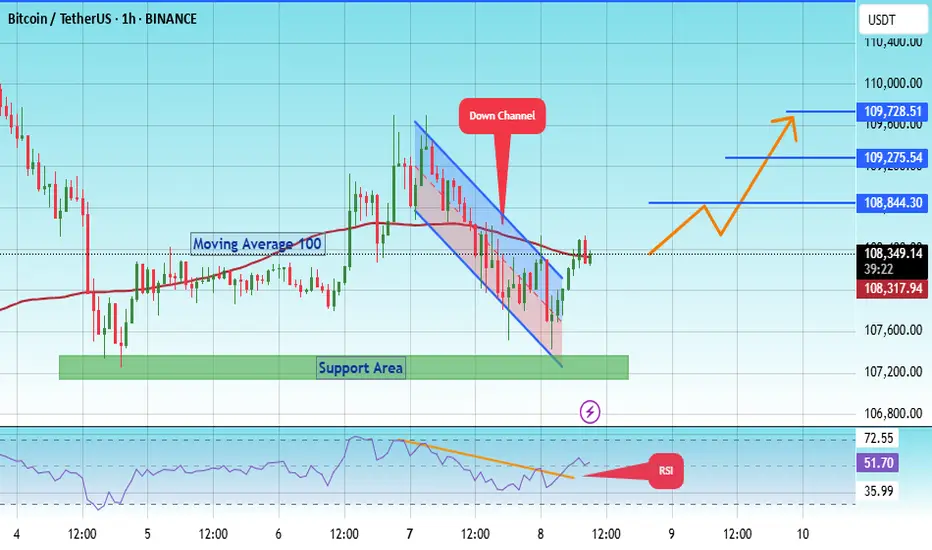
The price is moving within a descending channel on the 1-hour frame, adhering well to it, and is on its way to breaking it strongly upwards and retesting it.
We are seeing a bounce from the lower boundary of the descending channel. This support is at 107600.
We have a downtrend on the RSI indicator that is about to break and retest, supporting the upside.
There is a major support area in green at 107217, which represents a strong basis for the upside.
Don't forget a simple thing: ease and capital.
When you reach the first target, save some money and then change your stop-loss order to an entry order.
For inquiries, please leave a comment.
We are looking to hold above the Moving Average 100.
Entry price: 108337.
First target: 108844.
Second target: 109275.
Third target: 109728.
Don't forget a simple thing: ease and capital.
When you reach the first target, save some money and then change your stop-loss order to an entry order.
For inquiries, please leave a comment.
Thank you.
$BTC - Much Higher or Much Lower. EoY '26I'm not gonna lie, I drew these lines with my balls. I use them to move my cursor on my computer monitor.
This is not financial advice. This is just how my deep gut instinct likes to draw brushstrokes.
I gave 4 optional trajectories.
These will likely not happen, nor is it likely that the Price Action and Valuation will stay within these lines.
Enjoy and Happy Trading!
Mr. Storm

#BTC Rising Wedge📊#BTC Rising Wedge📉
🧠From a structural point of view, we are trading sideways above the support-resistance conversion zone, and the bullish force is gradually weakening. Only if we break through the blue turning point 109669, will new bullish expectations appear, otherwise we need to be alert to the correction at the daily level.
➡️From a graphical point of view, a rising wedge is formed here, and we usually fall according to this model. At present, it has fallen below the lower edge of the wedge and rebounded to the lower edge and was blocked. I expect a further decline.
Let's see👀
🤜If you like my analysis, please like💖 and share💬 BITGET:BTCUSDT.P

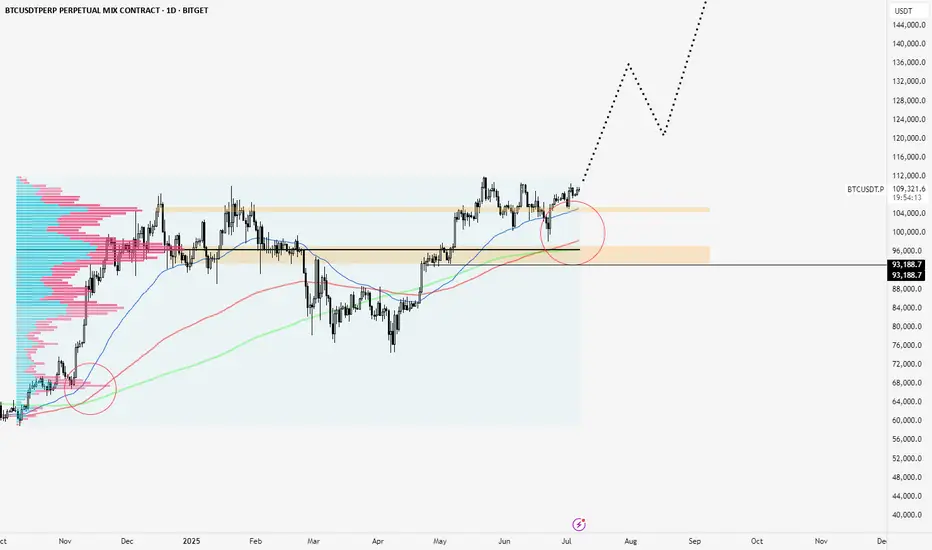
Bitcoin Breakout Ahead of Crypto WeekBitcoin has a great chance at cracking new all time highs and breaking out into price discovery this month. On July 14th, the US is considering it Crypto Week. Signing in the GENIUS bill, and more around crypto assets.
Bitcoin has held this volume shelf at around 104/105k for a while and these relative equal highs on the daily look like they can crack. I have highlighted some zones on the chart that I'd consider extremely important levels.
If we do crack these highs , I am on the side that the price action will be extremely expansive after all the work that has been done at those high volume clusters. If it fails I believe we should trade back to the high volume clusters, and if that doesn't hold, then we should trade through the thinner volume to do more business before bouncing off of the POC at around 96.5k.
The 50,150 & 200 EMAs are all signing ideal strength. Virtually all expansions in their early stages from 2023 to now contained these crosses on the Daily TF.
I am long BTC on a high timeframe. Macro narratives are strong, the asset is strong, and the downside is always in our control to be limited.
BTC/USDT Technical Analysis, 2025-07-07 11:30 UTC📊 BTC/USDT Technical Analysis, 2025-07-07 11:30 UTC
🕒 Binance Spot
📆 July 7, 2025 | 11:30 GMT Candle Observations
───────────────
💡 Price: 108712.97 USDT
📉 EMA200 (Dynamic): 108938.31
🟩 Support Watch: 107512.97
🟦 Resistance Target: 109782.97
───────────────
🔍 We're observing price action developing below EMA200, with a recent Piercing Line formation at a noted dip zone. This setup may suggest buyers are attempting to reclaim short-term control.
⚠️ Key tactical support remains near 107512.97, where historical reaction zones and liquidity zones intersect.
📈 A move toward 109782.97 is being monitored as a potential resistance test, in line with local OBV divergence and recovering bid pressure.
📌 Market Microstructure Notes:
• Order Book Imbalance leaning toward bids (+0.45)
• OBV Trend: +10.17% vs 5-period MA
• Thunder Engine Volume Acceleration: ⚡ Observed
• Whale Ask Cluster: ~640k USDT near top of range
📉 No guarantees of breakout or reversal watching how price reacts around key levels. Maintain cautious positioning near support/resistance pivots.

BTC Daily Chart Analysis
Trend: BTC is currently trading within a short-term descending channel.
Strong Resistance: Zone around $110k–112k, multiple failed retests observed.
Key Support: Around $105k (Ichimoku Cloud upper edge & recent local bottom).
RSI: Clear bearish divergence indicating weakening bullish momentum.
Elliott Wave: Completed 5-wave impulse from $75k up to $112k, now correcting (likely waves 4-5 within the descending channel).
Fibonacci: Breakout above $110k targets approximately $117k (1.414 Fib extension). Failure to break may lead price back down toward $102k.
Probability:
Bullish scenario (35%): Clear breakout above $112k, targeting $117k.
Bearish scenario (65%): Rejection at $112k, potential retest toward $105k → $102k.
⚠️ Recommendation: Closely watch the $110k zone. If BTC fails to clearly breakout, consider defensive actions (reducing position size, risk management).

Delayed Cycle Kicks Off This March? (Chart)🚀📈 Delayed Cycle Kicks Off This March? 🔥💡
March has (almost) arrived, and Bitcoin has officially confirmed $79,478 as major structural support—a critical level that had to be checked before the next move. This aligns perfectly with my previous idea of a delayed cycle playing out.
📌 Long above 79K
📌 Short below 79K
📌 Short-term target: GETTEX:87K+
With this structural support holding, I expect Bitcoin to push toward the next major test: $113,800. This is the all-time trendline, a level of historical significance.
🔑 What happens at 113K?
This is where Bitcoin’s fate for this cycle will be decided:
✅ A breakout above 113K could unlock a run to 150K - 200K, a true extension of this cycle.
❌ A terminal rejection at 113K could mark the end of this cycle, signaling a broader correction phase.
At the moment, the probabilities lean toward further upside, with an 80% chance of continuation. The 20% downside risk remains for a dip to FWB:65K-66K, but as long as Bitcoin stays above 79K, the bullish thesis remains intact.
💡 March looks strong, and I’m stepping on the gas today.
Let’s make it a powerful month! 🚀
One Love,
The FXPROFESSOR 💙
video:

Bitcoin Monthly · New ATH vs 2021, Indicators & MoreLast month Bitcoin produced its highest close ever, $107,146. The last three months all closed green, the close was higher than the open, and this is the fourth green month so far.
Bitcoin tends to produce a period of bullish consolidation before a major move, and this is exactly what we are seeing now. Bitcoin tends to produce a correction before a major bullish move, and this is exactly what happened between January and April. Bitcoin is set to grow.
Past action · consolidation
We already looked at the consolidation period that happens between each major price advance. Since 2022, Bitcoin has been moving sideways for some 200-220 days before each advance. This happened in 2022, 2023, 2024 and also now in 2025.
Looking at it from the monthly timeframe, the consolidation period was capped each time at 7 bars, 214 days. Current consolidation has already been going for more than 215 days. Bitcoin is set to continue growing.
Indicators · MAs, RSI & MACD
Bitcoin is trading above all moving averages. The monthly RSI is very strong, beyond 70.6.
The monthly MACD is moving at all-time high levels, trending up with room available for additional growth.
Chart patterns · candlestick reading
The chart patterns now has no similarities to 2021. Many people were saying that Bitcoin produced a double-top similar to 2021 and was set to move down. I completely disagree with this analysis.
In 2021 both instances when Bitcoin peaked the month ended up closing red. In 2025 the months when Bitcoin peaked the months ended closing green.
The same month the peak was hit in 2021 was followed by bearish action, twice. And of course, the bear market. In 2025 the market has been consolidating for months and trading near its all-time high.
Finally, in 2021 each peak was 7 months apart, 214. In 2025, the last two peaks are 4 months apart, only 120 days.
This difference is good to point out because market conditions are not the same. Not the same market conditions means that Bitcoin is not likely to go into a bear market now, instead, it can produce something difference. The market has only three directions: Down, sideways and up.
Down has been eliminated based on past action.
Sideways is happening now.
Something different only leaves the upside open; Bitcoin is going up.
Namaste.

$BTC/USDT Eyes $121KCRYPTOCAP:BTC has broken out of the descending wedge and is holding above key support around $106K.
The structure looks bullish with a potential move toward $121K (+11.24%).
As long as the price stays above the breakout zone, momentum favors the bulls.
DYOR, NFA

Is Bitcoin Getting Ready to dump?
In this analysis, I looked at the weekly, daily, and 4-hour timeframes and found some key signals that suggest a major shift might be coming in Bitcoin’s movement over the next few days and weeks.
If you don’t want to get caught off guard by the next big move, make sure to watch the video all the way through!

BTCUSDT 4H Analysis
BTC is consolidating below the key resistance zone highlighted in red (~$109,000–$110,000).
The price continues to form higher lows, showing bullish pressure despite rejection in the red zone.
The structure resembles an ascending triangle, indicating a potential breakout.
Upside Target: ~$113,500–$114,000 if the price moves above ~$110,000 with strong volumes.
Support Zone: ~$106,000–$106,300 must hold to keep the bullish scenario intact.
If the support breaks, the price could retest ~$102,000–$103,000.
Small Insights: Repeated retests of resistance suggest that bulls are absorbing supply. A strong push above the red zone could trigger a short squeeze.
Stay alert!
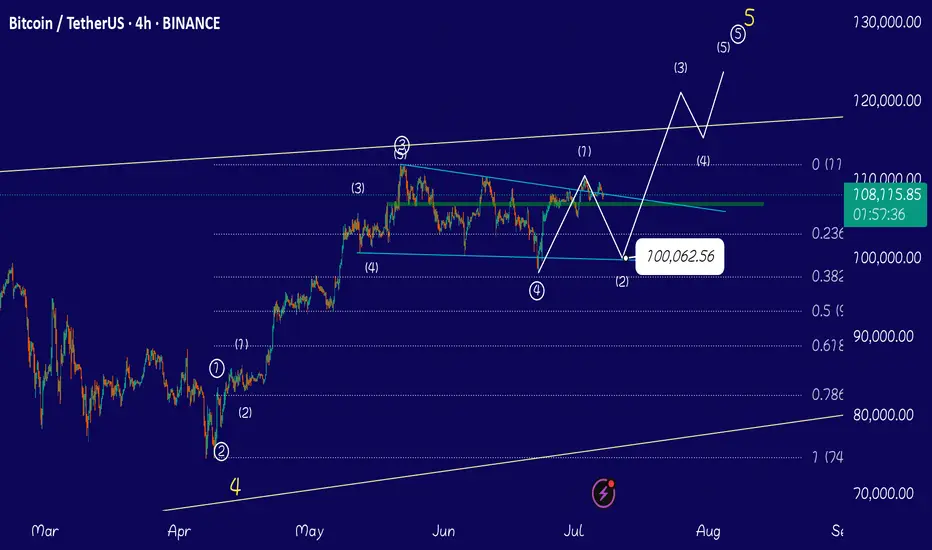
Wait for 100k ( read reasons)If you look at my chart you can see the truth, Elliott waves are well marked on the chart, we are now completing the micro wave 2 of the main wave 5, I expect the corrective micro wave 2 to correct the price to Fibonacci 0.78, which is exactly touching the lower descending line of the channel and includes the 100k price range. Wait for the micro wave 1 correction to complete and buy again in the 100k range. I will not open a short position and I advise you to wait for the price correction to 100k.

BITCOIN CRASH INCOMING!!! (Brace Yourself Now???) I am breaking down MARKETSCOM:BITCOIN and the potential completion of the 4th wave on an leading diagonal which might work as an early warning of a crash towards $93k!
Wait for the confirmations, and play the market with a proper trading strategy that you have backtested enough to be able to say that you will be long-term profitable. That means make sure your trading system is good enough that you always have an edge and a great enough money management system to make sure that you are giving your edge enough space to play out in the long run and be robust against losing streaks!

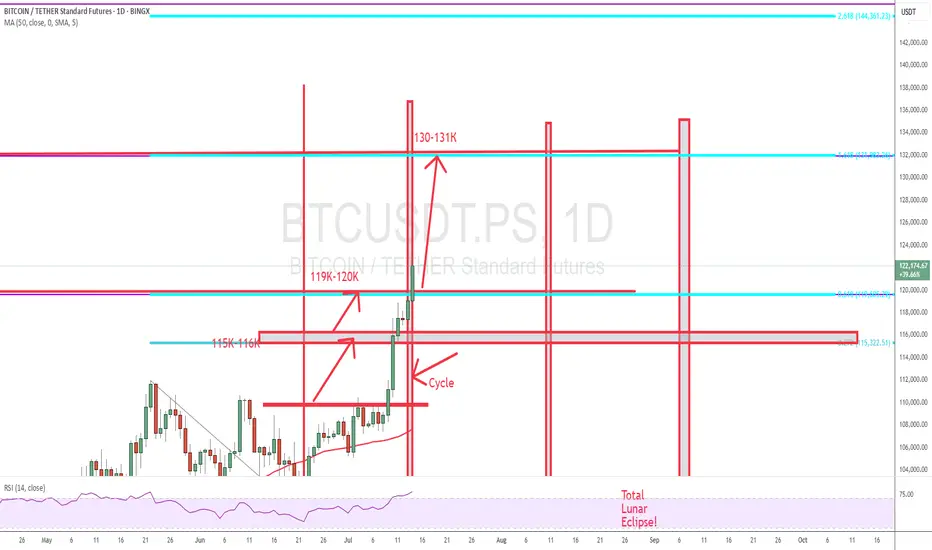
waiting for new ATH this week , btc💎 BTC PLAN UPDATE FOR THE BEGINNING OF THE WEEK (07/07)
NOTABLE BITCOIN NEWS: Focus on 4 key points today
1. Elon Musk – “America Party” to Support Bitcoin
Elon Musk has confirmed that his newly formed political party, the “America Party,” will support Bitcoin, stating that “fiat is hopeless.”
2. Cup-and-Handle Pattern Analysis: Targeting $230K
According to technical analysis by Cointelegraph, BTC is forming a “cup and handle” pattern on the monthly chart, which could lead to a target peak of $230,000 if a breakout continues.
3. BTC Price Holds Steady Around $109K Amid “Crypto Week” and Trade Tensions
Bitcoin is currently trading around $109,000, influenced by “Crypto Week” and concerns over U.S. tariffs.
4. Institutional Inflows Increase, But Market Demand Weakens
According to CoinDesk, institutional investors are still buying BTC, but not enough to offset declining demand in the spot market, negatively affecting short-term market sentiment.
⸻
TECHNICAL ANALYSIS PERSPECTIVE
The short-term trend remains bullish. However, the steep slope of the trend indicates buying pressure is still being contested and unstable.
BTC remains stuck at Fibonacci levels—pay close attention to the resistance zones at 112K and 115K. If these two resistance levels are broken, investors may get the answer to whether BTC can approach the 120K level.
In the short term, both gold and BTC are moving sideways, indicating that market liquidity and investor capital are unstable and being divided across multiple portfolios.
==> This analysis is for reference only. Wishing all investors successful trading!

How to Trade Smart Money Concepts (SMC)\ How to Trade Smart Money Concepts (SMC)\
\ This article explores the foundation, key tools, and practical insights of Smart Money Concepts — and why it’s worth your attention.\
In today's fast-changing financial landscape, Smart Money Concepts (SMC) has become a popular strategy among modern traders. But what is SMC exactly, and how can it improve your trading decisions? This article breaks it down in a simple, professional way for traders at all levels.
---
\ What Are Smart Money Concepts?\
SMC is a trading approach based on the belief that large institutions ("smart money") like banks and hedge funds control most of the market's movements. These institutions often move the market in ways that confuse or trap retail traders. The goal of SMC is to understand and follow the footsteps of these big players.
Instead of relying on simple patterns or indicators, SMC focuses on:
\ - Market structure\
\ - Supply and demand zones\
\ - Liquidity pools\
By aligning your trades with the behavior of smart money, you can position yourself more strategically in the market.
---
\ Key SMC Concepts Explained\
\ Order Blocks\
Order blocks are zones on the chart where large institutions have placed significant buy or sell orders. These zones often lead to strong price reactions and act as hidden support or resistance levels. Order blocks are considered more precise than traditional supply and demand areas.
Example: ()
\ Fair Value Gap (FVG)\
A Fair Value Gap occurs when price moves sharply in one direction, leaving a gap or imbalance in the price action. These areas often get filled later and can act as magnets for price.
In a bearish move, the FVG is the gap between the low of the previous candle and the high of the next one. In a bullish move, it's the reverse.
Example: ()
\ Timeframe Consideration\
If you can’t monitor charts during the day, avoid relying on 5–30 minute setups. Consider 4H or daily timeframes for clearer signals and more manageable trading decisions.
\ Liquidity\
Liquidity refers to price zones where lots of pending orders exist. These are usually at obvious highs, lows, or trendlines. Smart money often targets these areas to trigger stop-losses and generate movement.
One common tool to identify liquidity is a "pivot point," which is a candle with a lower low or higher high than its neighbors.
Example: ()
\ Break of Structure (BOS)\
BOS occurs when price breaks above or below a previous high or low, signaling a possible trend continuation.
Example: ()
\ Change of Character (ChoCH)\
ChoCH happens when the market changes direction. For example, if price breaks a higher low in an uptrend, it may signal a reversal.
Example: ()
Combined with BOS: ()
---
\ How SMC Compares to Wyckoff\
The idea of "smart money" isn't new. Richard D. Wyckoff, a pioneer in technical analysis, laid the foundation for understanding market cycles driven by institutions. His price cycle theory includes four phases:
\ 1. Accumulation\
Smart money buys while the public is unaware.
\ 2. Markup\
Price rises as smart money pushes the market.
\ 3. Distribution\
Smart money sells into public buying.
\ 4. Markdown\
Price falls as the cycle completes.
SMC borrows from this logic but focuses more on structure and liquidity zones. Still, the core idea is the same: understand what big players are doing, and follow them.
\ For deeper insights into Wyckoff, explore additional resources focused on accumulation/distribution cycles.\
---
\ Summary\
Smart Money Concepts give traders a deeper look into market mechanics. By focusing on order blocks, fair value gaps, liquidity, and structure breaks, SMC helps identify high-probability trade setups based on institutional behavior.
It may seem complex at first, but once you understand the basics, SMC can become a powerful tool in your trading strategy. Whether you’re new or experienced, aligning with smart money can improve your edge in the market.

Bitcoin: The night before the plunge? →104,000?
Bitcoin fell under pressure from highs, with short-term bearishness but strong long-term fundamental support.
1. Market fundamentals
Institutional holdings continue to grow
BlackRock Bitcoin ETF (IBIT) exceeds $72 billion in size, dominating the market
MicroStrategy holdings increased to 597,000 BTC (about $63 billion), continuing to increase holdings on dips
Global Bitcoin ETF Net inflow of $4 billion in June shows strong demand for institutional allocation
Policy and regulatory progress
The U.S. Treasury Department plans to include Bitcoin in the "strategic reserve assets" to enhance its legal status
The SEC will make a ruling on spot ETF option transactions on July 15, which may bring new liquidity
The Trump administration plans to impose a 60% tariff on China, and market risk aversion may heat up again
On-chain data changes
A 14-year dormant address recently transferred 80,009 BTC (about $8.69 billion), triggering concerns about selling
The lightning network capacity exceeded 5,000 BTC, and Tether (USDT) completed the lightning network integration
II. Technical depth Degree analysis
(1) Medium-term trend structure (4-hour level)
Rising channel break: After the price peaked at $112,000, it continued to fall below the rising trend line support
Range oscillation formation: Currently, $98,000-110,700 constitutes the main trading range, and the middle track support is $104,000
Volume change: The recent decline is accompanied by an increase in trading volume, indicating that the short-term momentum is increasing
(2) Short-term trading signals (1-hour level)
Double top pattern confirmation: $110,700 was tested twice without breaking, forming a typical reversal structure
Moving average system short arrangement: EMA5/10/30 formed a death cross, suppressing price rebound
Key support level:
▶ First support: $106,500 (Fibonacci 38.2%)
▶ Second support: $104,000 (psychological barrier + previous low)
▶ Strong support: $98,000 (lower track of the range)
III. Trading strategy suggestions
1. Aggressive short position layout
Entry range: $109,000-109,500
Stop loss setting: $111,000 (above the previous high)
Target: $106,500→$104,000
Technical basis: downward trend line suppression + RSI top divergence
2. Steady retracement of short positions
Entry signal: 108,000-108,500 rebound encountered resistance
Stop loss setting: $110,000 integer barrier
Target: $104,000 (break down to see 98,000)
3. Long defense area
Key observation position: 104,000 US dollars (if there is a large volume to stop the decline, you can try long with a light position)
Breakthrough signal: Stabilizing 110,700 US dollars will restart the upward trend
IV. Multi-dimensional market outlook
Short-term (1-2 weeks):
Affected by technical suppression and whale movements, it is expected to maintain 104,000-110,700 range fluctuations
Focus on the effectiveness of 106,500 support, breaking down will accelerate the test of the lower track of the range
Medium-term (Q3 quarter):
Institutional continued holdings + Fed rate cut expectations constitute long-term support
If it breaks through 112,000 US dollars, it will open up to 120,000-125,000 upside space
Risk warning:
The SEC option trading ruling on July 15 may cause violent fluctuations
Global macroeconomic data (especially CPI) will affect market risk preferences
V. Professional trading suggestions
▶ Currently, the "rebound short" strategy is preferred, and stop loss is strictly set
▶ Long-term investors can arrange in batches in the range of 98000-104000
▶ Pay close attention to:
Daily ETF fund flows, changes in on-chain whale addresses (glassnode alert system), US CPI data (released on July 12)
Conclusion: Although the short-term technical side is bearish, the long-term fundamental support of Bitcoin remains solid. It is recommended that traders seize the opportunity of range fluctuations, operate flexibly at key support/resistance levels, and wait for new trend signals to be confirmed.

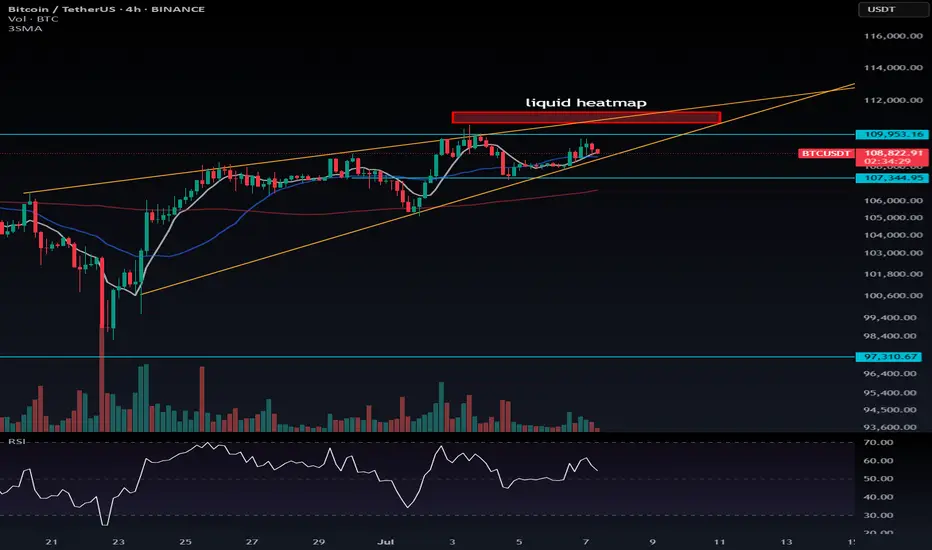
BTC Forming Higher Highs & Lows | Watch the Wedge Breakout📈 BTC Forming Higher Highs & Lows | Watch the Wedge Breakout 📉
In the uptrend that started around $100K, Bitcoin is forming higher highs and higher lows on the 4H timeframe, which is in line with Dow Theory. Based on the orange lines I’ve drawn, it seems we are moving inside a rising wedge pattern.
🟠 Key Observations:
Breakout from either side of the wedge can trigger a trade, but I personally won’t enter based solely on the wedge.
If BTC breaks upwards, I’ll hold my existing long, not looking to short — because the mid and long-term trend is still bullish.
📌 New Trigger Level: The previously important level of $110,246.8 is now less relevant for me. The market has already rejected from $109,953.16, so that’s my new key level.
👉 I’ve placed a stop-buy order at $109,953.16 based on the 1H chart.
💣 Short Liquidation Zone (Updated):
Now ranges between $110,640 to $111,320
If you're looking to trade momentum:
RSI above 70 on 4H, or
Above 76.23 on 1H = potential trigger for long entries
👉 I'm planning to open a long position above $109,953.16 using a stop-buy order, with the help of the order book in the exchange.
⚠️ Currently, I don’t have a high-confidence stop-loss level — I’ll update as I see clearer price action.
🧠 Pro Tip:
Do everything you can to catch a BTC long position. If you understand risk management and position sizing, don’t be afraid of stop-losses — they’re part of the game.
If you're unsure what proper risk/money management is, go learn it now, or you will definitely get liquidated someday.
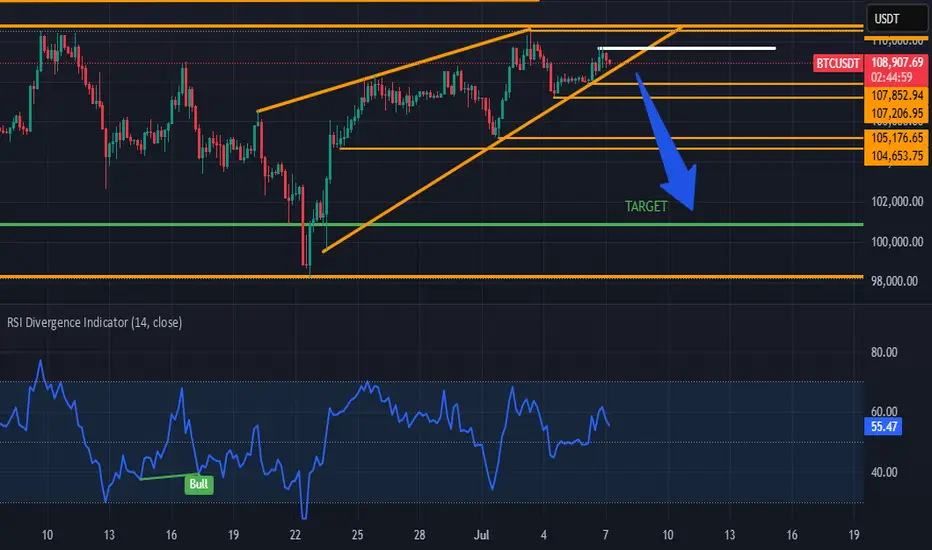
BTC IS ABOUT THE RETEST THE 100.000 RANGE AGAIN BTC is about to break out of a bearish wedge and according to the Fibonacci extension it will test the $100,000 range again! I can also analyze a bearish divergence on 1 hour chart. Good luck folks... What are your ideas on that one?
Bitcoin Tests Range High Again — Will This Time Be the Breakout?Bitcoin is once again at the top of its multi-week range, testing resistance near previous highs. A decisive breakout remains elusive as price struggles to sustain momentum without volume confirmation.
Bitcoin is back at a familiar technical level — the top of its long-standing trading range. After a weekend rally that pushed price toward range resistance, BTC now finds itself hovering near the weekly open, raising questions about whether this move will finally lead to a breakout or simply mark another deviation. With historical price action showing repeated failures at this level, all eyes are on volume and confirmation to validate the next directional leg.
Key Technical Points:
- Range High Resistance Reached Again: BTC testing resistance zone that has capped price for weeks
- Weekend Pump, Weekday Fade: Price surged over the weekend but is now settling near the weekly open
- Volume Still Lacking: No breakout confirmation without a strong influx in volume
The recent price surge in Bitcoin occurred over the weekend — a time when liquidity is typically thinner and institutional volume is reduced. While this move did push BTC back into the upper portion of its range, it’s important to recognize that the price is once again stalling near the range high. This level has historically acted as a firm resistance, and prior attempts to break above it have resulted in deviations followed by re-entries into the range.
This time is no different — so far. The current consolidation just below the high suggests the market is undecided, awaiting further confirmation through volume or macro developments. Without a high-time-frame close above the range resistance — and without meaningful volume behind it — the likelihood of this being another deviation remains high.
It’s also worth noting that BTC is back near the weekly open, which suggests the weekend rally may lack sustainability. In similar past instances, Monday retracements have confirmed that weekend pumps were driven by thinner liquidity and lacked conviction. Until proven otherwise, this appears to be more of the same.
From a structural standpoint, Bitcoin continues to trade within a well-defined horizontal range. This means oscillations between the range low and range high are still valid expectations until a breakout or breakdown occurs. These types of consolidations often persist until a major catalyst, and while the breakout is inevitable, it hasn’t happened yet.
Expect Bitcoin to continue ranging between its established high and low unless volume confirms a true breakout. A failure to hold above the current highs may trigger another rotation back toward range support.
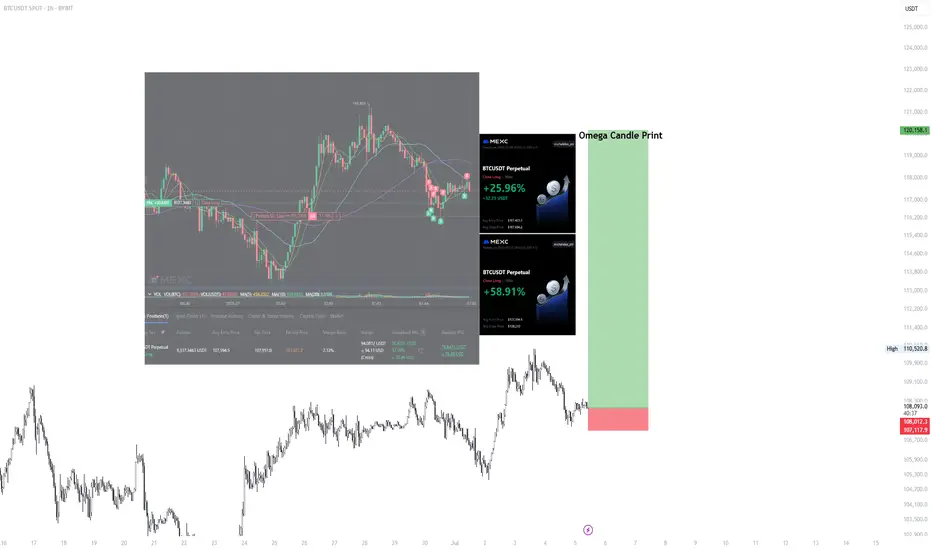
BTC/USDT BYBIT IDEA #2 – Local Range Hold and OMEGA CANDLE PRINTThis is my second Setup I am currently in - apart from going to 6h orderblock we will hold the LTF range and continue higher breaking new highs and starting price discovery.
Combined this with Bullish News could bring amazing BTC Run, followed by Altcoin Season in Mid August/September. If you look into Bitcoin Balance and the way this token is being bought and accumulated by institutions.
The way you know Bull Run is about to start is because no Grandmas and Taxi Drivers are talking about it.
I would not believe it myself but here we are.
The way I do this I keep my position running from lows (bought at 107 400) and I am buying LTF ranges for extra 30-40% of existing position and then closing around the same amount on highs of LTF like 15M-30M.
looking for longs, my SL is set for break even.
Good luck.
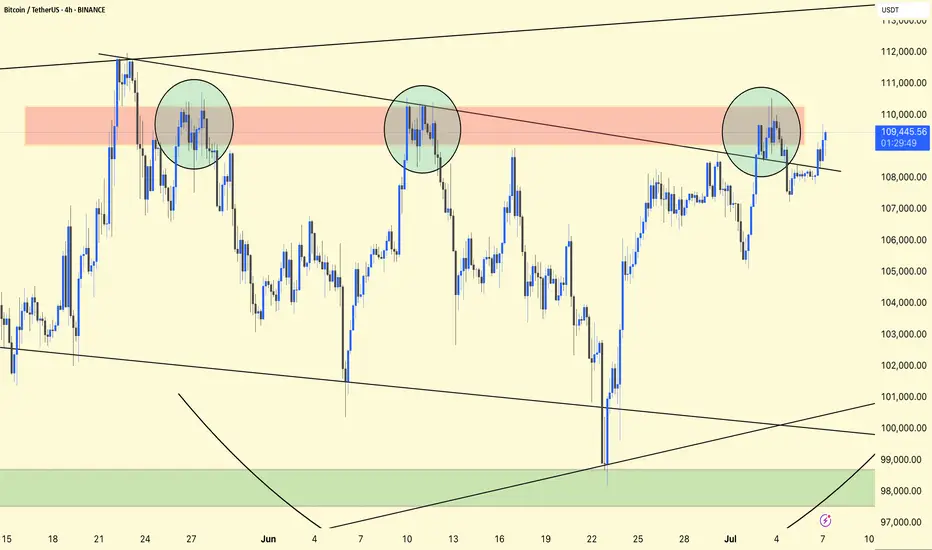
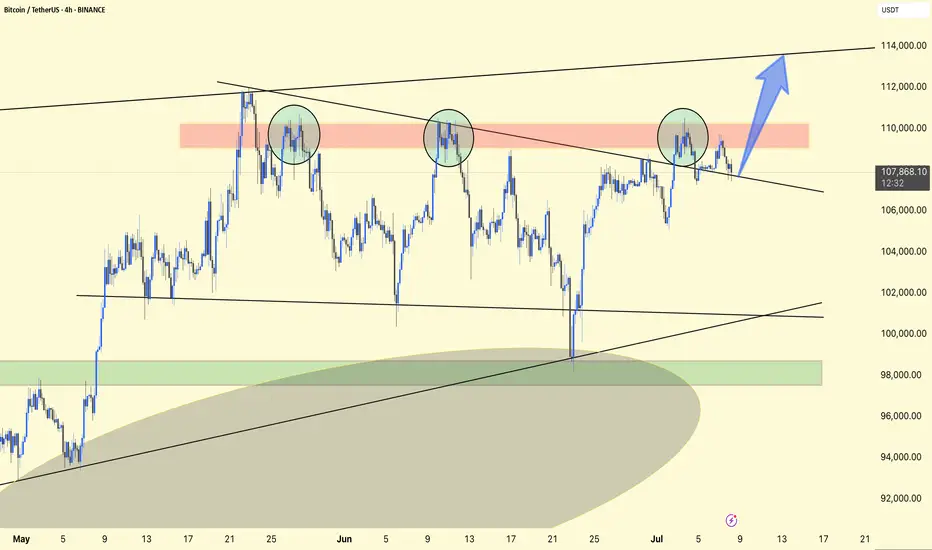
BTC/USDT CHART ANALIYSIS !!BTC/USDT
You have three circles highlighting repeated price rejections around the $109,000–$110,000 area (red resistance band).
A descending trendline connects those high points, creating a sloping resistance.
There is a broad support area around $98,000–$100,000 (green area below).
The price recently broke above the trendline and is now retesting around that $109,000–$110,000 area.
If BTC stays above ~$108,500–$109,000, it could head further towards $112,000–$113,000.
A drop below the trendline and back to $107,500 could trap the bulls, leading to a retest of $105,000 or lower support around $100,000.
Bullish setup: Entry $108,800–$109,200, target $112,000–$113,000, stop-loss below $107,000.
Bearish setup: Short if price rejects $109,500–$110,000, target $105,500, stop-loss above $110,800.
Stay alert!