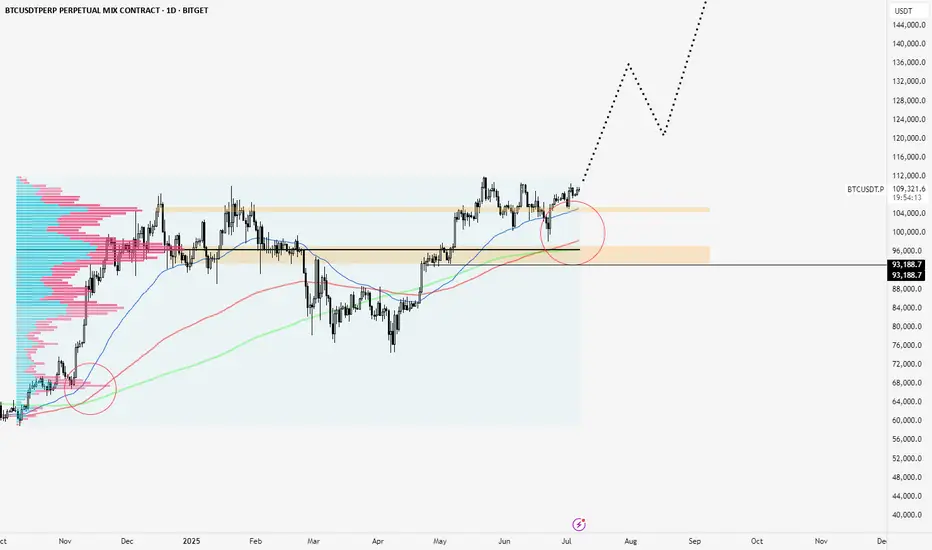
Bitcoin's Consolidation Almost Over —200-220 DaysBitcoin's consolidation period before a bullish breakout tends to last some 200-220 days on average. We have four instances of this pattern since the 2022 bear market counting 2025. Let's look at those. This proves that Bitcoin is set to grow in a matter of days. Continue reading below and make sure to boost. When you reach the end of the article leave a comment with your opinion about this issue. Do you agree? Do you disagree? Can you see what I mean?
» Back in 2022 Bitcoin consolidated for 203 days before a bullish breakout.
» Back in 2023 Bitcoin consolidated for 203 days before a bullish breakout.
» Back in 2024, last year, Bitcoin consolidated for 217 days before a bullish breakout.
It really depends on where you start counting for the total days but it all adds up to 200-220 days. With 220 being the maximum.
» Currently, in 2025, Bitcoin has been consolidating for 210 days. Looking at previous patterns, this means that only a few days are left before Bitcoin produces a bullish continuation.
We also saw that once Bitcoin breaks out of a this long-term consolidation range/period/phase, it never moves back to the lows of the consolidation range. That is, Bitcoin will never trade below 80K nor 90K once it resumes growing.
I am estimating that the next jump can start as early as next week. The entire move can take months to develop. After a peak is reached, Bitcoin will then start a new consolidation phase with a bearish bias first. This bearish bias produces a low after several months yet a strong higher low compared to the previous consolidation period which is current prices. After this low, more consolidation and then a new bullish jump.
If we take into consideration a bear market, then the dynamics can be different. Bear markets only happen once every four years. Seeing how different market conditions are now, the next bear market will be interesting because it won't be anything like the bear markets of the past. Bitcoin will remain much stronger but that is an analysis for another time.
Summary
Bitcoin is going up. It is very close now. When Bitcoin breaks up and hits a new all-time high, just to continue growing, the altcoins market will explode. You've been warned.
Now you can leave your comment.
Share your opinion on the comments section below. I know you have something to say. You've been trading Cryptocurrencies for years, buying and selling, making profits so... Are you ready for the 2025 bull market?
Thank you for reading.
Namaste.
BTCDOWNUSDT trade ideas

BTCUSDT – The Liquidity Mirage: This Pump Is a Setup!Chart Type: BTCUSDT | 1D & 8H Analysis
Status: Live Reversal Setup | FOMO Trap Triggered
⸻
🧠 Overview:
What looks like a breakout is actually a trap. This pump has violated key sniper rules:
• No reactive volume confirmation
• No structure retest
• Triggered FOMO entries at the highs
• TP booked by whales while retail enters late
Instead of continuation, BTC is setting up for a controlled distribution dump.
⸻
🔍 Sniper Observations:
Component Kaizen Verdict
Volume >> ❌ Weak → No relative confirmation
RSI >> ⚠️ Flat → Bearish Divergence Expected
Structure. >> ❌ No retest or reclaim → Just exhaustion
FOMO Activity >> ✅ High → Clear Retail Entry Trap
Liquidity Above >> ✅ Filled → Nothing left to chase
Whale Behavior >> ✅ TP Booked → Exit has begun
⸻
💣 Liquidity Cloud Mapping:
112,000–114,000 = Retail Exhaustion Zone
✅ TP Booked
✅ FOMO Entry Triggered
✅ Liquidity Grab Completed
108,000 = First Profit Zone (TP1)
Institutional cluster > Buy-back likely
105,000 = Final Target Zone (TP2)
Reversal + SL stack of FOMO longs
93,000–95,000 = Full Trap Unwind
Bonus TP for deep reversal setups
⸻
🎯 Short Plan
(Live Deployment Ready)
Component Value
Entry Zone | 🔫 112,450 – 113,000
Stop Loss | 🛡️ 114,050 (Above fake breakout wick)
Take Profit 1 | 🎯 108,092
Take Profit 2 | 🎯 105,175 (Retail Flush & Whale Reload)
Bonus TP | 🎯 93,218 (Full exhaustion if volume spike appears)
Leverage | ⚔️ 3x–5x recommended for precision swing short
Position Type | 🧠 Swing short / Trap Reversal
⸻
🔑 Trigger Confirmation Before Entry:
1. ✅ 4H Candle Rejection from 112,450+ zone
2. ✅ Divergence in Volume (Price ↑ but volume ↓)
3. ✅ Momentum Fade on RSI or OBV
4. ✅ Spoof walls appear above 112,700 (signs of artificial sell pressure)
⸻
🧠 Why This Trade Works:
• Retail just entered at highs after seeing “confirmed breakout”
• Whales already exited at 112K+
• Market requires fuel for reversal = Retail SLs + Exit Liquidity
• Volume does NOT support real continuation
• Price will trap both bulls & late shorts before true reversal triggers
⸻
🚨 Risk Warning:
If BTC closes above 114,000 with sustained volume AND retests that level, the setup invalidates.
Don’t hold a sniper entry into strength. This is a precision trap entry, not a momentum chase.
⸻
📢 Final Note:
“The most profitable trades come when the crowd is silent, and the volume is fake. This is one of those setups — you’re not late. You’re right on time.”

Bitcoin (BTC): Buyers Are Building Up The Volume | Be ReadyBuyers are still holding strong where price is not showing any signs of weakness. With that being said, we are seeing the volume gathering near the current zone, which might result in a breakout and a strong upwards movement.
A new ATH is coming; this has been seen already once on the BTC, so it is just a repeat of history.
Swallow Academy

Bitcoin turns bullish again | Price target = $140k++After 2 months of consolidating within a descending channel, Bitcoin has finally broken out, confirming a major technical breakout and shifting the structure back to bullish. The breakout was followed by a clean retest of the channel resistance turned support, which is now acting as a launchpad for the next leg up.
🧠 Technical Analysis:
Descending Channel Breakout: Price has convincingly broken out of the downward sloping channel, invalidating the bearish structure and flipping it bullish.
Retest Confirmation: The price is currently retesting the upper boundary of the channel — a textbook bullish retest. This confirms buyer strength and shakes out weak hands.
Liquidity Magnet Above 111k: A significant cluster of buyside liquidity sits above 111k. Once that level is breached, expect an explosive acceleration toward 120k.
Measured Move Target: Based on the height of the prior impulse (from April to May), the projected extension points to ~140k.
🌍 Macro & Sentiment Drivers:
ETF Flows & Institutional Demand: U.S. Bitcoin Spot ETFs continue to show consistent inflows, signaling strong institutional accumulation — a major shift in long-term demand.
Fed Pivot Speculation: Expectations for a Fed rate cut later in 2025 are building. Lower interest rates could fuel risk-on sentiment, pushing capital back into crypto.
Big Beautiful Bill: This bill is expected to inject money into the economy, increasing liquidity — ultimately going into crypto. This bill will be signed into law today.
Bullish crypto developments: Settlement of the XRP SEC case, spot crypto ETFs, mainstream crypto adoptions, etc. will all contribute to the bullish sentiment.
🧩 Final Thoughts:
This setup combines strong technical structure, favorable macro tailwinds, and clear liquidity targets. The coming days are critical — if Bitcoin clears 111k cleanly, it could trigger a short squeeze and FOMO-driven rally straight into 120k.

Bitcoin Expecting Bullish FormationBitcoin could be triggered by negative news from the U.S. regarding tariffs, which may create market uncertainty and push investors toward risk-off or alternative assets like crypto.
Currently, Bitcoin is reacting to the decline caused by fundamental negative data, but bullish sentiment remains alive as buyers attempt to hold key support zones. The focus now shifts to the psychological resistance near 110K
You may find more details in the chart.
Ps support with like and comments for more better analysis.
BTC third tap incoming? Recently, BTC has traded for a large amount of time in ranging environments. These ranges have started with a local range high and then an initial 3-tap accumulation (i.e., a local low and then two sweeps of that low) before making a solid attempt at the range highs. The sweeps of the lows are meant to shake people out and provide fuel to try to break higher. The previous two times, that initial attempt failed and the price was sent lower to put in a second 3-tap accumulation at lower prices.
Will the current price move back down to put in the 3rd tap of the current relatively small accumulation? That is my base case. I believe we will see some lower prices locally to put in the 3rd tap. I think the Bitcoin Swing Trade Indicator (BSTI) will fire off green one more time and then we will then make a run to try to break out of this current massive range (that started last year in November). This current range is fairly small, so it is not worth it to me to sell here to try to buy lower.
The bigger question is: Will we have enough fuel to durably break out of this range after the 3rd tap of the current accumulation (green line) or are we destined to repeat the pattern of the last two bigger ranges (red line), one of which we are still in? I personally believe we will break out after the smaller range 3rd tap (the green line) based on the larger context of cycle theory, how long we have been in this range, and how the current small range is part of the larger range starting back in November 2024.
It will be interesting to see what happens.
Da_Prof
Note that TV won't allow publication of a private/unpublished indicator anymore or I would have shown the BSTI, which is now published as invite only. It's implementation is too complicated to publish openly, so I don't feel comfortable doing that. If you want access, please DM me on TradingView. Thanks.

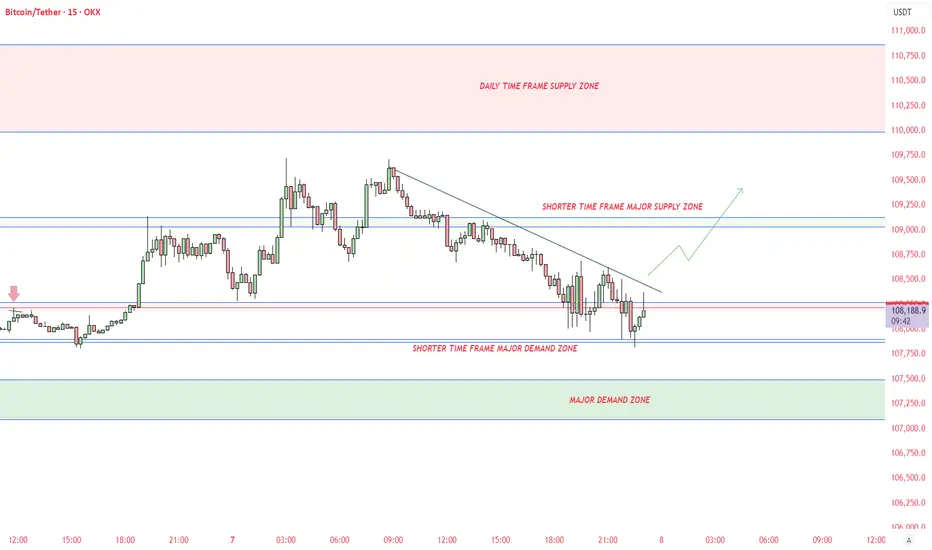
BTCUSDT - MOSTLY UPTREND DIRECTIONAll supply demand zone identified.
May breach till 110000$. Please do your own research before taking any trades
BTCUSDTWait for breaked ATH for 115K target.
BINANCE:BTCUSDT.P
Now price is in two level trading renge but come entry volume of buyers.

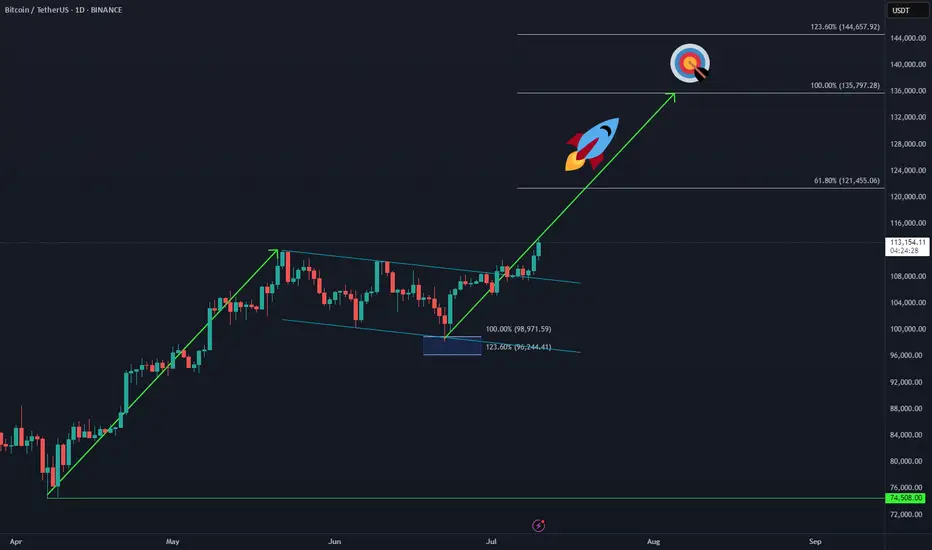
BTC Flag Pattern's Target @ 145,XXX $ [10/07/2025]🚀 BTC Breakout from Flag Pattern: Aiming for $145,000!
Bitcoin has just broken out of a textbook Flag Pattern, a bullish continuation signal that suggests the rally is far from over. Traders jumped in as price pierced through resistance with rising volume—classic breakout behavior. Stop-loss placed below the flag, profit target measured from the flagpole... all signs point to upward momentum.
🎯 Target? $145,000.
🔥 The rocket has launched, and it's not looking back. Fasten your seatbelt and cheer it on—let’s go, BTC! Make that flag fly high and beyond! 🤑🚀

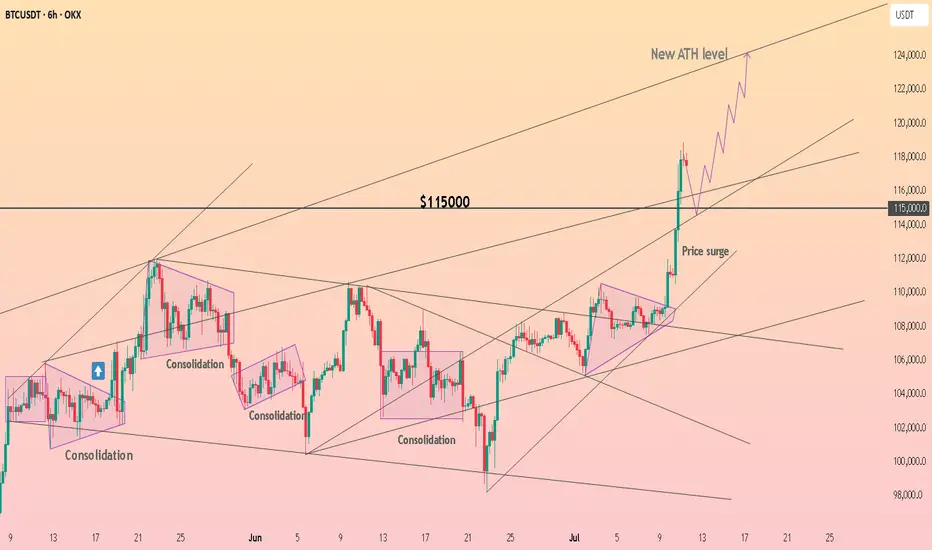
HolderStat┆BTCUSD above the $115kOKX:BTCUSDT broke out of its consolidation structure and surged past $115,000 resistance. The price is showing parabolic behavior as it targets the ATH level near $125,000. Structure remains bullish as long as the support base near $113,000 holds.
Bitcoin Breakout Ahead of Crypto WeekBitcoin has a great chance at cracking new all time highs and breaking out into price discovery this month. On July 14th, the US is considering it Crypto Week. Signing in the GENIUS bill, and more around crypto assets.
Bitcoin has held this volume shelf at around 104/105k for a while and these relative equal highs on the daily look like they can crack. I have highlighted some zones on the chart that I'd consider extremely important levels.
If we do crack these highs , I am on the side that the price action will be extremely expansive after all the work that has been done at those high volume clusters. If it fails I believe we should trade back to the high volume clusters, and if that doesn't hold, then we should trade through the thinner volume to do more business before bouncing off of the POC at around 96.5k.
The 50,150 & 200 EMAs are all signing ideal strength. Virtually all expansions in their early stages from 2023 to now contained these crosses on the Daily TF.
I am long BTC on a high timeframe. Macro narratives are strong, the asset is strong, and the downside is always in our control to be limited.
Bitcoin (BTC): Markets on Fire | Almost at $120K (140K Next?)Markets are going crazy, people are in fear of missing out (FOMO) and we are just chilling; the price moved exactly like we needed it to move.
We are very close to our target of $120K,, where we might see some kind of strong rejection or even stronger bullish volume (we will have to reach this areaa before deciding our next gameplay).
What we see or aim at is $140K to be a local to for this bull run. After that we are expecting more of sideways movement and then a bigger correction to happen.
Swallow Academy

Lower time frameI've shared an analysis from a lower time frame, that could indicate the start of a big move.

BTC - PATH to 110.5KSOO the Liquid moves or news moves made it ecstatic and so is the top move, close below 107,990 in 1H will nullify this, else yet another squeeze coming!

BTCUSDT: Trend in 2H time frameThe color levels are very accurate levels of support and resistance in different time frames.
A strong move requires a correction to major support and we have to wait for their reaction in these areas.
So, Please pay special attention to the very accurate trend, colored levels, and you must know that SETUP is very sensitive.
BEST,
MT

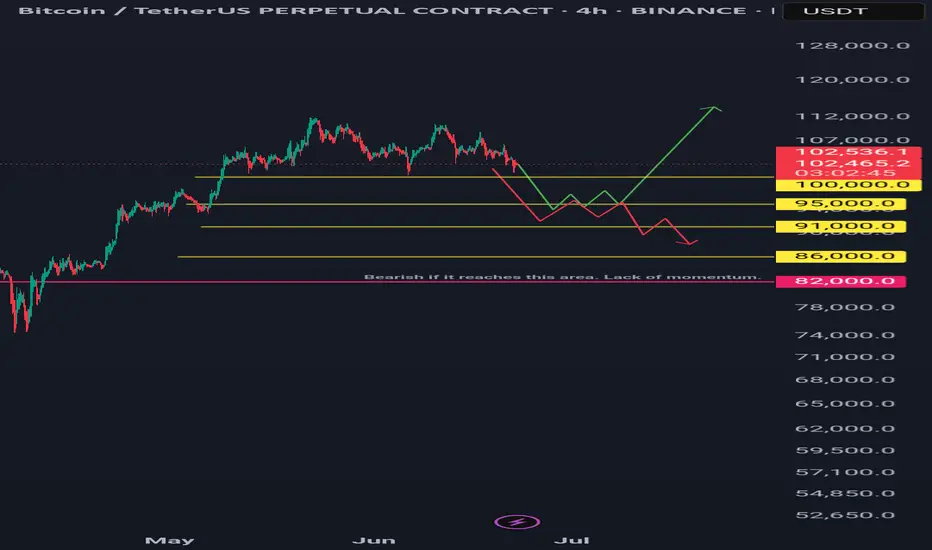
Btcusdt 4hr tf scenarios.Two scenarios: green and red lines.
Green Line: A bounce and sustained recovery above the 100-day and 200-day daily moving averages is bullish.
Red Line: A bounce followed by a lack of momentum and a break below a previous low is bearish.
Long Horizontal Red Line: If the price reaches this area, it could signal the start of a downtrend unless new bullish fundamentals emerge.
My Point of View (POV): I am bearish, primarily due to the ongoing war, similar to the conflict that began between two other countries a year ago.
However, it's important to note that every crisis and recession has historically presented a buying opportunity for institutions and 'whales.' Therefore, be prepared with funds for dollar-cost averaging (DCA), then simply hold and forget. It is recommended to conduct backtesting and research to identify optimal buying areas. DCA is key. Only invest money you can afford to lose.
Bitcoin Makes New ATH – Next Sequence in Play 🚀 CRYPTO:BTCUSD has officially broken into new all-time highs, confirming the next bullish sequence is underway.
The upside projection now opens toward the $135K–$144K zone, aligning with long-term Fibonacci extensions and cycle projections.
📌 As always, it won’t be a straight line—expect step-by-step progress, with consolidations and pullbacks along the way. But the structure remains bullish, and the path is unfolding.
BTCUSD – Is This the Macro Top? Sell?This analysis is based on a convergence of classic technical signals, structural wave counts, and institutional order flow. Together, they strongly suggest that we may be witnessing a macro distribution phase, possibly leading into a larger correction.
1. Elliott Wave Count (Supercycle and Cycle Degree)
-Clear channel from 2018–2025 defining the entire impulsive structure.
-Final wave V is subdivided into five minor waves, with the fifth showing characteristics of an ending diagonal (low momentum, overlapping waves).
-Sructure is consistent with terminal wave exhaustion, including a false breakout and multiple rejections.
2. Volume Profile and Institutional Flow
-High-volume nodes at the top (Coinbase/Binance) align with historical distribution zones, not accumulation.
-Likely OTC activity as smart money exits quietly near all-time highs.
-VPVR shows major support clusters far below current levels (100k–88k), highlighting inefficient price zones above.
3. Weekly Technical Indicators
-RSI (classic and McAfee-based): long-term bearish divergence vs price.
-Stochastic RSI: extended overbought conditions; full cycles often reverse from this zone.
-MFI (Money Flow Index): >80 — historically precedes top formation in BTC.
-MACD: approaching a potential bearish cross in the coming weeks.
-WaveTrend Oscillator: peaking — behavior matches major tops in 2021 and 2017.
4. Moving Averages & Structural Support
-EMA21 (Weekly): ~96k — likely target for wave A of a corrective phase.
-EMA50: ~87k — coincides with cluster of historical buying interest.
-EMA100/200: ~68k and ~50k — long-term value zones if correction deepens.
5. Pivot Levels & Price Structure
-Price reached R1 (112,400) and is showing rejection — classic pivot reversal behavior.
-S1/S2 (~100–92k): probable short-term correction zones.
-S3/S4 (<88k): targets for deeper wave C or end of macro correction.
6. Institutional Behavior & Sentiment
-Large buying volume at the highs does not represent breakout momentum — likely retail absorption of institutional selling.
-Momentum divergence and false breakout behavior reinforce the distribution thesis.
-Sentiment: overly bullish news and euphoria align with classic retail top behavior.
Conclusion
This confluence of Elliott Wave structure, volume profile, indicator exhaustion, and institutional flow activity points to a high-probability macro top in Bitcoin. While no analysis is infallible, the alignment of so many signals is rare and demands attention.
Disclaimer:
This is not a recommendation to sell. This is a technical analysis intended purely for educational and analytical purposes.

BTC Correction's 📉 Significant Bitcoin Correction During Uptrend
After a strong bullish rally, Bitcoin has entered a correction phase, retracing nearly 25% of its recent gains. Interestingly, this correction aligns exactly with the 200-period moving average on the 4-hour chart, marking a potential key support level.
🔍 Is Bitcoin’s Correction Over or Just Beginning?
The overlap with the 200 MA could signal the end of the correction, but if this zone fails to hold, deeper targets between the 35% and 75% retracement levels may come into play.
🛡️ Potential Support Levels for Bitcoin if the Correction Continues:
First support: 102,200 USD – 25% correction
Second support: 93,200 USD – 35% correction
Third support: 84,100 USD – 50% correction
Fourth support: 74,600 USD – 75% correction

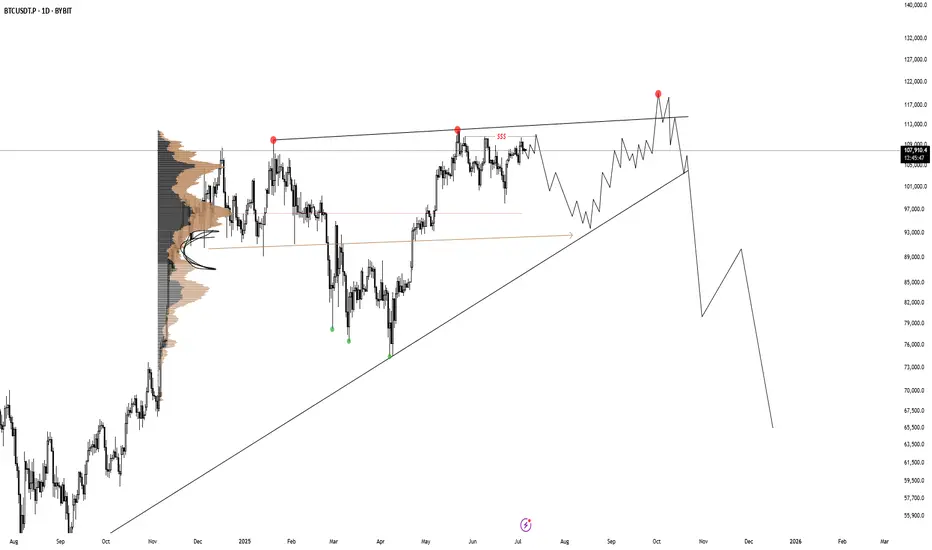
BTC HTF Distribution V2This is still the main scenario I'm looking for until it's invalidated. A build up like this, followed by a fake breakout out of this rising wedge as 3rd tap would be perfect.
Trading plan for BitcoinLast week, price action followed our bullish (green) scenario perfectly. Currently, the chart shows a clearly defined narrowing triangle. A breakout of the trendline will confirm the next directional move. We still have potential for new ATHs, though a corrective pullback might come first. More details in the video itself - enjoy watching!
As always, manage your risk wisely.

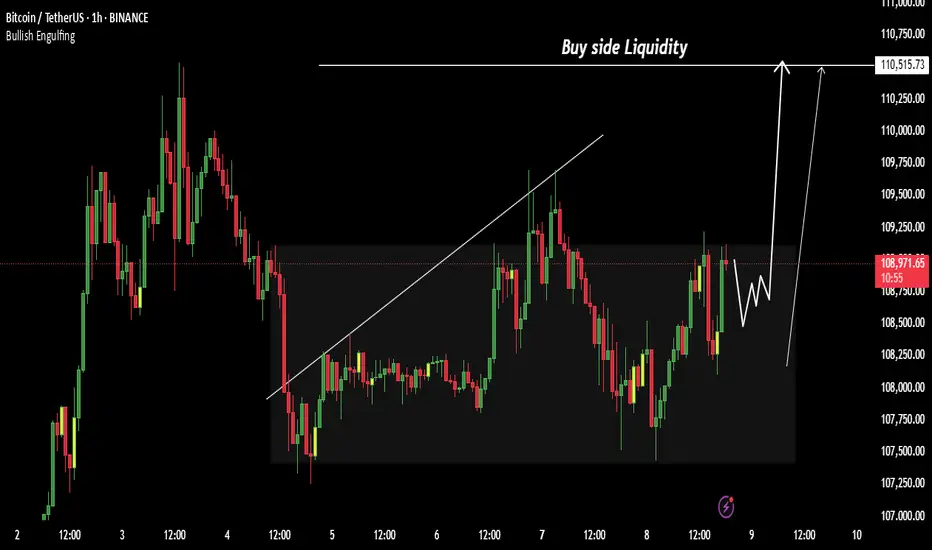
Lingrid | BTCUSDT Short-Term Bullish Momentum The price perfectly fulfilled my last idea . BINANCE:BTCUSDT continues to trade within a strong upward channel, supported by consecutive higher highs and an ascending trendline. After breaking above the range near $108,200, price briefly peaked above $110,000 before pulling back to retest the mid-support zone. Current action shows a rebound from the upward trendline, suggesting buyers are preparing for another leg up toward $110,500 and possibly the $112,000 resistance zone.
📈 Key Levels
Buy zone: around 108,000 or below
Sell trigger: break below 107,000 with close under channel
Target: 110,500 – midpoint resistance, followed by 112,000
Buy trigger: bounce from trendline and reclaim of 109,000
💡 Risks
Weak rebound could signal range re-entry and stall upside
Break below the trendline may shift bias to 105,000
Multiple rejections near 110,000 could indicate topping pressure
If this idea resonates with you or you have your own opinion, traders, hit the comments. I’m excited to read your thoughts!

Where Can Bitcoin Go? Part 8 –(MASSIVE 'Resistance or Breakout')🚀📊 Where Can Bitcoin Go? Part 8 – The Final Test is Near! 🔥🔍
Welcome to Part 8 of “Where Can Bitcoin Go?” – the update of this long-running series. Since mid-2023, not much has changed in the structure. That’s the power of solid technical analysis – levels don’t lie.
🟨 The Setup
Bitcoin is now approaching a third test of a major structural resistance. If you’ve followed my 1-2-3 strategy, you know this is where decisions are made:
✅ Test 1: Rejection
✅ Test 2: Rejection
⏳ Test 3: Now pending… the TERMINAL and DECISIVE 'Breakout or Rejection', and this will change everything.
But here’s the deeper layer:
We’re not just testing one sequence. We now have two separate sets of 1-2 rejections —
🔹 One set from 2021 (the Red 1 and 2)
🔹 And a recent one in 2025 (the white 1 and 2)
This upcoming test is the third rejection attempt on both timeframes, making it a rare and extremely significant technical moment.
📐 Price is now near a critical ascending trendline around $115K–$116K, which has been the gatekeeper to parabolic moves in previous cycles.
🔄 Based on historical halving cycles:
548 days post-halving in 2016 → ATH 2017
565 days post-halving in 2020 → ATH 2021
Halving #4 was in April 2024 → 👀 Could this point to a new ATH by end of 2025?
📊 Probabilities
🔹 83% chance we see the third test before year-end
🔹 57% chance of breakout
🔻 43% chance of rejection
⚠️ And here’s the reality check:
If we see that breakout — the market unleashes itself. We’re talking major pumps, potential follow-through moves, and price discovery into untouched zones like $188K, $197K, and beyond.
But... if we get rejected, it won’t be pretty. We could retest major levels like $66K or worse, and lose momentum that took years to build.
And unfortunately — this isn’t like 18K, or 40K, or even the 79K retest.
Things are much more complicated now.
The sentiment, the structure, the risk profile — they’ve all evolved. We cannot afford to have the same blind bullishness we had in those earlier phases. This is a mature part of the cycle, and it demands discipline over emotion.
💬 What’s your take?
Will Bitcoin finally break through?
Is this just another fakeout in disguise?
Are you feeling this same tension in the market?
Let’s talk structure. Let’s talk price. Let’s talk reality.
One Love,
The FXPROFESSOR 💙
Disclosure: I am happy to be part of the Trade Nation's Influencer program and receive a monthly fee for using their TradingView charts in my analysis. Awesome broker, where the trader really comes first! 🌟🤝📈
