The Critical Blue Line – Will Bitcoin Soar or Sink
🔹 Bitcoin Technical Analysis – Key Blue Line, Bear Trap Possibility & Long-Term Scenario
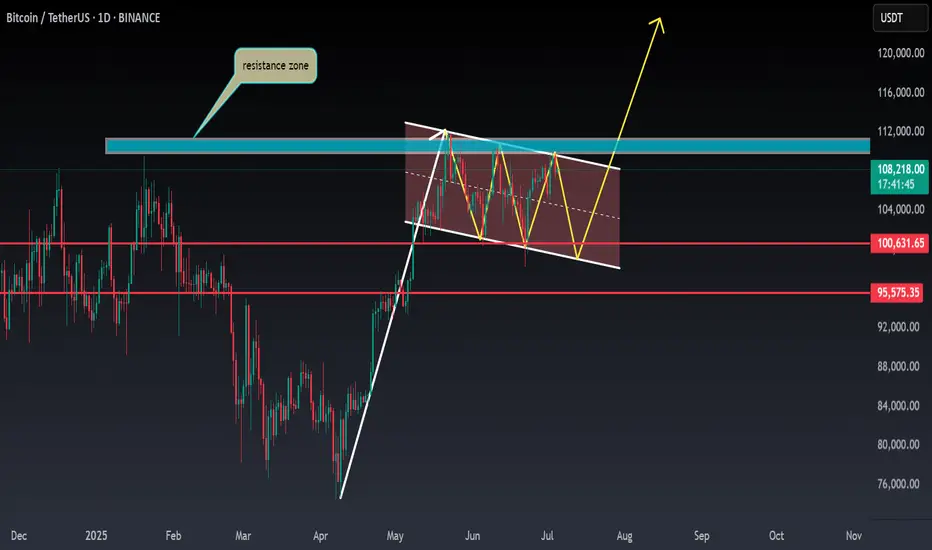
On the Bitcoin chart, the blue horizontal level has acted multiple times as both support and resistance. The price has broken it several times but failed to sustain above, indicating high-volume decision-making zones by institutions and large players.
📉 Why this pattern keeps repeating:
Strong supply and demand concentration at this level.
Inability to break and hold shows market indecision.
Repeated fakeouts are likely used to shake out weak hands.
🔍 Important hidden scenario: Bear Trap Potential
If the price dips below the blue line but quickly reclaims it, it may form a bear trap, tricking short sellers into entering prematurely. This move could ignite strong bullish momentum from trapped sellers and renewed buyers.
🔮 If price holds above the blue line:
Signals market strength and potential bullish structure shift.
Targets:
109,800
117,200
120,000+ (Long-term)
📛 If support fails again:
Retracement toward the lower channel near 101,000 or lower is possible.
📊 Conclusion:
This zone is one of the most critical decision points in the current market. Traders should combine volume, candlestick behavior, and confirmation signals to avoid getting trapped by fake breaks
BTCDOWNUSDT trade ideas

BTC ANALYSIS🌸#BTC Analysis : Bullish Trend 🚀🚀
🚀As we can see that there is a formation of Flag & Pole Pattern in #BTC in daily time frame. Right now we can see that #BTC again retest from the resistance zone and we can see a bounce back from its support zone 💪
🔖 Current Price: $1,08,050
⏳ Target Price: $1,20,000
⁉️ What to do?
- We can trade according to the #BTC chart and make some profits. Keep your eyes on chart price action, observe trading volume. Always observe market sentiments and update yourself everyday.🔰🔰
#BTC #Cryptocurrency #Breakout #TechnicalAnalysis #DYOR
BITCOIN ATH? More to come!With BTC seeing a new ATH, speculations are there for whether it continues in upward projection or falls back.
My prediction is simple, CRYPTOCAP:BTC will do a temporary pullback around the 109,000$ region and goes back up to around 113,000$ within the shortest time.
This temporarily pullback will be a result of buyers who already took their profits. Of course, Institutional investors are even more poised to buying more.
News may impact this projection but investors are willing to see it fly.
Ultimately, you can never go wrong with Bitcoin buy.
#DYOR #NFA
BTC Flag Pattern's Target @ 145,XXX $ [10/07/2025]🚀 BTC Breakout from Flag Pattern: Aiming for $145,000!
Bitcoin has just broken out of a textbook Flag Pattern, a bullish continuation signal that suggests the rally is far from over. Traders jumped in as price pierced through resistance with rising volume—classic breakout behavior. Stop-loss placed below the flag, profit target measured from the flagpole... all signs point to upward momentum.
🎯 Target? $145,000.
🔥 The rocket has launched, and it's not looking back. Fasten your seatbelt and cheer it on—let’s go, BTC! Make that flag fly high and beyond! 🤑🚀

BTC - PATH to 110.5KSOO the Liquid moves or news moves made it ecstatic and so is the top move, close below 107,990 in 1H will nullify this, else yet another squeeze coming!

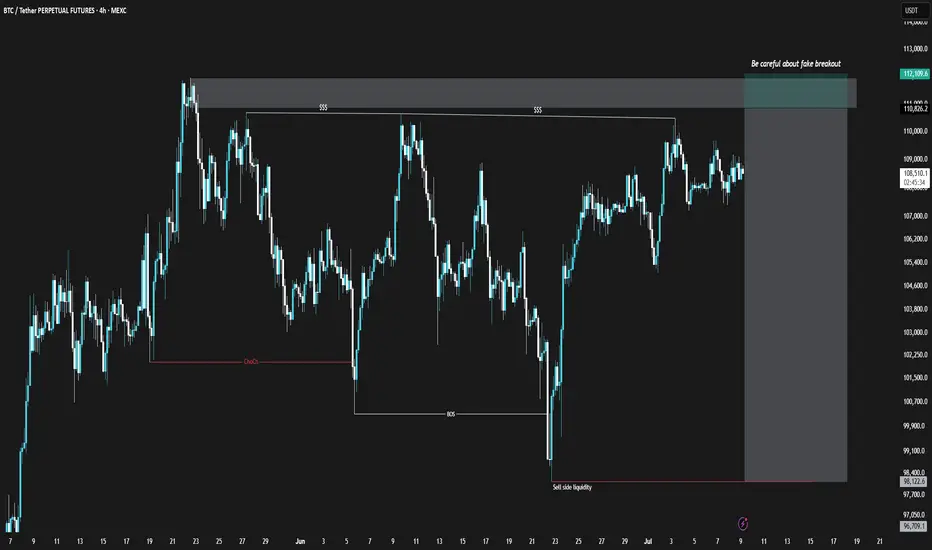
BTCUSDT Short Position (25/Jul/9)Bitcoin, similar to the TOTAL chart, is showing weakness in its bullish momentum. However, unlike TOTAL, the divergence in Bitcoin is clearly noticeable. Additionally, within the marked zone on the Bitcoin chart, there is a possibility of a fake breakout and liquidity grab. I suggest entering only with proper confirmation.
⚠️ This Analysis will be updated ...
👤 Sadegh Ahmadi: GPTradersHub
📅 2025.Jul.9
⚠️(DYOR)
❤️ If you apperciate my work , Please like and comment , It Keeps me motivated to do better
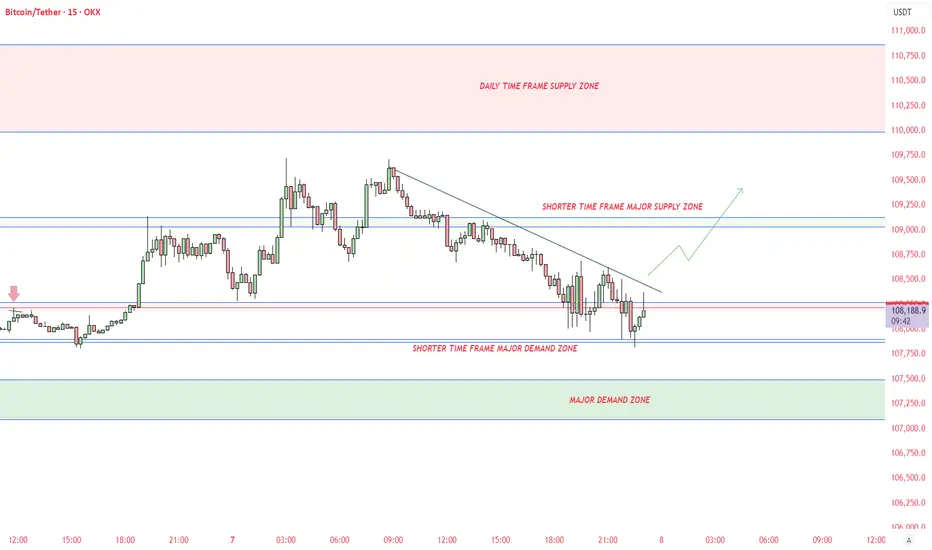
BTCUSDT - MOSTLY UPTREND DIRECTIONAll supply demand zone identified.
May breach till 110000$. Please do your own research before taking any trades
BTCUSDTWait for breaked ATH for 115K target.
BINANCE:BTCUSDT.P
Now price is in two level trading renge but come entry volume of buyers.

07/07/25 Weekly OutlookLast weeks high: $110,529.95
Last weeks low: $105,108.81
Midpoint: $107,819.38
The "Big Beautiful Bill" was signed into law last week on the 4th July, a huge event in the financial world and undoubtedly the world of crypto. The debt ceiling is now instantly raised by $5T making risk-on assets even more appealing than ever, incoming demand shock will likely help BTC but also the struggling altcoin market as well.
Last week the BTC ETFs saw a net inflow of $294m. This takes the total 30-day inflows to nearly 50K BTC and this is before the big beautiful bill was passed. PA wise, BTC is still struggling to break the $110k level and flip ATH, however the consolidation just under ATH with increasingly shallow pullbacks suggests a run at the highs is in the near future IMO.
For this week US CPI & PPI data are the important release for the week. It's hard to tell if the data releases will actually provide any volatility this time around, they usually do but the FEDs refusal to act has made the last few CPIs very flat in terms of volatility for BTC.
Key battleground for me this week would be the midpoint, clearly last week provided good support, however a larger area of inefficiency rest just under that it so there is a natural pull for price to revisit those areas. Could be a choppy week once again...
Good luck this week everybody!

BTC Correction's 📉 Significant Bitcoin Correction During Uptrend
After a strong bullish rally, Bitcoin has entered a correction phase, retracing nearly 25% of its recent gains. Interestingly, this correction aligns exactly with the 200-period moving average on the 4-hour chart, marking a potential key support level.
🔍 Is Bitcoin’s Correction Over or Just Beginning?
The overlap with the 200 MA could signal the end of the correction, but if this zone fails to hold, deeper targets between the 35% and 75% retracement levels may come into play.
🛡️ Potential Support Levels for Bitcoin if the Correction Continues:
First support: 102,200 USD – 25% correction
Second support: 93,200 USD – 35% correction
Third support: 84,100 USD – 50% correction
Fourth support: 74,600 USD – 75% correction

Trading plan for BitcoinLast week, price action followed our bullish (green) scenario perfectly. Currently, the chart shows a clearly defined narrowing triangle. A breakout of the trendline will confirm the next directional move. We still have potential for new ATHs, though a corrective pullback might come first. More details in the video itself - enjoy watching!
As always, manage your risk wisely.

Bitcoin Bullish Flag Breakout Incoming?MARKETSCOM:BITCOIN is currently consolidating within a bullish flag pattern on the daily chart, following a strong impulse move from the $74,000 support zone marked in April. The price is hovering near a critical horizontal resistance zone ($ 108,000–$ 109,000), which has historically acted as a major barrier to further gains.
Technical Highlights:
Bullish Flag Pattern: Clear flag formation after a strong uptrend, suggesting continuation potential.
Strong Support Rebound: April's bounce from the ~$74K support zone marked a key higher low.
EMA: Price is currently trading above both the 50-day and 100-day EMAs — a bullish sign of momentum.
Breakout Potential: A confirmed breakout above the flag resistance (~$109K) could ignite a strong rally toward $130K+.
Breakout Move: If the flag pattern plays out, CRYPTOCAP:BTC could target the $125K–$135K zone in the coming weeks.
Buy Entry: Once the day candle closes above the flag resistance line

#BTCUSDTbearish side of the btc is slow, as the volume of sell is not that high...…any strategy doesn't fit the lower low, i am seeing btc to the 132k.
anyone overthere with a new different strategy regarding btc?

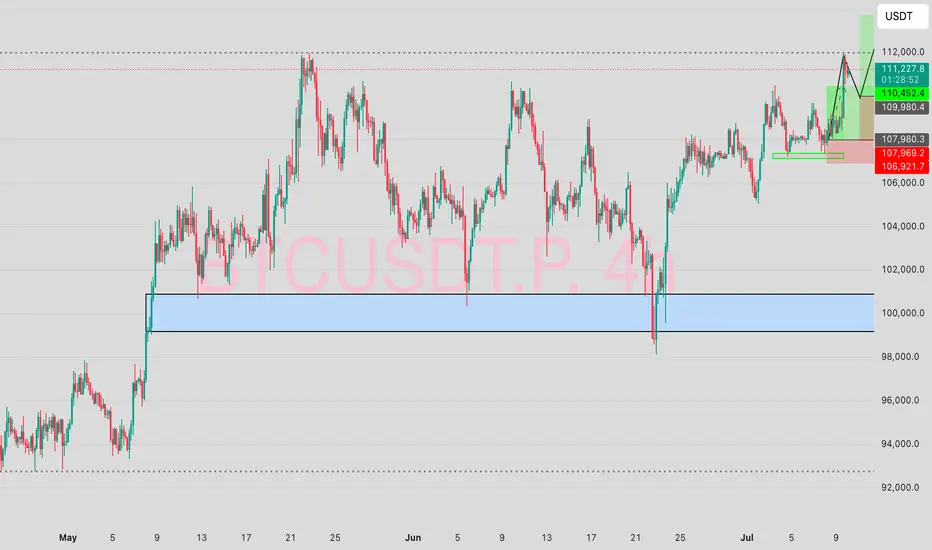
Bitcoin Eyes $112K, Liquidity Magnet AheadCRYPTOCAP:BTC Eyeing Breakout?
Bitcoin is consolidating tightly between 107.7K and 108.3K after a strong bounce from local support.
Short-term support has formed near 107.7K, but there's still liquidity below ~106.5K that may get swept before the next move.
If BTC holds above 107.5K and breaks 108.3K cleanly, we could see a quick move toward the $110.6k – $112K liquidation zone, with ATH in sight.
According to HTF, we need a daily close above 110k to confirm it in the HTF.
The market remains bullish unless 106K fails.
Will the magnet zone pull us higher?
Like & follow for more sharp updates.
DYOR. NFA
CRYPTOCAP:BTC BITSTAMP:BTCUSD BINANCE:BTCUSDT

Lower time frameI've shared an analysis from a lower time frame, that could indicate the start of a big move.

Bitcoin (BTC): Buyers Are Building Up The Volume | Be ReadyBuyers are still holding strong where price is not showing any signs of weakness. With that being said, we are seeing the volume gathering near the current zone, which might result in a breakout and a strong upwards movement.
A new ATH is coming; this has been seen already once on the BTC, so it is just a repeat of history.
Swallow Academy

A bearish 12 Month candle could be in the cardsBitcoin made an yearly high of 20% after 6 months in on the yearly candle
This does not make me feel great about the rest of the year
a clear sell signal would be an higher timeframe close under 100k after an upthrust to new ath around 110k - 120k
around 50k-54k for me is an good buy level to build an longterm position:
0.382 fib retracement for an primary 1-2 wave
0.500 fib retracement from the 25k low
0.886 fib retracement from 49k low
50% pullback from current high to projected low
where will bitcoin go ? i don't know, but i do know where i want to buy and when i want to sell


BTC - Will the Bearish Channel continue?Market Context
After a strong impulsive rally earlier in the year, BTC has been trading within a descending channel on the daily timeframe. This corrective structure suggests a period of consolidation and redistribution, as price oscillates between the channel's boundaries. The repeated rejection from the upper trendline and the inability to break through key highs reinforce the bearish bias in this structure.
Buy Side Liquidity Sweep Potential
Price is currently positioned just beneath a relatively clean swing high, sitting above the mid-range of the channel. This high represents a clear area of Buy Side Liquidity—stop losses from short positions and pending breakout orders from longs are likely clustered there. An engineered sweep of this high would serve as a strategic move for larger participants to collect liquidity before driving price lower.
Fair Value Gap as a Pivot Point
Beneath current price lies a Fair Value Gap—a visible inefficiency formed during a fast upward move earlier in the structure. This Gap remains unfilled and offers a compelling target for price once the Buy Side Liquidity Sweep occurs. It represents a logical zone for price to rebalance before deciding on continuation or reversal. Should price break below the Gap cleanly, it would confirm the bearish intent and potentially accelerate toward the lower bounds of the channel.
Channel Continuation Structure
The overall geometry of the channel remains intact, and the price respecting both upper and lower boundaries strengthens the likelihood of a continuation toward the downside. If the Buy Side Liquidity Sweep and subsequent rejection occur, the market could be poised for another leg lower—possibly seeking the next structural support closer to 90,000 or even toward the lower extremities of the channel around 80,000–82,000.
Final Thoughts
This chart reflects classic price delivery behavior: corrective structure, engineered liquidity sweeps, and the magnetic pull of inefficiencies like Fair Value Gaps. Whether you’re actively trading or simply observing, this is a clean, educational setup to learn from.
If this breakdown helped you see the market a bit clearer, I’d really appreciate a like. And feel free to share your thoughts or counterviews in the comments—your insights make the analysis even more valuable.

Bitcoin Recovers Above 105,000, Extremely Bullish +AltcoinsBitcoin produced only two days red, a bear-trap, and is now trading daily back above $107,000, an extremely bullish development.
Good morning my fellow Cryptocurrency trader, I hope you are having wonderful day.
The altcoins market bull market is confirmed and what Bitcoin is currently doing gives further strength to the bullish case and bias. It will be only a matter of days before the entire altcoins market turns strongly bullish with major momentum.
The range is still valid though, $100,000 - $110,000. But this time around the upper-boundary is likely to break and the last ATH tested, a new all-time high is even possible and also highly probable which is what will propelled the altcoins to hit multi-year highs and some even new all-time highs. Many pairs will move ahead.
With each passing day, the Cryptocurrency market will continue to heat up. We can expect growth long-term.
The 2025 bullish cycle started with the 7-April market low. The start of the third wave started 22-June and should go for 2-3 months. Then we will have a correction, the fourth wave followed by one final jump, the fifth wave.
We can expect growth now and all through late 2025. The entire period will be bullish. Only when the marketwide correction comes there will be a pause but many pairs will grow even at this point.
Choose wisely. Low risk vs high potential for reward.
Aim high. Focus on the long-term.
Thanks a lot for your continued support.
Namaste.

Bitcoin sell short bigBitcoin is ready to fill the big gap and the biggest liquidity, the range of 25,000 and 19,000 can be a good time to buy Bitcoin.

BTCUSDT – Accumulation Confirmed? Wyckoff Blueprint Playing Out Bitcoin continues to compress inside a defined range, resting above both a rising trendline and a former resistance turned support zone. This structure fits cleanly within a Wyckoff-style Accumulation Phase (B-C).
We’re now at a critical moment where smart money may be absorbing supply, preparing for the next phase.
🔍 Key Observations:
Range-bound price action with higher lows and muted volume
Spring-like wick and recovery from the bottom of the range
Support holding at prior breakout zone and ascending trendline
Structure shows signs of stealth accumulation with a possible breakout ahead
Sideways movement with fading volatility
Gradual compression within the range
Strong support defended multiple times (might make the support weaker as well !)
A potential spring/retest event may already be in play
You’ll see fakeouts, wicks, and hesitation in this phase — designed to trap weak hands. But the underlying behavior points to preparation, not distribution.
The quiet before the markup. Let the market reveal its hand. 📈

BitcoinHello everyone, I have a opinion about bitcoin chart I analyzed bitcoin chart at monthly timeframe and it obviously related to Elliot waves and I combined it with price action and I extract some good information about Price Road of bitcoin so in my opinion bitcoin going to decrease and I show that on chart how bitcoin price will be behave.
Have a good trade
