BTC/USDT Trade Setup – Lord MEDZStrategy: Goldbach Fair Value Gap + Smart Money Concepts (SMC)
Timeframe: 6H
Bias: Long
Trade Parameters
Entry: 102,577
Stop Loss: 99,527
Take Profit: 118,153
Risk to Reward: Approximately 5:1
Confluences and Justification
Price is expected to retrace into a clear Fair Value Gap (FVG) formed after displacement, aligning with the Goldbach model.
The structure confirms a completed reaccumulation phase, presenting a high-probability long setup.
This would complete the right shoulder of the classic inverse head and shoulders pattern, with the shoulder projected to dip into the POI. Head and shoulders patterns are often manifestations of Wyckoff accumulation or distribution phases, for those who may not be aware.
Liquidity left inside the gap provides inducement, increasing the likelihood of a sweep into the 102.5K zone.
The take-profit target at 118,153 aligns with the high of the Goldbach Fibonacci extension level.
Execution Plan
Wait for price to return to the FVG zone around 102,577. Look for confirmation such as a bullish displacement candle, a lower time frame BOS (break of structure), or mitigation of a lower time frame order block. Upon confirmation, execute long with a stop below 99,527. Take profit is set at 118,153.
Final Note from Lord MEDZ
"I await the return of price to imbalance. The reaccumulation is complete, and the alignment is clear. Entry shall be taken where inefficiency remains, and profit shall be claimed where liquidity awaits."
BTCDOWNUSDT trade ideas

HolderStat┆BTCUSD fixed above the triangleBINANCE:BTCUSDT is rebounding from a consolidation base at $106,000 with strong bullish structure. The triangle breakout and recent higher lows point toward a move to $115,000–$120,000 if momentum continues.

Bullish on BTC Here is a clean, professional analysis of your BTCUSDT 1D chart:
---
1️⃣ Chart Context
Pair: BTCUSDT.P (Perpetual Futures)
Timeframe: Daily
Current Price: ~111,350
Chart Type: Breakout and projection mapping
Key Levels Marked:
Resistance zone: 134,989 – 140,087
Support trendline (yellow): Ascending from March low
Local horizontal support (yellow): ~104,000 region
---
2️⃣ Structure Analysis
🔹 Trend
BTC is in a strong uptrend with higher highs and higher lows since March 2025.
A breakout from a flag/pennant pattern has recently occurred, signaling continuation.
🔹 Support & Resistance
Current resistance zone (~111,000–113,000): Price is testing this zone.
Major resistance zone (134,989 – 140,087): Strong supply zone for future targets.
Trendline support: Acts as dynamic support, currently near 100,000, rising weekly.
---
3️⃣ Price Action
A clean breakout candle is seen above the consolidation.
Retest of breakout zone possible (~108,000 – 110,000) before continuation.
A measured move aligns with a potential target to 135,000–140,000.
---
4️⃣ Projection Plan
Based on my white projection arrow: ✅ Base scenario: Price breaks above the local consolidation cleanly and heads toward 135,000–140,000. ✅ Retest of the breakout zone may occur to grab liquidity before the push. ✅ If price closes above 113,000 on a daily, momentum confirmation for the run is strong.
5️⃣ Trade Plan (Not Financial Advice)
Entry: On breakout confirmation above 113,000 or retest near 108,000–110,000 with bullish confirmation.
Target: 134,989 and partial close, then 140,087 final target.
Stop Loss: Below local support (yellow line) near 104,000 or trendline depending on risk appetite.
Risk Management: Size positions to risk max 1–2% per trade.
6️⃣ Potential Risks
⚠️ Global macroeconomic conditions or sudden BTC volatility. ⚠️ Fake breakout wicks trapping longs above 113,000. ⚠️ Daily close below 104,000 would invalidate bullish structure in the near term.
Summary
BTCUSDT is in a bullish continuation structure aiming for 135–140K.
Price is currently at a critical breakout level; a clear close above and retest would be optimal.
Manage risks with clear invalidation below 104,000

BTC/USDT 4H – High-Probability Decision Point Ahead Bitcoin is currently retesting a confluence-rich zone — a textbook decision area where structure meets sentiment.
🔻 What’s in play?
🟥 Demand Zone / Bullish Order Block / Breaker Block (visible on 1H)
📈 Third-touch test of the ascending trendline – statistically known to trigger strong moves
⚪ Price sitting just above the 200 EMA acting as dynamic support
🧱 Prior resistance flipped to support — now being validated again
Despite the correction, structure remains intact. This is a healthy retracement unless price starts closing below trendline + zone with volume.
🔀 Possible Outcomes:
Bounce: If buyers step in here, this could mark the next leg in the uptrend.
Breakdown: A strong close below the zone/trendline could shift structure and sentiment bearish.
⚠️ No trade bias here — let price show its hand.
💬 What’s your view — bounce or break? Comment below!
✍️ Chart marked with structure logic only — not financial advice.

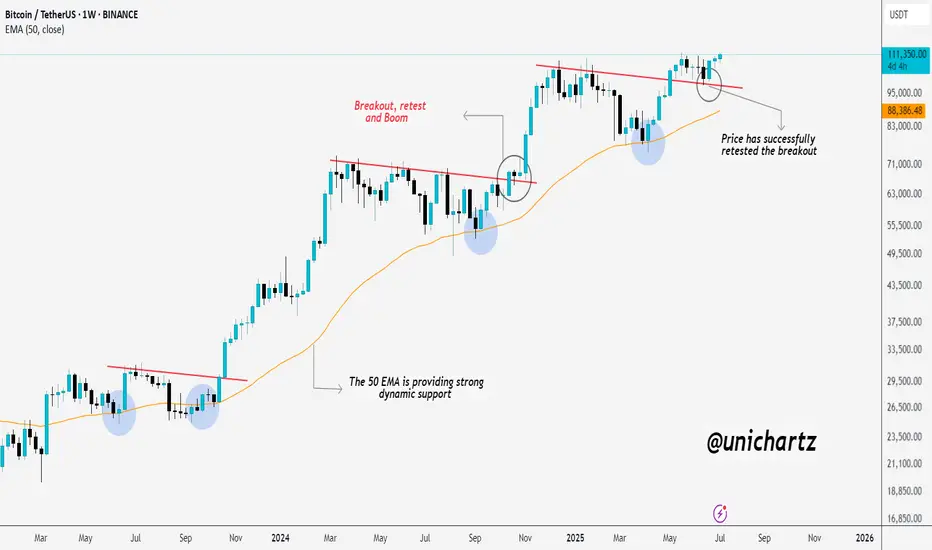
50 EMA Magic: Bitcoin Explodes After Perfect Retest!CRYPTOCAP:BTC just made a new All-Time High (ATH) — exactly as mentioned!
It broke out, retested perfectly, and blasted off.
The 50 EMA is acting like a rocket launchpad, giving price solid support every time.

BTC up following H1 trend linePlan BTC today: 07 July 2025
Related Information:!!!
Bitcoin (BTC) trades slightly below $109,000 at the time of writing on Monday, following its highest weekly close on record. Institutional and corporate demand continues to serve as a key catalyst, with Metaplanet acquiring an additional 2,205 BTC on Monday, while US-listed spot Bitcoin Exchange Traded Funds (ETFs) saw over $769 million in net inflows last week.
As market participants assess the latest bullish indicators, focus now shifts to broader macroeconomic developments, including new trade-related headlines and reports suggesting that the administration of US President Donald Trump may extend the current tariff pause until August 1.
personal opinion:!!!
BTC moves sideways in the trend line, trend line support 108,300
Important price zone to consider :!!!
support zone : 108.300
Sustainable trading to beat the market

Bitcoin (BTC): Targeting $120K | Buyers Showing DominanceBitcoin is hovering still in between the old ATH area and the new, entering into a consolidation zone, which might be our breaking point.
Last week we saw the buyside dominance, which was backed by big institutions buy orders and short-term traders selling assets, giving us a sign of a potential bullish breakout—that's what we are looking for, a proper breakout from local resistance, which would then send the price towards our first target of $120K.
Swallow Academy

BTC - Drooling for 110K!So my acc was banned for a day and Im soo back! So i feel if it stays sideways for the orange line what we want, looks really good to take 110k to 110,202! breaks below orange line goes to red, stances - GETS CHANGED!

Bitcoin Elliott WaveI am currently short Bitcoin and I think the top is in
With this post, I am expressing my thoughts on where Elliott Wave stands per my perspective
In addition, I am also tracking Pitchfork of proposed wave 1 and 2. Getting out of that default pitchfork (if we drop this hard) will likely indicate that my bearishness is correct and we are in wave 3 potentially, which indicates bear market
My short position is open both on Ethereum and Bitcoin

BTCUSDT: Positive CDV Divergence for Potential Long Setups• Market Overview: Bitcoin currently sits at a pivotal point. Although the price movement has been somewhat indecisive, we’re watching closely for signs of bullish momentum.
• CDV Divergence Focus: Our attention is on a potential positive Cumulative Volume Delta (CDV) divergence. This takes shape when the price makes a lower low but CDV registers a higher low (regular bullish divergence), or when the price posts a higher low and CDV shows a lower low (hidden bullish divergence). These patterns can hint at growing buying interest even if price action hasn’t caught up yet.
• Support Zones (Blue Boxes): The highlighted blue zones on the chart signal potential support levels where buyers may step in. These are mapped from prior demand areas or structural support points.
• Trade Setup: Should a confirmed positive CDV divergence appear near or inside one of these blue zones, it could offer a strong case for a long entry. This would suggest that while the price may look weak, buying strength is quietly building underneath.
• Managing Risk: Any long entry must be accompanied by a well-defined invalidation level—typically just below the blue box support or the lowest point of the divergence.
Disclaimer: This is a technical pattern-based analysis intended for informational purposes only. Trading involves risk. Always perform your own due diligence and assess your risk appetite before entering any trades.

bitcoin in 1hour timeframeIn line with the previous analysis, the likely path for Bitcoin on the one-hour timeframe looks like this...follow for more...
bitcoin targets...Based on the patterns and price movements in Bitcoin, I have identified possible targets in the image.
The Pattern That Could Launch Bitcoin, pt. 2There appears to be an IH&S pattern forming inside of the larger IH&S's right shoulder (see my previous post for the larger one). I've seen this happen a few times and then a break out upwards! Results may vary of course lol.
If it drops from here support could be at around $102k and then $100,500.

BTCUSDTThe Bitcoin market is overbought. I expect a change in trend. A diamond with traders' stop points will be great as a reversal pattern. Let's see

All Binance Coins Watchlist 2025 JULY If you want to create a full list of all coins from the exchange you use, you can:
1. Go to Screeners
2. Set these filters:
a. Exchange (eg. Binance)
b. Quote currency - USDT
c. Symbol type - Perpetual
3. Keep Scrolling till the end of the list so that all coins are populated. There should be about 400+ coins.
4. Select one of the coins, then click Ctrl A to select all.
5. Right click > Add to an existing Watchlist or Create a new watchlist.
Here's my list i created on 4th July 2025. You can import it if you want.
www.tradingview.com

BTC/USD SCENARIO Bitcoin is trying to break out of the 110,000
If we break out we will see a new high
If we don’t break it we could see 105k possibly 100k
BTC LETS RETRY AGAINBINANCE:BTCUSDT.P Is gathering Bullish momentum again to try going war against that resistance. On this short video, i explained the reason why im looking to buy btc, Both entry and exist are on the video. Good luck to us all.

(BTC/USDT).- Bitcoin (BTC/USDT) .
- Current price testing resistance at $110,489.
- Descending trendline indicates potential bearish pressure.
- Key support levels: $107,466, $105,000, $102,693.
- Potential upside target: $112,500 if resistance breaks.
- Potential downside target: $100,000 if support fails.

BTC-USDT Market Analysis for the Last 24 Hours
Hello, crypto enthusiast! 👋 Let’s see what has been happening with Bitcoin over the past 24 hours!
🔍 Price Action
Bitcoin dipped slightly during the day, sliding from ~108,970 USDT to a current price of about 108,166 USDT. That’s a decline of roughly 0.7 %—nothing too dramatic for the crypto market! 😉
📰 Hot News
• John Bollinger (renowned technical analyst) said that “Bitcoin is close to a breakout”; many analysts remain upbeat despite the small pullback.
• South Korea is seeing explosive crypto-market growth: total capitalization has topped $74.8 billion, and daily trading volume has reached $10.7 billion—higher than on the country’s two main stock exchanges!
• Fun fact: Korea’s well-known “kimchi premium” means crypto prices there can run about 10 % above global levels due to strong local demand. 🌶️
📊 Technical View
During the last 24 hours BTC traded between $107,393 and $109,048. Volumes were especially heavy from 21:00 to 22:00 on 7 July, when more than 100 million USDT changed hands.

BTCUSDT Forming Bullish WaveBTCUSDT is currently setting up a promising bullish wave pattern, showing signs of steady upward momentum that could deliver a healthy 10% to 20% gain in the near term. After a period of consolidation and healthy correction, Bitcoin’s price is starting to push above key resistance levels, indicating strong buying interest and renewed confidence among long-term investors and institutional traders alike. This setup has caught the attention of market participants looking to capitalize on Bitcoin’s next potential leg up.
Recent on-chain data and technical indicators show a robust foundation for this bullish wave pattern, with increasing trading volume supporting the upward move. Bitcoin continues to hold above crucial support zones, which adds further confidence for buyers aiming to ride the trend towards its next major psychological levels. The overall sentiment remains positive as Bitcoin’s dominance in the crypto market signals strength, helping to drive capital inflow from altcoins back into the king of crypto.
As we know, Bitcoin’s market behavior often sets the tone for the entire crypto ecosystem, so this bullish scenario could spill over into other major altcoins as well. Traders and investors should keep an eye on key resistance zones, potential breakout levels, and any sudden surges in volume that confirm the wave pattern is playing out as expected. Patience and disciplined risk management will be essential to maximizing profits during this phase.
✅ Show your support by hitting the like button and
✅ Leaving a comment below! (What is You opinion about this Coin)
Your feedback and engagement keep me inspired to share more insightful market analysis with you!

Bitcoin will Return all-time high Interestingly Bitcoin (BTC) has not been particularly impressive over the weekend, which has been a somewhat consistent theme of the cryptocurrency market so far in the year 2025. The premier cryptocurrency continues to hover around the $108,000 mark, showing signs of indecision amongst the investors.
Resistance zone 111K
Support zone 107K
The conversation has been about when the Bitcoin price will return to its all-time high. Interestingly, the latest on-chain data shows that investors are becoming increasingly confident in the long-term promise of the flagship cryptocurrency.
Hope you can understand all our chart Pattern According the Bitcoin analysis.
Thanks for your Support.
if you found this analysis share you Opinion in comments I'm Tankful from you.

Bitcoin BTC Trade Plan: Watching for Breakout or Pullback Entry📊 Currently watching BTC (Bitcoin) as price action remains bullish overall, but we're approaching a key decision point 🎯
💹 Price is pushing higher, but with some signs of exhaustion after the recent rally ⚠️ — and with the weekend approaching, we could either see a continuation higher or a healthy pullback
I’m keeping an eye on two potential trade scenarios:
1️⃣ A break and clean retest of the recent high, which could offer a continuation long if momentum follows through 🚀
2️⃣ A retracement into equilibrium — a deeper pullback toward fair value 📉 — which could also present a high-probability long setup if confirmed with structure and reaction 📈
Either way, I’m letting the market reveal its hand and waiting for one of these setups to play out before committing 💡
💬 Not financial advice — always assess your own risk and confirm with your own analysis.
