BTC BEARISH IDEAL HOT BTC bullish ideal, BTC buys where Sensational and i dont expect the sell to be les either me and my whole theam eat let get it with BTC
BTCDOWNUSDT trade ideas
Bitcoin: New highs are ready to break
In-depth analysis of the Bitcoin market: Breakthrough opportunities under the resonance of fundamentals and technical aspects
I. Overview of the current market situation
As of July 10, 2025, the price of Bitcoin is currently in a high consolidation stage after breaking through $112,000 to set a record high. The highest increase in 24 hours was 3%, and the cumulative increase this year was about 19%, showing a strong upward momentum2. However, market volatility is still significant. The latest data shows that the amount of liquidation in a single day is as high as $510 million, involving more than 100,000 traders2, reminding investors to maintain risk awareness in optimism.
II. Key drivers of fundamentals
1. Improved policy environment
US cryptocurrency regulation is turning to a loose direction. The regulatory roundtable promoted by the new SEC Chairman Paul Atkins is expected to implement new policies in July-August, aiming to define clear regulatory boundaries, reduce law enforcement actions, and promote the United States to become a global crypto asset center2. This policy shift has significantly boosted market confidence and removed some obstacles for institutional funds to enter the market.
2. Institutional funds continue to pour in
The net inflow of spot Bitcoin ETFs in 2025 has reached US$14.4 billion2, indicating that the traditional financial market's acceptance of Bitcoin continues to increase. 135 listed companies such as MicroStrategy have included Bitcoin in their balance sheets2, and corporate-level allocation demand has formed a stable buying support. The recent weaker-than-expected US employment data has strengthened the Fed's expectations of a rate cut in September, further prompting funds to accelerate the inflow of risky assets such as Bitcoin2.
3. Market narrative upgrade
The role of Bitcoin has shifted from "alternative currency" to "reserve asset", and CICC pointed out that its positioning as "digital gold" is widely accepted2. National-level allocation cases are also increasing, such as Pakistan's announcement of the establishment of a strategic Bitcoin reserve2. This narrative shift is reshaping the value assessment framework of Bitcoin.
4. Macroeconomic linkage
The Federal Reserve's monetary policy remains a key variable. Trump's chief adviser recently publicly accused Powell of being the "worst Federal Reserve chairman in history", saying that if interest rates are not cut on July 29, "catastrophic consequences"3 may occur3. At the same time, the US trade policy of imposing a 50% tariff on copper (to be implemented as early as August 1) has exacerbated market uncertainty3. Historical data shows that Bitcoin often performs well in liquidity easing cycles, and the current market's expectations for interest rate cuts are forming potential positives.
III. In-depth analysis of technical aspects
1. Key price structure
After breaking through the horizontal consolidation range, Bitcoin is currently in a high-level accumulation state:
Upper target: The historical high of $112,000 is the recent key psychological resistance, and a new upside space may be opened after breaking through2
Recent support: $110,700 (top and bottom conversion position) constitutes the first line of defense
Trend support: $109,700 (upward trend line) is an important line of defense for bulls
Key defense: There is significant liquidity support in the $108,500 area, and a break below may drop to the $106,000-107,200 support area26
2. Technical indicator signals
Trend indicators: Moving averages of all major time frames (5-day to 200-day) remain in a bullish arrangement, confirming that the overall upward trend remains unchanged4
Momentum indicators: RSI is in the neutral area near 53, not showing overbought; MACD remains positive despite slightly weakened momentum6
Volatility analysis: Bollinger Bands continue to narrow, and EMA on the 4-hour chart converges, which usually indicates that major fluctuations are coming5
Derivatives data: Binance CVD (cumulative volume increment) continues to be negative, indicating that selling pressure exists, but spot buyers successfully defend key support5
3. Main capital movement
The disk shows that $23 million of unfulfilled sell orders are piled up at the $110,000 mark, forming a significant resistance9. At the same time, there is a $17.27 million buy support in the $108,388-108,500 range9, indicating that the long and short sides are fiercely competing in the current area. This large order distribution pattern suggests that the market may test the upper resistance first and then fall back to consolidate.
IV. Operational strategy recommendations
1. Trend trading strategy
Long position layout: Establish long orders in batches in the support area of 110,700-109,700 US dollars, and set the stop loss below 108,500 US dollars
Breakthrough chasing long: If the price stands above 112,000 US dollars, you can add positions, and the target is 114,500 US dollars (potential area for short squeeze)2 and higher
Target setting: Short-term target is 112,000 US dollars, and the medium-term target can be seen to 116,000 US dollars2 or 137,000 US dollars4 according to the volume
2. Reversal trading strategy
Short opportunity: If it falls below $108,500 and then rebounds to $109,700 without breaking, you can try shorting with a light position, and set the stop loss above $110,700
Deep correction: If it falls below the $108,500 support, it may test the $106,000-107,200 area6, and then you can observe the stabilization signal
3. Risk management points
Position control: The risk of a single transaction should be controlled within 2% of the total funds
Leverage use: It is recommended not to exceed 3-5 times leverage in the current high volatility environment
Event sensitive period: Focus on key points such as the Federal Reserve’s interest rate decision on July 29 and the implementation of the tariff policy on August 137
V. Outlook and conclusion
1. Short-term (1-3 months) outlook
Bitcoin is currently in a favorable environment where technical and fundamental resonances occur. If ETF fund inflows continue or the Federal Reserve releases a clear signal of interest rate cuts, the price is expected to test $116,0002. However, we need to be alert that regulatory policies that fail to meet expectations or macroeconomic deterioration may lead to a pullback to the $102,000-105,000 support zone27.
2. Long-term (until 2030) value prospects
Cycle model: According to the peak rule of 550 days after halving, this round of bull market may have a 2-3 month peak window2
Technical target: Long-term rising channel points to $168,500 (Fibonacci extension level)2
Scarcity drive: After the halving in 2030, the supply will further shrink, coupled with the global inflation hedging demand, and the highest is expected to reach $660,4712
3. Summary of investment advice
Bitcoin's breakthrough of $112,000 is the comprehensive result of policy, liquidity and narrative upgrades2. The current technical structure remains bullish, and it is recommended to focus on low-multiple ideas, focusing on the $110,700-109,700 support area. Investors should pay attention to low-friction investment channels such as spot ETFs, avoid high leverage operations, and prepare for potential fluctuations. As the institutionalization process accelerates, Bitcoin is completing the transformation from a marginal asset to a mainstream configuration option. Long-term investors can seize the layout opportunities brought about by every major pullback.
DeGRAM | BTCUSD once again trading above $105k📊 Technical Analysis
● Fresh bounce off the confluence of the 8-month up-sloping purple trend-line and 102-103 k green demand box prints a higher-low inside the rising wedge, keeping bulls in control despite June’s pull-back.
● Price is reclaiming the minor down-trend line from the 12 Jun high; a daily close above 106 k confirms a bear-trap and unlocks the 111.8-112.5 k supply at the wedge cap.
💡 Fundamental Analysis
● Spot-ETF desks absorbed >5 400 BTC in the last three sessions while exchange reserves fell to a four-year low, signalling supply drain.
● Cooling US PCE expectations trimmed real yields, and Mt Gox repayment delays ease overhang fears—both supportive for risk assets.
✨ Summary
Long 102–104 k; hold above 106 k targets 111.8 k → 115 k. Bull thesis void on a 16 h close below 99 k.
-------------------
Share your opinion in the comments and support the idea with a like. Thanks for your support!

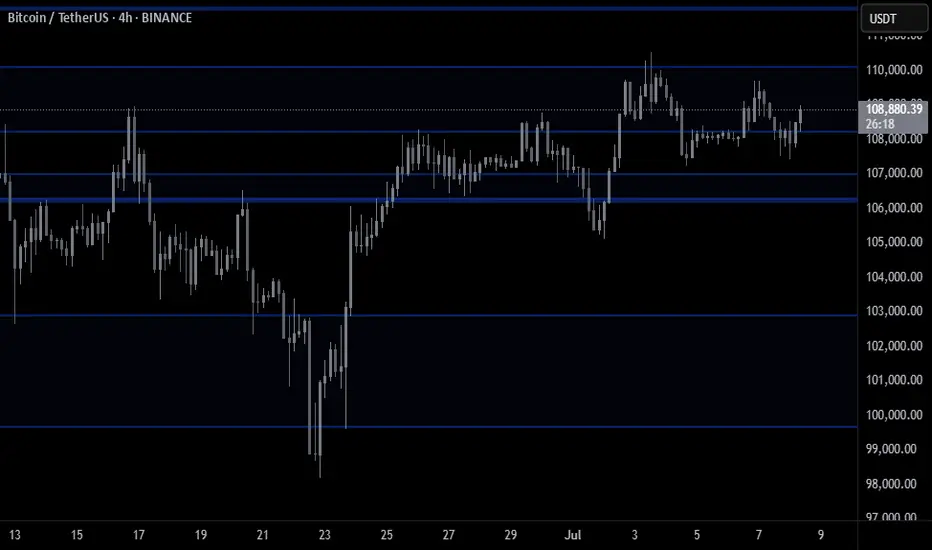
BTCUSDT – Calm Before the BreakoutBitcoin is holding firmly above the ascending trendline, consolidating within the accumulation range of $98,000 to $117,000. The current structure suggests that buyers remain in control, especially after a strong rebound from the $98,450 support zone.
In terms of news, BTC has been slightly affected by market concerns over new U.S. tariffs. However, on-chain data still shows strong accumulation around the $108,000 level. If this base holds, BTCUSDT could break out toward the $117,424 target in the near term. Conversely, if the trendline fails, the $98,000 level will be the final stronghold for the bulls.


Bitcoin scalp long back to $112,000 ATHTook a risky scalp long on bitcoin just now.
Aiming for $112000-$112720
1.44-2.78RR
Stop: $110670

BTC MTF AccumulationThis is the current accumulation model i am watching to bring BTC back to ATH's and form the second deviation of the HTF distribution model. I would prefer if we could go lower and form a range from there, but at the moment thats all i got.

SPXBank of America expects SPX to close 2025 near 6,300, with a 12‑month projection of 6,600. They note ongoing stagflation risks and do not expect rate cuts this year .

When will the media talk about BTC so I can SELL?!?!?!Waiting for the mainstream media to talk about BTC and the mass to buy bitcoin so I can sell my BTC LOL, I HAVE A WEDDING TO PAY!

[SeoVereign] BITCOIN Bearish Outlook – July 9, 2025We are the SeoVereign Trading Team.
With sharp insight and precise analysis, we regularly share trading ideas on Bitcoin and other major assets—always guided by structure, sentiment, and momentum.
🔔 Follow us to never miss a market update.
🚀 Boosts provide strong motivation and drive to the SeoVereign team.
--------------------------------------------------------------------------------------------------------
Hello.
This is SeoVereign.
As of July 9, 2025, I present a bullish outlook on Bitcoin.
This idea is an extension of the analysis posted on July 6.
Therefore, it will be easier to understand this analysis if you first read the July 6 idea.
The position reached the second target price and then showed a downward movement.
In this idea, harmonic 0.382 and 1.618 patterns have been additionally identified, and accordingly, I plan to continue holding the long position entered from the July 6 entry point.
The average target price has been set around 109,150 KRW.
I will continue to track the situation, clarify the rationale, and provide updates through this post.
Wishing you continued good fortune.
Sincerely,
SeoVereign

Bullish on $BTC🧠 Wyckoff Overview
🔻 This chart follows Accumulation Schematic #1 in Wyckoff theory.
🔻 The Spring phase (Phase C) is confirmed.
🔻 BTC has broken out from the accumulation zone.
🔻 We are now in Phase D, expecting a move into Phase E (new ATH).
📊 Technical Details
🔻 Accumulation zone: Around $72,000 – $88,000.
🔻 Spring (Phase C): A fakeout happened near $68,000, matching Wyckoff structure.
🔻 Breakout is confirmed after price moved above the downtrend line and Ichimoku cloud.
🔻 Main resistance: $95,000 – currently testing the supply zone.
🔻 Target: If breakout continues, BTC could reach a new ATH above $110,000.
📈 RSI and Volume
🔻 RSI at 66.71: Not overbought yet, still has room to go up.
🔻 Volume is increasing along with the breakout → shows strong buying pressure.
🎯 Personal Prediction
🔻 If BTC holds above $92,000 – $95,000 and continues to consolidate:
→ Short-term goal: $100,000
→ Mid-term goal (Wyckoff Phase E): $110,000 – $112,000

Bullish?This range looks like it wants to break to the upside. Maybe one more drop to 107.6K as a fakeout — but that remains to be seen.

Bitcoin overall: likely still headed down for time beingI expect a short move up followed by a bigger retracement. While I’d try a long at the lower indicated range, a move further, below it, is certainly possible.

BTCUSDTPreferably suitable for scalping and accurate as long as you watch carefully the price action with the drawn areas.
With your likes and comments, you give me enough energy to provide the best analysis on an ongoing basis.
And if you needed any analysis that was not on the page, you can ask me with a comment or a personal message.
Enjoy Trading ;)
Bitcoin (BTC): Bullish as Long as Buyers Hold EMAs | $112K Next?Bitcoin buyers have taken full control since bouncing from EMAs on the 2nd of July (where also our entry point was sitting last week).
Since then we have seen decent buyside dominance and we are looking for further pressure from buyers, which would result in a retest of the current ATH area, but keep in mind—we are in a very dangerous zone (near a new ATH where buyers are still showing dominance which is giving us a sign that this is not yet the full potential of the coin).
We are bullish as long as we are above the EMAs!
Swallow Academy

btc/usdtI think it's time for Bitcoin to grow. It doesn't matter what the news is. This time, Bitcoin and Tether's dominance have reached their peak and are ready to make Bitcoin grow. This is my analysis. What do you think?

BTC there was a limit seller yesterday 109700 BTC there was a limit seller yesterday 109700 . Today I'm looking at sales locally

Lingrid | BTCUSDT possible Channel Break - Upside Surge The price perfectly fulfilled my last idea . BINANCE:BTCUSDT is pulling back slightly after rejecting the descending red trendline near the 108,000 level, while remaining above the breakout zone around 105,000. The structure suggests a potential bullish continuation if the price holds this level and forms a higher low. A successful breakout above 108,000 could ignite a move toward the 111,000 resistance band.
📈 Key Levels
Buy zone: 105,000–105,300
Sell trigger: breakdown below 105,000
Target: 111,000
Buy trigger: breakout and retest above 108,000 with strong momentum
💡 Risks
Failure to hold 105,000 reopens path to 98,700
Bearish rejection at 108,000 could maintain lower high structure
Weak volume breakout may lead to a bull trap under 111,000
If this idea resonates with you or you have your own opinion, traders, hit the comments. I’m excited to read your thoughts!

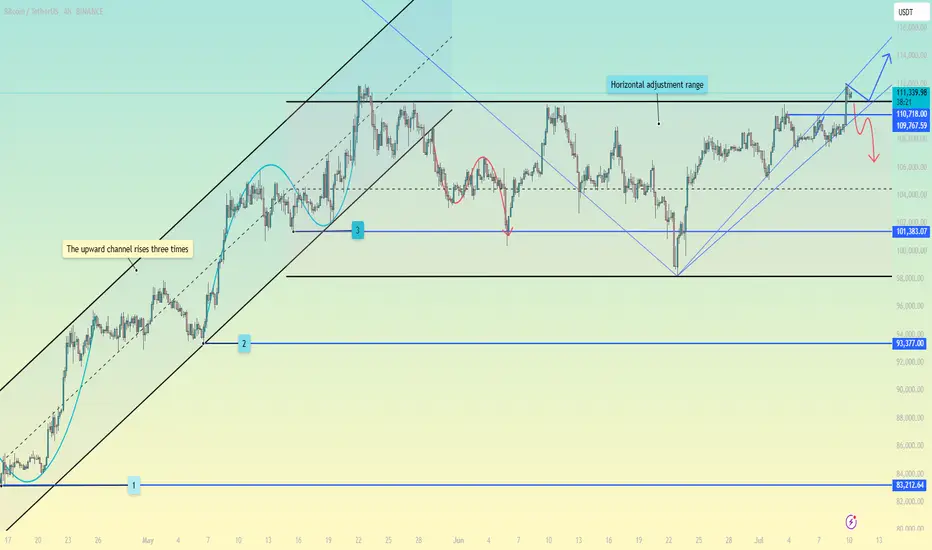
Can #BTC reach a new high?📊Can #BTC reach a new high?
🧠We cannot be too optimistic before we break through ATH, because the daily adjustment expectation still exists.
➡️We are currently in a heavy resistance area near 110,000. This is our third test. Regardless of whether we can successfully break through, don’t chase the rise here, because the cost-effectiveness is not high. If you want to go long, you should also wait patiently for the callback to occur before considering it. Or wait for the callback after breaking through ATH before considering it.
➡️If you want to participate in short trading, you can only participate in a small amount with ATH as a defensive point. Or wait for the rebound after breaking through the upward trend support line before participating.
🤜If you like my analysis, please like 💖 and share 💬
BITGET:BTCUSDT.P

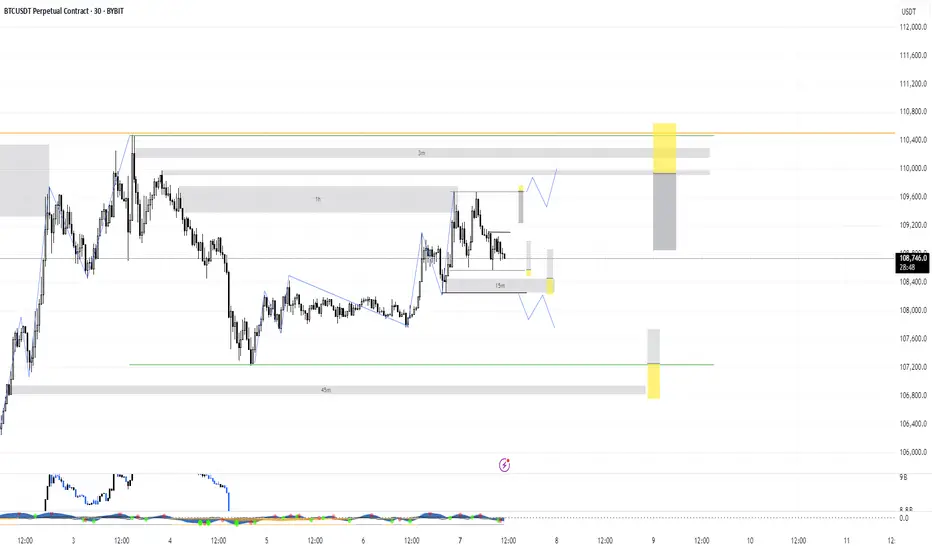
BTCUSDT | 30-min & 4H Outlook🔍 Structure & Price Action
BTC is trading within a rising wedge (blue lines) nearing apex — typical bearish setup.
Price is repeatedly getting rejected near macro trendline (~108.8K–109K).
30-min shows clean breakdown from lower wedge support, retesting the zone now.
On 4H, BTC is still under key resistance zone between 109.6K–110.4K, previously rejected twice.
🔻 Bearish Signals
Multiple Sell signals on both timeframes.
Bearish divergence visible in RSI and MACD on 4H.
Volume spike on the breakdown → confirming sellers in control.
🔑 Key Levels
Support: 107.7K (current zone) → loss opens path to 106.6K, then 104.4K.
Resistance: 108.9K–109.4K = confluence of EMA cluster + macro TL + Fib zone.
📊 Indicators (4H)
RSI dropping from mid-zone (~48), no bullish momentum
DMI shows increasing ADX with -DI over +DI → trend strengthening bearish
TSI & Wave Trend both curling down
Stochastic in overbought, starting to reverse
🎯 Summary
Bias: Bearish below 108.6K
Invalidation: Bullish breakout above 109.6K + volume close
Setup: Watch for retest and rejection at ~108.4K–108.6K = clean short trigger
Next Targets: 107.2K → 106.6K → 104.5K

TradeCityPro | Bitcoin Daily Analysis #119👋 Welcome to TradeCity Pro!
Let’s go over the analysis of Bitcoin and the key crypto indexes. As usual, in this analysis I’m going to review the futures triggers for the New York session.
⏳ 1-Hour Timeframe
Yesterday, the price broke out of the range box between 108619 and 110256 that I had marked for you, and with the heavy selling volume that entered the market, this bearish move took place.
✔️ This move continued to the 107448 zone, and as you can see, we are now in a consolidation and rest phase, and once again the volume has dropped significantly.
✨ As I mentioned in yesterday’s analysis, I believe this low volume will persist through the weekend, and for a solid move to happen, we’ll need to wait for the new week to begin.
💥 For now, the price has room to move up to 108619 and perform a retracement. A break above the 50 zone on the RSI greatly increases the likelihood of this move.
📊 If selling volume re-enters the market and the price moves downward, the short trigger we have is the 107448 level, and breaking it could start the next bearish leg.
📈 For a long position, the price must first stabilize above 108619, and then, if we see that buying volume continues and increases, we can enter a long position. The main trigger will be 110256.
⭐ I myself won’t be opening any positions for now and will wait until the market shows some proper volume and trend before entering. If you plan to open a position based on these triggers, I suggest you take on very little risk so that in case your stop-loss is hit, you don’t lose much money.
👑 BTC.D Analysis
Let’s look at Bitcoin dominance. Yesterday, dominance touched the trendline I had marked and is still dealing with this dynamic resistance.
💫 A bottom has formed at 65.38. If this bottom is broken, we’ll get confirmation of rejection from the trendline, and dominance could have a bearish move down to 65.04.
⚡️ If the trendline is broken instead, we’ll have a new trigger at 65.52, and breaking it would confirm a bullish reversal in dominance. The main trigger will still be a break of 65.64.
📅 Total2 Analysis
Now let’s move on to Total2. This index dropped to the 1.13 zone and has now pulled back to 1.14. It seems like it’s getting ready for another downward move.
☘️ If Bitcoin dominance gets rejected from the trendline and moves down, and if Bitcoin moves upward, Total2 could make a very sharp move.
🔑 Even if Bitcoin drops, Total2 might range or even move up. For now, our short trigger is 1.13, and aside from 1.14, we don’t have any specific long trigger.
📅 USDT.D Analysis
Finally, let’s look at Tether dominance. This index made a bullish move to 4.85 after breaking 4.78 and is now in a corrective phase.
📊 If 4.85 is broken, the next bullish leg could continue up to 4.93. If a correction happens, dominance might pull back to 4.78.
❌ Disclaimer ❌
Trading futures is highly risky and dangerous. If you're not an expert, these triggers may not be suitable for you. You should first learn risk and capital management. You can also use the educational content from this channel.
Finally, these triggers reflect my personal opinions on price action, and the market may move completely against this analysis. So, do your own research before opening any position.

Monday - Trade of the day Hello I took a week off from trading — life got a bit hectic 🌀. Looking back, I actually needed that break from the charts 🧠💆♂️.
But we’re back this week! Let’s see how many X’s we can cream off the market 💸🔥
Here are the immediate levels I’m watching 👀 — mainly some range deviations from both internal and external ranges.
If we break either side of the range, I’ll be looking to enter from the last supply or demand zone for a continuation 🚀📉📈
That said, I’ll stay mindful of any supply and demand zones that could get in the way ⚠️📊
Let’s get it 💪📅
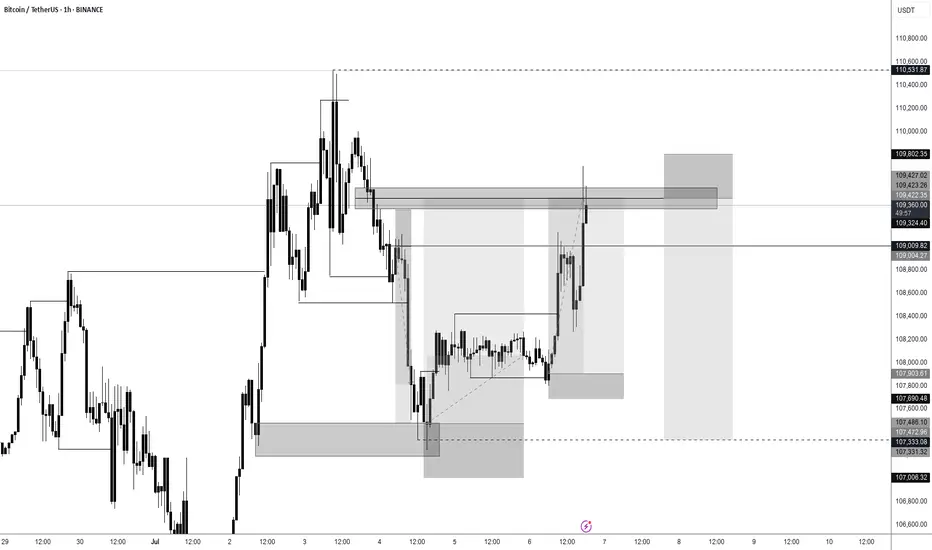
#BTC Update #4 – July 7, 2025🟠 #BTC Update #4 – July 7, 2025
Bitcoin has been trading inside a supply zone , and its last impulsive move happened right into that area. While it tried to push higher again, I now see signs of rejection.
If this rejection holds, the first level I’m watching is $107,850 . Below that, there's a key support around $106,350 . Should this level break, we could see a deeper drop toward $102,650 , where an imbalance zone remains untested.
At the moment, short setups look more reasonable than longs but from a risk/reward perspective, I don’t see enough edge to take action yet. So for now, I’m not entering any position and will simply watch BTC’s next move .
