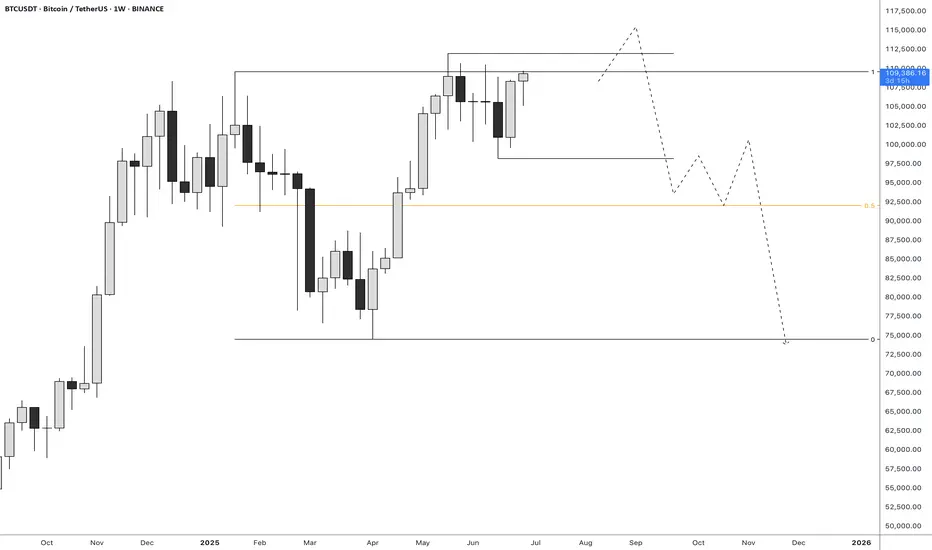
BITCOIN TOUCHED 110K — THEN REJECTEDNot what bulls wanted to see.
With massive gaps below, this kind of price action ain’t it.
BTCDOWNUSDT trade ideas

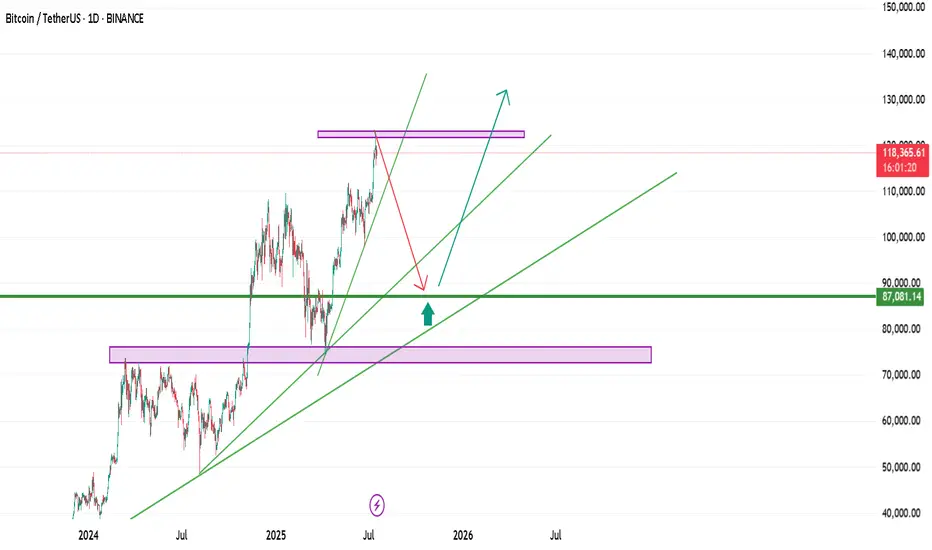
BTC - Reaching to the highest resistance.Bitcoin is approaching its highest resistance zone ever. As it approaches this zone, we need to closely observe the reactions including:
- Price patterns
- Candlestick patterns
- BTC Chart.D

btc usdtbtc usdt
cup patern
I think my eyes are seeing correctly! After the breakout from above and confirmation on the red line, it will move upward.”
BTC UP OR NO📈 Bitcoin to Reach $113K, With a Breakout Path to $120K – A Professional Outlook
After analyzing the macro trend, technical structure, market sentiment, and on-chain behavior, I strongly believe that Bitcoin is on a clear trajectory toward $113,000, with a potential extension to $120,000 if key resistance is broken.
---
🔍 1. Technical Analysis Perspective
Macro Bullish Structure: Since the 2022 bear market bottom, Bitcoin has maintained a consistent higher highs and higher lows pattern, confirming a long-term uptrend.
Fibonacci Extension: The 1.618 Fibonacci extension from the $15.5K bottom to the $69K peak gives a projected target of around $113K.
Historical Fractal Patterns: In previous cycles, Bitcoin has always broken past previous all-time highs by 1.5x to 1.75x, placing this cycle's peak in the $110K–$120K range.
Ascending Triangle Breakout: On the weekly chart, BTC is forming a bullish ascending triangle with the top resistance at ~$73K. A confirmed breakout targets $113K as the next major supply zone.
---
🧠 2. Market Psychology & Cycle Timing
Halving Effect: Historically, Bitcoin peaks occur 9–12 months post-halving. The most recent halving was in April 2024, aligning a potential peak by Q1 or Q2 of 2025.
Psychological Resistance Zones: The $100K–$113K range is not only a Fibonacci target but also a powerful psychological barrier. Once breached, FOMO and institutional momentum could push BTC rapidly to $120K.
Retail vs Institutional Flows: Data shows increased ETF inflows and long-term holder accumulation — a classic pre-peak indicator.
---
🔗 3. On-Chain and Whale Behavior
Realized Price vs Market Price: BTC market price is well above long-term holder realized price, signaling bull market phase 2 (the steep climb).
Dormant Supply: Over 70% of BTC has not moved in 6+ months, showing strong holder conviction. This reduces sell pressure as price increases.
Whale Accumulation Zones: Whales are heavily positioned around $60K–$65K, and there is minimal sell volume above $100K on major exchanges, opening the path to $113K with low resistance.
---
🚀 Conclusion:
> Based on comprehensive technical patterns, market structure, psychological phases, and on-chain behavior, Bitcoin is highly likely to reach $113,000.
If momentum continues and $113K is breached with volume confirmation, a sharp move toward $120,000 becomes not only possible — but likely.

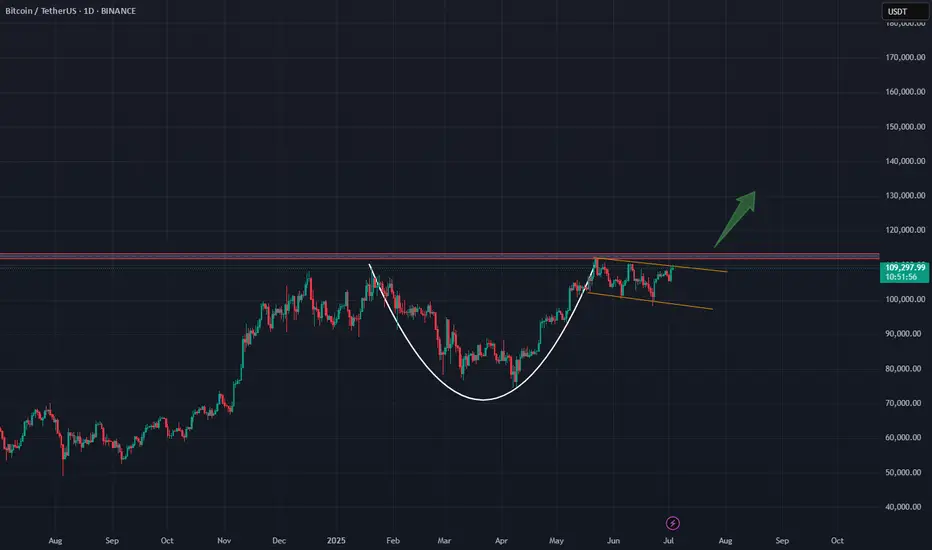
BTC: A Classic Cup & Handle in Play!Bitcoin has formed a classic cup and handle pattern on the daily chart, with the 100 EMA providing solid support during the handle formation. Currently, the price is consolidating in what appears to be a bullish flag or extended handle, just below the key resistance zone around $109K. A breakout above this level could ignite a strong bullish rally toward higher targets like $144k.
Key Highlights:
-Cup & Handle pattern confirmed
-10 EMA acting as dynamic support
-Bullish flag/handle forming near resistance
- A breakout could lead to explosive upside
Regards
Hexa
CRYPTOCAP:BTC BITSTAMP:BTCUSD
break, BTC soon reaches new ATH💎 Update Plan BTC after NFP (July 3)
Notable news about BTC:
Bitcoin (BTC) recovered to $ 109,000 on Wednesday when the US agreement with Vietnam and the increase in global M2 supply of M2 money has promoted an increase in open interest rates (OI), soaring to 689.78 thousand BTC worth about $ 75 billion. The cryptocurrency market in general has increased the price along with BTC, with leading altcoins, Ethereum (ETH), XRP and Solana (SOL) increased by 7%, 3%and 4%respectively.
Bitcoin, the market cryptocurrency market increased by the trade agreement with Vietnam and M2 money supply soared
The cryptocurrency market has recovered on Wednesday, an increase of 2% to regain the market capitalization of $ 3.5 trillion.
Technical analysis angle
First, congratulate the investors who follow the plan when we previously traded according to the model and had a short signal at 108k and took profit and then Long in the 106k area.
Currently, BTC is in wave 5 and is trapped in the Fibonanci area of 2,618 golden ratio around the price of 109k, this is also the threshold of the price of investors who are under pressure before the price area goes to 112k
The 112k region is a psychological area of profit and will appear on the 109k sales situation before the BTC price may rise further in the last 6 months of the year.
Please follow the channel to receive accurate scenarios about gold and BTC /-Teart /-heart
==> Comments for trend reference. Wishing investors successfully trading

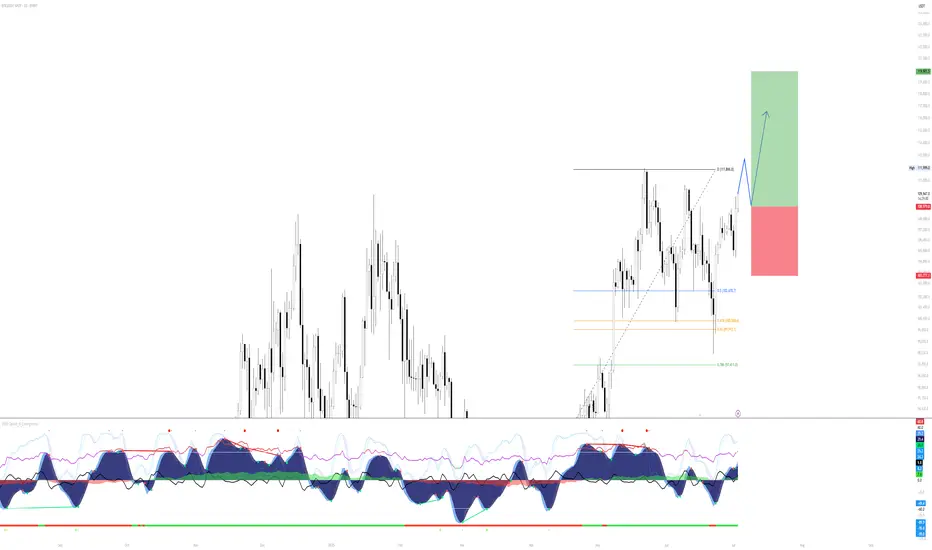
BTC/USD Fake out before Pump | Bullish Flag formationBTC/USDT (1D) Market Outlook – July 1, 2025
Introduction
BTC is currently consolidating within a bullish flag pattern after printing a swing high at 108.9K and a recent swing low at 98K. The price sits just below a major supply zone.
Context 1: Key Zones
Supply: 104.6K – 112.1K
Demand: 74.4K – 82.5K
Fair Value Gaps (FVG): 3 zones below price, with one near 88–90K
Context 2: Technical Confluence
Liquidation Zone: 106.2K
Golden Pocket (Fib 0.618): 102.1K
Psychological Levels: 105K and 110K
Context 3: Market Structure
Pattern: Bullish flag
Trend (LTF): Sideways/consolidation
Volume Profile: Heavy activity near 105K–110K
Bullish Scenario
Breaks above 106.2K (liq zone)
Pulls back to 102.1K (golden pocket), forms higher low
Retests resistance for continuation
Alt scenario: clean breakout above resistance → ATH retest
Bearish Scenario
Breaks below 106.2K and flag support
Fills FVG, breaks prior low at 98K
Triggers macro downtrend toward 88–90K zone
Summary
BTC is at a decision point inside a bullish flag, facing supply. A break above 106.2K favors upside continuation, while rejection and a lower low could trigger a deeper retracement. Watch key levels closely.

BTC/USDT Long Setup – Daily Bullish Continuation PlayMarket Context:
Bitcoin has reclaimed significant ground after a corrective phase and is now approaching prior highs. The current move suggests strength and potential continuation — but with overhead resistance near 111,866, a retracement or consolidation before continuation is likely.
Setup Idea:
The chart illustrates a bullish continuation scenario: price may push slightly higher into resistance, then retrace into a more favorable entry zone before targeting new highs. The Fibonacci retracement levels between 100,500 and 102,470 align with a high-probability demand zone for a dip buy.
Trade Plan:
Entry Zone: Await retracement into the 0.5–0.618 fib zone (102,400–100,500)
Stop Loss: Below 99,900 (beneath 0.65 fib and invalidation structure)
Target: 119,900 (clean extension above prior high)
Risk/Reward: Favorable multi-R setup based on macro continuation
Notes:
The setup anticipates a pullback before the next impulse. If BTC breaks through 111,900 with momentum and no retrace, the trade idea would shift to chasing on strength or waiting for consolidation above.
Momentum indicators on VMC show bullish pressure building, but overbought conditions suggest temporary cooling may occur.
Let the retrace come to you — and position accordingly on confirmation.
110k soon , best time to buy altcoins Btc still didnt complete main wave 5 , btc for last time touch 98k but this time price will attack 110k and then we will have NATH.

BTC Bullflag break Currently, BTC is forming a bullish continuation pattern, combining both a bull flag and an ascending triangle, which suggests potential upside momentum. The price is trading within a defined range, sitting just below a supply zone, which has previously acted as resistance. If the price rejects from this supply zone and drops to the demand zone below, it presents a strong long opportunity, as this zone has historically shown buying interest. Additionally, the current price structure aligns with the 0.5 Fibonacci retracement level, indicating a possible reversal area. If BTC retraces to the demand zone, a long entry can be considered with a stop loss below the zone and a target at the 1.168 Fibonacci extension, providing a favorable risk-to-reward setup. Overall, the setup shows bullish confluence with a clear trade plan based on market structure, Fibonacci levels, and supply/demand zones.

BTC - Probable SHORT Scenario My main trading principle is that the price always moves from swept liquidity levels to untouched liquidity levels.
In particular case we clearly can see the following context: price swept 1M key liquidity level and left untouched level lower + forming LTF range.
But to take more statistically probable trades we should wait for some type of lower timeframe confirmation, and in this case we should wait for MSB or reaching 0,5 range mean
Your success is determined solely by your ability to consistently follow the same principles.
BTC AI Prediction Dashboard - 6h Price Path (17.07.25)
Prediction made using Crypticorn AI Prediction Dashboard
Link in bio
BTCUSDT Forecast:
Crypticorn AI Prediction Dashboard Projects 6h Price Path (Forward-Only)
Forecast timestamp: ~10:30 UTC
Timeframe: 15m
Prediction horizon: 6 hours
Model output:
Central estimate (blue line): -119,394
Represents the AI’s best estimate of BTC’s near-term price direction.
80% confidence band (light blue): 118,475 – 119,566
The light blue zone marks the 80% confidence range — the most likely area for price to close
40% confidence band (dark blue): 117,621 – 120,336
The dark blue zone shows the narrower 40% confidence range, where price is expected to stay with higher concentration
Volume on signal bar: 121.96
This chart shows a short-term Bitcoin price forecast using AI-generated confidence zones.
Candlesticks reflect actual BTC/USDT price action in 15-minute intervals.
This helps visualize expected volatility and potential price zones in the short term.

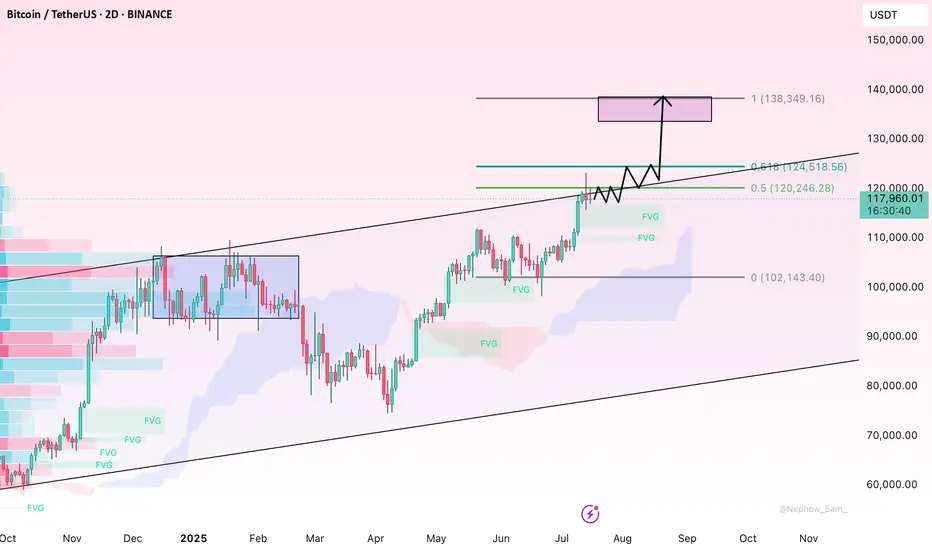
BTC sideways above 115k💎 BTC PLAN UPDATE (July 17)
NOTABLE NEWS ABOUT BTC
Bitcoin Price Forecast: BTC Recovers as Trump Steps In to Revive Crypto Legislation Momentum
Bitcoin (BTC) saw a mild recovery, trading around $119,000 at the time of writing on Wednesday, after falling nearly 2% the previous day. This rebound followed an announcement by U.S. President Donald Trump on Wednesday morning, stating that the GENIUS Act is ready to be passed by the House during the legislative “Crypto Week”, sparking optimism in the crypto market. Furthermore, institutional demand continues to grow, with spot Bitcoin ETFs recording over $400 million in inflows on Tuesday, extending the growth streak since July 2.
TECHNICAL ANALYSIS
🧠 Pattern Overview:
The chart clearly displays an Elliott Wave pattern (1) → (2) → (3) → (4) → (5) along with Fibonacci Retracement and Extension levels, helping to identify potential support and resistance zones.
1. Elliott Waves:
Wave (3) was completed around the $122,144 zone and the market is currently in the corrective wave (4).
Wave (5) is expected to move upward with targets at:
• 1.618 Fibonacci Extension: ~$127,404
• Or further: ~$130,747
2. Support Zone (grey area below):
Located around $115,000 – $116,000, which is:
• The 0.5 – 0.618 retracement of Wave (3)
• Aligned with the EMA200 and dotted black trendline support.
If the price falls into this area, it’s highly likely to bounce back and form Wave (5).
3. Danger Zone if Broken:
If this support fails, price may fall deeper to:
• $113,200 (0.786 retracement),
• Or even lower: $111,600 – $111,800
4. Potential Scenarios:
Two main outcomes:
• Continued Uptrend: Price bounces from the support zone and heads toward $127,000 – $130,000
• Breakdown: If the support breaks, a deeper decline may occur, breaking the wave structure.
Follow the channel for continuous and up-to-date analysis on XAUUSD, CURRENCIES, and BTC.

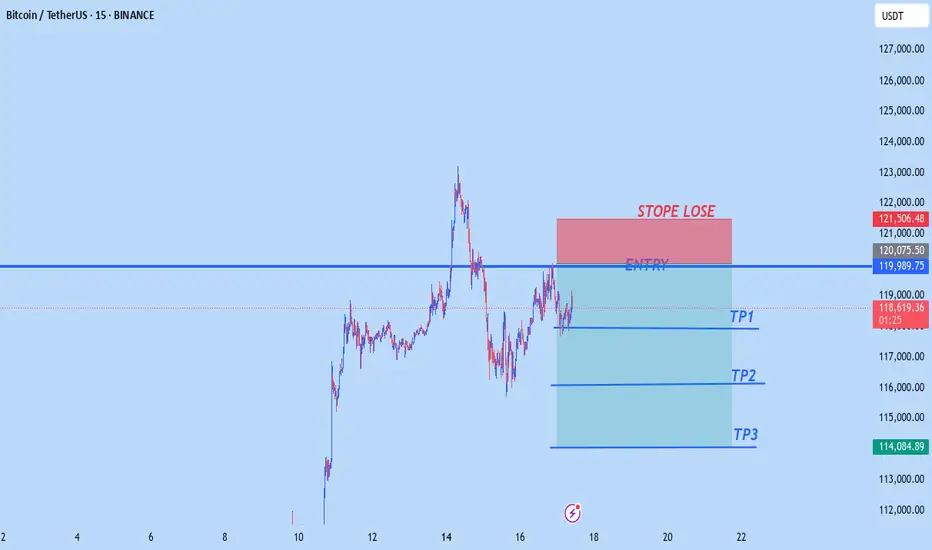
BTCUSD NEW OUTLOOK Btcusd sell from 120,000
tp1 118,000
tp2 116,000
tp3 114,000
Stopelose 121,500
Trade at your own risk
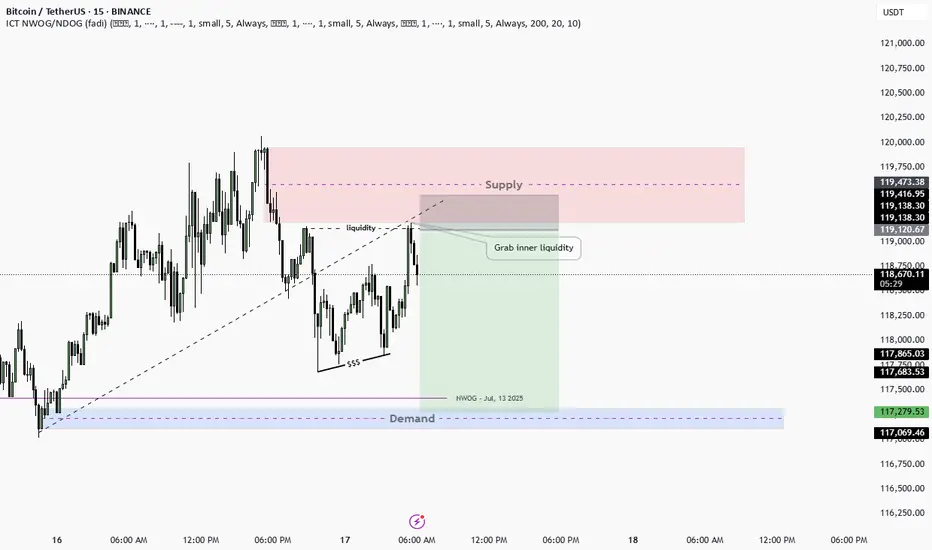
Daily Pan Trade NO.1SMC concept that actually work really nice after we take inner liquidity we going for demand zone
Bitcoin Forever Bitcoin's Technical Trajectory: Analysis for Q3-Q4 2025
Breaking New Records: Bitcoin's Path Beyond the July Peak
With Bitcoin currently trading near historical highs after reaching its all-time high of $123,218 in July 2025, we find ourselves in unprecedented territory. This comprehensive technical analysis examines Bitcoin's potential trajectory through the remainder of 2025, leveraging multiple analytical frameworks to identify probable price targets and key levels.
Current Market Context
Bitcoin has experienced a remarkable ascent in 2025, climbing from around $85,000 in January to establish a new all-time high of $123,218 in July. After this peak, we've seen a period of consolidation with price action forming a potential bull flag pattern between $117,000-$120,000. This consolidation phase represents a critical juncture for Bitcoin's next directional move.
The most recent data shows Bitcoin trading around $118,200 in late July, representing a modest pullback of approximately 4% from the all-time high. This shallow retracement suggests underlying strength rather than exhaustion in the primary trend.
RSI Analysis: Healthy Momentum Reset
Despite Bitcoin's extraordinary rise to $123,218 in July, the daily RSI has demonstrated remarkable resilience. After reaching overbought territory (70+) during the July peak, the indicator has now cooled to approximately 42-46, indicating a healthy reset of momentum conditions without surrendering the broader uptrend.
The weekly RSI reading of 46.4 is particularly significant—showing that despite the recent consolidation, Bitcoin maintains substantial momentum capacity before reaching the extreme readings (80+) that typically signal major cycle tops. This technical positioning creates an ideal scenario where momentum has reset while price structure remains intact.
Most notably, the absence of bearish divergences between price and RSI on higher timeframes suggests the current consolidation is likely a pause rather than a reversal in the primary trend.
Wyckoff Analysis: Re-accumulation Before Continuation
The price action following the $123,218 July peak displays classic characteristics of Wyckoff re-accumulation rather than distribution:
The initial decline from the peak represents a "Preliminary Support" (PS) phase
The subsequent trading range between $117,000-$120,000 shows tight price action with decreasing volatility
Volume characteristics show diminishing selling pressure rather than distribution
Recent price action suggests we're approaching the "Spring" phase that typically precedes markup
According to the data, Bitcoin's price action in late July shows decreasing volatility with narrowing price ranges, consistent with the "Cause Building" phase in Wyckoff methodology. This structure indicates institutional accumulation is still occurring at these elevated levels—a powerful sign that smart money anticipates further upside potential. The completion of this re-accumulation pattern projects a move toward the $135,000-$145,000 range in the coming months.
Supply/Demand Zone Analysis: Key Levels Identified
Supply and demand zone analysis reveals critical price levels that will influence Bitcoin's next directional move:
Major demand zone established between $115,000-$117,000 (recent consolidation floor)
Secondary support cluster at $108,000-$110,000 (previous resistance turned support)
Primary resistance at $123,200-$125,000 (all-time high region)
Limited historical supply overhead above $123,218 suggests minimal resistance once this level is breached
The formation of fresh demand zones during the recent consolidation indicates strategic accumulation before the anticipated upward expansion. The neutralization of previous supply zones during the advance to all-time highs has effectively cleared the technical pathway for Bitcoin's next significant move higher.
Volume Analysis: Confirming the Bullish Case
Examination of trading volume during the recent consolidation provides crucial validation for our bullish thesis:
Declining volume during pullbacks indicates diminishing selling pressure
Volume spikes on upward moves suggest accumulation on strength
The Volume-Weighted Average Price (VWAP) maintains a positive slope, confirming the underlying strength of the trend
The high-volume node has migrated upward in recent weeks, signalling comfort with accumulation at these unprecedented price levels—a powerful indication of market confidence in Bitcoin's valuation. The buying/selling volume differential maintains a positive bias, confirming underlying accumulation despite price consolidation.
Fibonacci Extension Framework: Projecting Targets
With Bitcoin having established a new all-time high at $123,218 in July, we can project potential targets using Fibonacci extensions from the most recent significant swing points:
The 127.2% extension from the June-July rally projects to approximately $132,000
The 161.8% extension suggests potential movement toward $145,000
The 200% extension indicates a possible target of $160,000
These projections align with psychological thresholds that could serve as natural targets in this new price discovery phase.
Elliott Wave Analysis: Extended Fifth Wave Scenario
The current price action suggests we're likely in an extended fifth wave scenario within a larger degree bull cycle:
Primary waves I through III appear complete with the move to $123,218 in July
The current consolidation represents wave IV
Wave V is projected to reach the $140,000-$160,000 range
This wave count suggests potential for continued appreciation toward the $145,000-$160,000 range before a more significant corrective phase begins. The internal structure of the current consolidation displays textbook proportional relationships, further validating our analysis.
Price Projection Timeline
August-September 2025:
Completion of the current consolidation phase with a potential final retest of support in the $115,000-$117,000 range. This would represent the "Last Point of Support" in Wyckoff terminology and provide a final opportunity for institutional accumulation before the next leg up. A decisive break above $125,000 would confirm the end of the consolidation phase.
October 2025:
Renewed momentum pushing Bitcoin toward the $132,000-$140,000 range, potentially coinciding with seasonal strength typically observed in Q4. This phase could see increased institutional participation as year-end positioning begins, with volume expansion confirming the strength of the move.
November-December 2025:
Final wave extension potentially reaching the $145,000-$160,000 range, representing a 20-30% appreciation from current all-time high levels. This phase may exhibit increased volatility and could be followed by a more substantial correction as the extended fifth wave completes.
Key Levels to Monitor
Support Zones:
Primary: $115,000-$117,000 (must hold for bullish scenario)
Secondary: $108,000-$110,000 (previous resistance turned support)
Tertiary: $100,000-$102,000 (psychological and technical support)
Resistance Zones:
Immediate: $123,200-$125,000 (all-time high region)
Target 1: $132,000-$135,000 (127.2% Fibonacci extension)
Target 2: $145,000-$150,000 (161.8% Fibonacci extension)
Target 3: $160,000+ (200% Fibonacci extension)
The Technical Case for New Highs
Despite Bitcoin already achieving unprecedented price levels in July, multiple technical frameworks suggest the potential for continued appreciation:
Historical Precedent: Previous bull cycles have shown Bitcoin capable of extending significantly beyond initial all-time highs before cycle completion
Institutional Adoption: On-chain metrics indicate continued accumulation by large holders despite elevated prices, with exchange outflows remaining positive
Technical Structure: The current consolidation pattern resembles re-accumulation rather than distribution, suggesting the market is preparing for another leg higher
Momentum Characteristics: Current momentum readings have reset from overbought conditions without breaking the underlying trend structure
Strategic Considerations
With Bitcoin having already achieved a new all-time high at $123,218 in July, strategic approaches might include:
Maintaining core positions while implementing trailing stop strategies
Adding to positions during retests of key support levels ($115,000-$117,000)
Considering partial profit-taking at key Fibonacci extension levels
Remaining vigilant for signs of distribution patterns that may emerge at higher levels
Conclusion: The Path to $160,000
The weight of technical evidence suggests Bitcoin has entered a new paradigm of price discovery following its break to all-time highs in July 2025. While the path may include periods of consolidation and volatility, the underlying trend remains firmly bullish with multiple technical frameworks projecting targets in the $145,000-$160,000 range by year-end 2025.
The current consolidation phase represents a healthy reset of momentum conditions rather than a trend reversal, creating an ideal technical foundation for Bitcoin's next major advance. With institutional adoption continuing to grow and technical indicators suggesting ample room for further appreciation, Bitcoin appears well-positioned to achieve new record highs in the coming months.
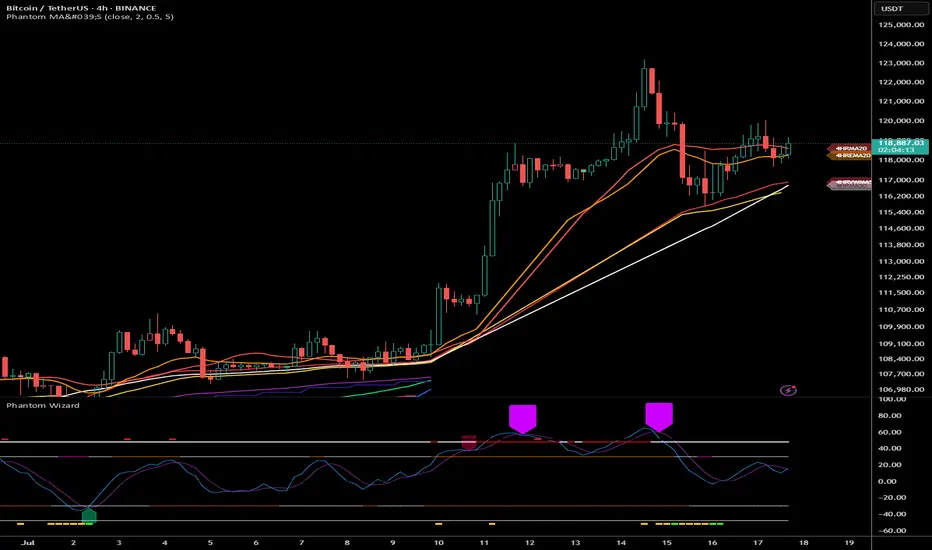

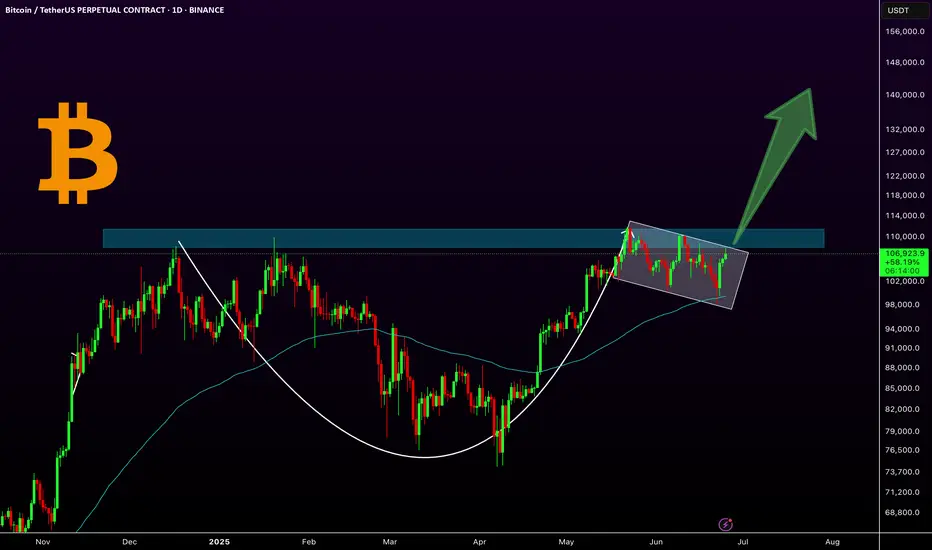
Bitcoin (BTC): Smaller Correction Means Nothing | BullishBitcoin still looks strong;we had a smaller correction recently, but buy-side volume still shows signs of dominance.
Accumulation is on, so we might have a very volatile movement very soon; be careful!
Swallow Academy

We are going downBitcoin clearly broken below this bear flag and retested lower line. Invalidation is close above 120k.
The new floor of BitcoinI calculated the new floor for low-risk entry for Bitcoin as 8700. If it falls from this ceiling, this floor can create pivot
BTC/USDT Heist Mode: Buy Low, Escape Rich🏴☠️"Bitcoin vs Tether" Crypto Market Robbery Blueprint 🔥 | Thief Trading Style (Swing/Day Plan)
🌍 Hey Money Makers, Chart Hackers, and Global Robbers! 💰🤑💸
Welcome to the new Heist Plan by your favorite thief in the game — this time targeting the "Bitcoin vs Tether" Crypto Market like a smooth criminal on the charts. 🎯📊
This is not your average technical analysis — it's a strategic robbery based on Thief Trading Style™, blending deep technical + fundamental analysis, market psychology, and raw trader instincts.
💼 THE SETUP — PREPARE FOR THE ROBBERY 🎯
We're looking at a bullish operation, setting up to break into the high-value vaults near a high-risk, high-reward resistance zone — beware, it's a high-voltage trap area where pro sellers and bearish robbers set their ambush. ⚡🔌
This plan includes a layered DCA-style entry, aiming for max profit with controlled risk. Chart alarms on, mindset ready. 🧠📈🔔
🟢 ENTRY: "The Robbery Begins"
📍 Zone-1 Buy: Near 116200.00 after MA pullback
📍 Zone-2 Buy: Near 112600.00 deeper pullback
🛠️ Entry Style: Limit Orders + DCA Layering
🎯 Wait for MA crossover confirmations and price reaction zones — don’t chase, trap the market.
🔻 STOP LOSS: "Plan the Escape Route"
⛔ SL for Pullback-1: 113000.00 (2H swing low)
⛔ SL for Pullback-2: 110000.00
📌 SL placement depends on your position sizing & risk management. Control the loss; live to rob another day. 🎭💼
🎯 TARGET ZONE: “Cash Out Point”
💸 First TP: 127000.00
🏁 Let the profit ride if momentum allows. Use a trailing SL once it moves in your favor to lock in gains.
👀 Scalpers Note:
Only play the long side. If your capital is heavy, take early moves. If you’re light, swing it with the gang. Stay on the bullish train and avoid shorting traps. Use tight trailing SL.
🔎 THE STORY BEHIND THE HEIST – WHY BULLISH?
"Bitcoin vs Tether" shows bullish momentum driven by:
💹 Technical bounce off major support
🌏 Macroeconomic & geopolitical sentiment
📰 Volume + sentiment shift (risk-on)
📈 Cross-market index confirmation
🧠 Smart traders are preparing, not reacting. Stay ahead of the herd.
👉 For deeper insight, refer to:
✅ Macro Reports
✅ COT Data
✅ Intermarket Correlations
✅ CHINA-specific index outlooks
⚠️ RISK WARNING – TRADING EVENTS & VOLATILITY
🗓️ News releases can flip sentiment fast — we advise:
❌ Avoid new positions during high-impact events
🔁 Use trailing SLs to protect profit
🔔 Always manage position sizing and alerts wisely
❤️ SUPPORT THE CREW | BOOST THE PLAN
Love this analysis? Smash that Boost Button to power the team.
Join the Thief Squad and trade like legends — Steal Smart, Trade Sharp. 💥💪💰
Every day in the market is a new heist opportunity — if you have a plan. Stay tuned for more wild robbery blueprints.
📌 This is not financial advice. Trade at your own risk. Adjust based on your personal strategy and capital. Market conditions evolve fast — stay updated, stay alert.

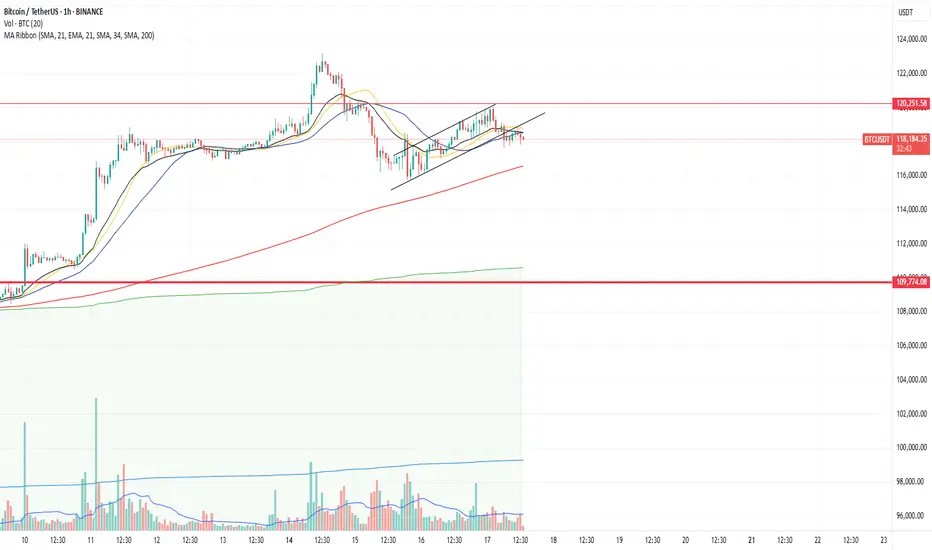
BTC Nears $120K – Pullback Risk or Breakout Launchpad?Bitcoin has rallied strongly after breaking its multi-week consolidation, now hovering just under the key psychological and historical resistance at $120K. The daily chart shows price floating above the 20EMA, with no signs of distribution—yet. However, the dense liquidity pocket between $110K–$114K remains a magnet in case of a technical pullback.
If bulls defend $118K and price cleanly breaks above $121K with strong volume, the next target lies in the $125K–$128K zone. Spot ETF inflows remain healthy, and any dovish pivot from the Fed could set off another crypto-wide bull wave.
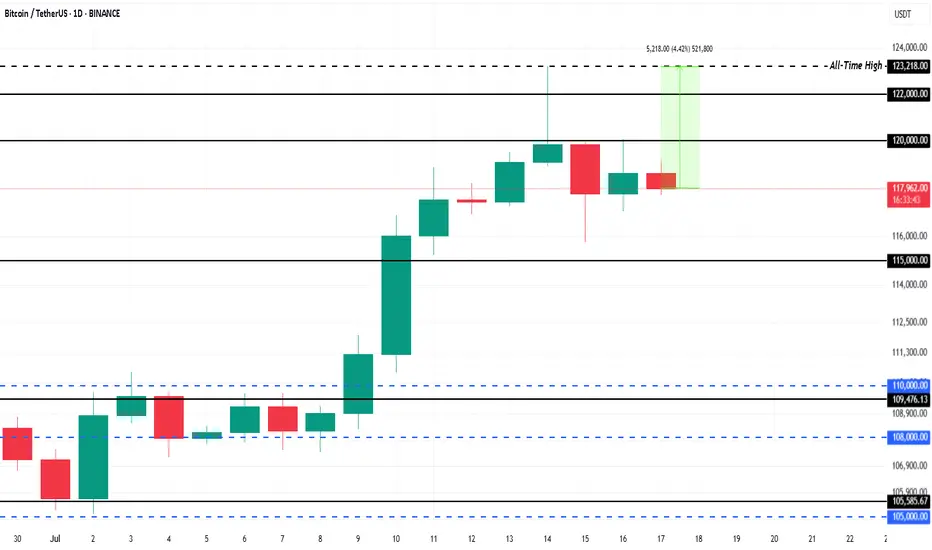
$1.5 Billion ETF Inflows Could Push Bitcoin Price 4% to New ATHBINANCE:BTCUSDT is currently trading at $118,325, facing resistance at the $120,000 level. This resistance is crucial for Bitcoin if it wants to break back to its ATH of $123,218 . The 4.4% gap to reach the ATH indicates potential for growth, but Bitcoin needs to secure support above $120,000 for this to happen.
This week, spot BINANCE:BTCUSDT exchange-traded funds (ETFs) saw over $1.5 billion in inflows , a significant portion of which occurred in the last 48 hours during Bitcoin’s dip.
The influx of institutional money highlights that investors are confident in Bitcoin’s potential despite the market cooling. If this trend persists, it could propel BINANCE:BTCUSDT price upward, as institutional support provides stability.
If BINANCE:BTCUSDT can hold above $120,000 and push past $122,000, it could continue its ascent toward new all-time highs. The current market conditions and ETF inflows support a bullish outlook, with a significant chance of breaking the resistance.
However, the risk of profit-taking remains , which could lead to a price drop. If BINANCE:BTCUSDT faces selling pressure, it could fall back to $115,000 , erasing a portion of recent gains. This would invalidate the bullish thesis, causing Bitcoin to retest lower support levels.