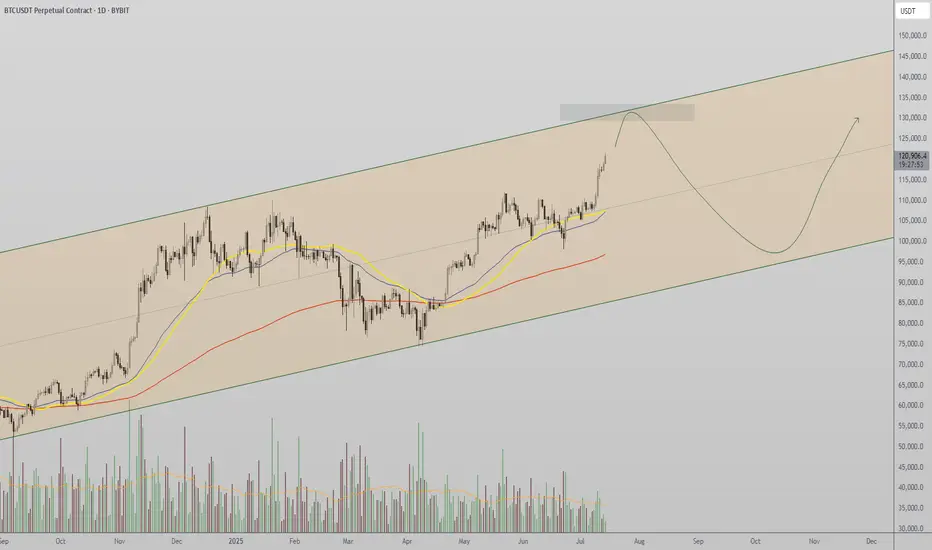
Lingrid | BTCUSDT strong Bullish Trend Continues The price perfectly fulfilled my last idea . BINANCE:BTCUSDT CRYPTOCAP:BTC broke out of a long consolidation range and confirmed a higher low at 98,200, initiating a new impulsive rally inside the upward channel. The price is now trading well above the 116,643 breakout level and holding near the mid-range of the next resistance zone. As long as the bullish structure holds, price is expected to target the upper resistance band near 130,000 in the coming sessions. Momentum and structure remain in favor of the bulls, supported by trendline and volume strength.
📉 Key Levels
Buy trigger: breakout and sustained move above 116,643
Buy zone: 116,643–120,000 (retest of structure and upper trendline)
Target: 130,000
Invalidation: drop below 116,000 breaks upward trend bias
💡 Risks
False breakouts around resistance zone may delay continuation
Macro uncertainty or ETF-related news can shift sentiment
Failure to hold above 116,643 would expose the trend to deeper correction
If this idea resonates with you or you have your own opinion, traders, hit the comments. I’m excited to read your thoughts!
BTCDOWNUSDT trade ideas

$130K Channel Resistance — Bullish Structure Intact Bitcoin continues its strong uptrend, pushing toward high time frame resistance at $130K. With no bearish structure in sight, short-term momentum favors continuation unless resistance prompts a reversal.
Bitcoin is showing continued strength in the immediate short term, with price steadily advancing toward the $130,000 high time frame channel resistance. This level marks the upper boundary of a macro trend channel and presents the next critical test for BTC. While this zone may act as a barrier, the market remains structurally bullish, and further upside remains possible before any meaningful correction takes place.
Key Technical Points:
- Channel Resistance at $130K: Major high time frame level to watch
- Bullish Market Structure: Consecutive higher highs and higher lows on lower time frames
- No Bearish Reversal Signs Yet: No structural break or shift to indicate correction
Bitcoin’s price action has been defined by clear bullish structure, especially on the lower time frames, where the market continues to print higher highs and higher lows. This confirms that bulls are still in control and dips are being bought aggressively, maintaining the strength of the trend.
The next major technical level is the $130K resistance, which aligns with the upper boundary of a long-term ascending channel. This area is likely to serve as a key decision zone. If price approaches this region without any signs of exhaustion or bearish divergence, the probability of a brief breakout or retest increases.
However, it is also important to consider this level as a potential inflection point. If price begins to stall at or near $130K — especially with declining volume or a shift in short-term structure — it could signal the beginning of a corrective move. Until such a development occurs, however, the market remains decisively bullish.
Traders should closely monitor intraday structure around the $130K zone. A clean break above on strong volume would indicate continued strength and could open the path toward further price discovery. Conversely, the first sign of weakness would be a break of short-term support levels and failure to form new highs — neither of which has occurred yet.
Bitcoin remains bullish in the short term as it approaches $130K resistance. Unless a structural break occurs or bearish signals appear, further upside remains likely before any correction sets in.
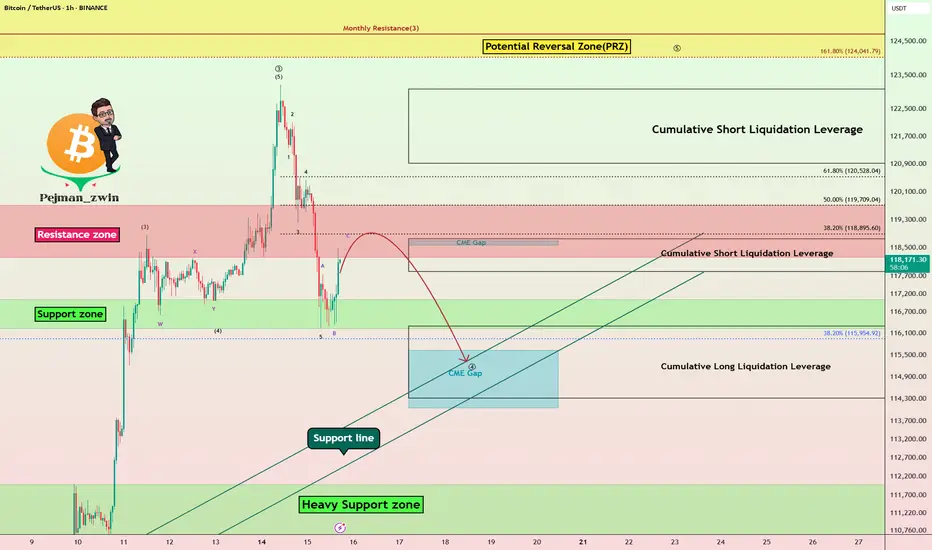
Bitcoin Struggles Below $120K:Will the CME Gap Pull Price Lower?Bitcoin ( BINANCE:BTCUSDT ) has been experiencing a high momentum bullish trend in recent days, which few people expected, especially when it crossed $120,000 . However, in the past 24 hours , Bitcoin has fallen back below $120,000 .
Bitcoin is currently trading in the Resistance zone($119,720-$118,240) and Cumulative Short Liquidation Leverage($118,757-$117,829) on the 1-hour time frame .
In terms of Elliott Wave theory , Bitcoin appears to be completing a main wave 4 . Main wave 4 is likely to have a Zigzag Correction(ABC/5-3-5) .
I expect Bitcoin to attack the Support lines and fill the CME Gap($115,060-$114,947) in the next hour.
Cumulative Short Liquidation Leverage: $123,087-$120,922
Cumulative Long Liquidation Leverage: $116,305-$114,325
Do you think Bitcoin can create a new ATH again?
Note: Stop Loss(SL)= $121,000
Please respect each other's ideas and express them politely if you agree or disagree.
Bitcoin Analyze (BTCUSDT), 1-hour time frame.
Be sure to follow the updated ideas.
Do not forget to put a Stop loss for your positions (For every position you want to open).
Please follow your strategy and updates; this is just my Idea, and I will gladly see your ideas in this post.
Please do not forget the ✅' like '✅ button 🙏😊 & Share it with your friends; thanks, and Trade safe.
TradeCityPro | Bitcoin Daily Analysis #127👋 Welcome to TradeCity Pro!
Let’s dive into the Bitcoin analysis and the key crypto indexes. In this analysis, as usual, I want to review the New York session futures triggers for you.
⏳ 1-Hour timeframe
In the 1-hour timeframe, as you can see, Bitcoin, after the correction down to the 116829 level, is now breaking the 118494 top again.
🔔 This move can potentially start Bitcoin’s next bullish leg. In that case, I think this leg will be a strong one because the correction was very shallow and didn’t even reach the 0.236 Fibonacci level, so the price may perform another sharp move.
💥 On the other hand, the RSI oscillator is entering Overbuy, which increases the probability of a bullish scenario and a sharp next leg.
📈 If the 118494 level is broken, we can open a long position. We already have suitable confirmations for this position since volume and RSI are aligned with price, and also the SMA25 is supporting the price and pushing it upward.
👑 BTC.D Analysis
Let’s move on to Bitcoin Dominance. The dominance trend is still bearish and continuing downward.
⭐ Currently, it’s sitting on a key support at 64.44, and breaking this level can continue the bearish move in dominance.
📅 Total2 Analysis
Let’s go over Total2. Yesterday, after correcting to the 1.26 level, it seems the next bullish move has started and it’s heading toward 1.3.
🎲 The main resistance I see for Total2 is still 1.33, and I believe this will be the main ceiling that Total2 will struggle with.
📅 USDT.D Analysis
Moving on to Tether dominance. This index is still dropping and is now sitting at the 4.36 support.
✨ Breaking this level will start the next bearish leg, and the price can move toward 4.22. If a correction occurs, the first level will be 4.49.
❌ Disclaimer ❌
Trading futures is highly risky and dangerous. If you're not an expert, these triggers may not be suitable for you. You should first learn risk and capital management. You can also use the educational content from this channel.
Finally, these triggers reflect my personal opinions on price action, and the market may move completely against this analysis. So, do your own research before opening any position.

#BTCUSDT(BITCOIN): Another Small Correction And Bounce Straight Bitcoin reached a record high of 125k, but then its price started to drop and is currently trading at 115k. We expect the price to reverse from the 110k area and continue its bull move towards the potential next target of 150k. Keep an eye on the price to see if it falls below our area of interest.
Good luck and trade safely!
Team Setupsfx_
Breakout vs Fakeout: How to Spot the DifferenceHello, Traders! 🖖🏻
There’s probably no phrase that triggers more mixed emotions in crypto trading than: “Looks like we’re breaking out!”. Because let’s be honest…For every clean breakout that follows through with momentum…
…there’s a fakeout waiting to trap overconfident entries.
So, how do you tell the difference? Let’s break it down!
🧱 What Is a Breakout?
A breakout occurs when the price moves decisively beyond a key level, such as support, resistance, a trendline, or a range boundary, and holds.
What makes it a REAL breakout?
Volume Expansion: More participants step in as the price moves through the level.
Strong Candle Closes: Especially on higher timeframes like 4H or 1D.
Follow-Through: The market doesn’t just poke above the level. It builds on it.
No Immediate Rejection: You don’t see a sharp wick straight back below.
Example from BTC (2021):
Look back at January to February 2021. BTC had been stuck under the $42K–$43K resistance for weeks. Every push got sold off, until it didn’t.
When the breakout finally came, it was clean. The massive daily candle closed right through the level. Volume exploded. And there wasn’t even a polite little retest, price just launched straight toward $58K, leaving anyone waiting for a pullback completely behind.
Pure trend breakout energy. Everything lined up: the context, the volume, the structure — textbook 🤌🏻
🪤 What Is a Fakeout?
A fakeout, on the other hand, looks like a breakout… until it isn’t. The price briefly moves beyond a key level, but then snaps back inside the range, often trapping late buyers (or sellers) and triggering stop-losses.
Common Signs of a FAKEOUT:
Low or Declining Volume (at the breakout moment).
Quick Rejection with a Long Wick (especially on intraday charts).
Failure to Hold Above the Level on Retest.
Divergence Between Timeframes: For example, a 15M breakout that looks strong while the 4H still shows consolidation.
Classic BTC example:
This one was sneaky! After BTC hit its all-time high around $65K, the market started looking shaky. Price tried to recover by pushing back into the $58K–$60K zone, a pretty critical level at the time. It looked like a breakout attempt… but something was off. No real volume. No strong candle closes. And then, BOOM, hard rejection. The price popped just enough above resistance to lure in breakout traders (and probably clear out some stop-losses)… then completely reversed. And not just a minor pullback, this fakeout basically triggered the entire leg down toward $30K. Classic liquidity grab. The kind of move that looks like strength for a second… until it absolutely isn’t.
🕵️♂️ Key Differences: Breakout vs Fakeout (Checklist)
🧠 What Causes Fakeouts in Crypto?
Honestly, fakeouts aren’t some kind of accident. They’re almost baked into how crypto markets work.
Part of it comes down to simple liquidity hunting. The market knows exactly where traders tend to place their stop losses, right above resistance or just below support. Price often spikes into those zones, triggers stops, fills larger orders for bigger players… and then reverses completely.
Another reason? A lack of real conviction. Sometimes, it’s mostly retail traders chasing a move. Price pokes above a key level, but there just isn’t enough momentum to sustain it. Without bigger buyers or sellers stepping in, the move collapses right back.
And let’s be honest. When everyone on Crypto Twitter is watching the exact same level, fakeouts become almost inevitable. The more obvious the setup, the more likely it gets front-run, faded, or manipulated.
Plus, a huge mistake? People ignore the higher timeframe context. A breakout on the 15-minute chart might feel exciting… but if the 1D or 4H is still clearly in a downtrend, that breakout is fighting against the bigger picture. No surprise it fails. Fakeouts happen because the market’s job is to make most people wrong, at least for a moment.
🧭 Final Thought
Breakouts and fakeouts are part of the same game: they involve both liquidity and psychology. The market rewards patience, context, and waiting for confirmation. Sometimes, missing the first candle can save you from being a liability to someone else. So, next time an asset “breaks out,” take a second look. Is it really moving with force? Or is it just another trap waiting to be sprung?
What’s the last fakeout that caught you off guard? Drop your story in the comments. Let’s compare lessons learned!

BTC/USDT : Breaks Out – New Highs In Sight After Smashing $111K!By analyzing the Bitcoin (BTC) chart on the weekly timeframe, we can see that the price has finally started to rally as expected—successfully hitting the $111,700 target and even printing a new high at $111,999 with an impressive pump.
This analysis remains valid, and we should expect new all-time highs soon.
The next bullish targets are $124,000 and $131,800.
THE WEEKLY TF ANALYSIS :

BTC AI Prediction Dashboard - 6h Price Path
BTCUSDT Forecast:
Crypticorn AI Prediction Dashboard Projects 6h Price Path (Forward-Only)
Forecast timestamp: ~13:45 UTC
Timeframe: 15m
Prediction horizon: 6 hours
Model output:
Central estimate (blue line): ~118,370
40% confidence band (light blue): 117,719 – 118,563
80% confidence band (dark blue): 117,040 – 119,652
Volume on signal bar: 331.4
Observations:
Price currently near central estimate, within 40% band
Continuation likely as long as price remains within 80% band
Moves outside 80% = low-probability fade or potential breakout
Model does not repaint. Forecast is fixed once published.

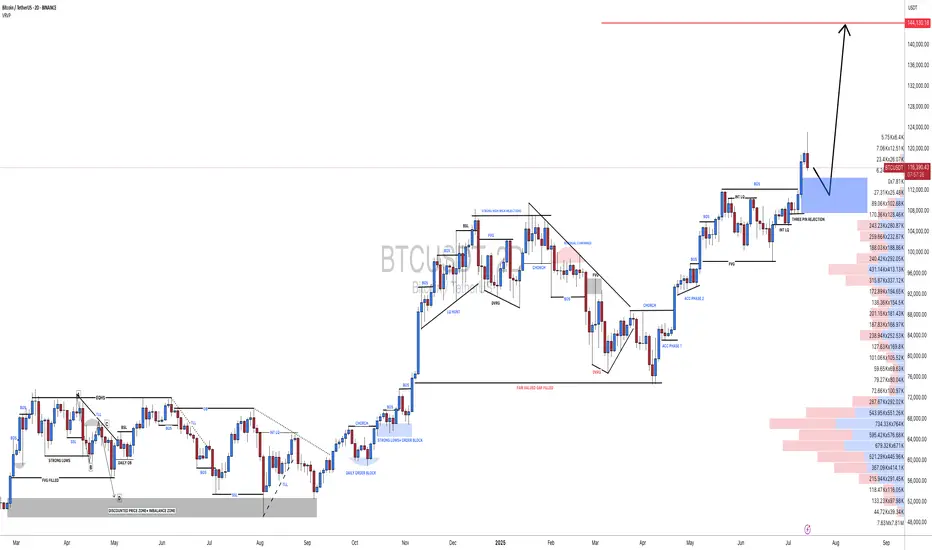
BTC – Bullish Continuation Ahead ?Bitcoin has been trading within a well-defined rising channel since mid-2023, respecting both upper and lower bounds beautifully.
After each impulsive move, we’ve seen healthy corrections followed by bullish continuations — a classic market structure in play.
🟦 Accumulation Zone: After a long accumulation phase, BTC kicked off a strong bullish cycle.
🟥 Correction Phases: Each major move was followed by a red correction zone before resuming the uptrend.
🟧 Current Phase: BTC is consolidating just below the upper channel boundary. A breakout above this zone could confirm the next bullish wave toward $140K+.
🔵 Key Observations:
Structure remains intact within the channel
Previous breakout zones now acting as support (blue arrows)
Continuation patterns are forming, signaling potential upside
🏹As long as the orange zone holds, BTC remains in a bullish structure, and a breakout would likely push us to new highs.
📍Will history repeat and BTC continue its journey toward the upper channel boundary? Let’s wait for confirmation!
💬 What’s your bias here? Are you bullish or waiting for a deeper pullback?
📚 Always follow your trading plan regarding entry, risk management, and trade management.
Good luck!
All Strategies Are Good; If Managed Properly!
~Richard Nasr

TradeCityPro | Bitcoin Daily Analysis #128👋 Welcome to TradeCity Pro!
Let’s get into the analysis of Bitcoin and key crypto indexes. As usual, I’ll be reviewing the futures triggers for the New York session.
⏳ 1-Hour timeframe
In the 1-Hour timeframe, as you can see, Bitcoin broke the 118494 top yesterday and is now moving upward.
✔️ According to the Fibonacci Extension zones, the price has moved up to the 0.5 Fibonacci level and has been rejected from there, printing a few red candles for now.
📊 The buying volume in this bullish leg was very high, and as you can see, volume was in convergence with the trend. Now that the corrective phase has started, the volume is also decreasing, and still remains in convergence with the uptrend.
🔔 From a momentum perspective, we’ve reached a market top because RSI has reached the ceiling it previously formed at the 85.90 level, reacted to it, and has now dropped back below the 70 zone.
💥 If the 85.90 zone on RSI is broken, we’ll likely see a very sharp and explosive bullish leg from Bitcoin. In that case, the next targets would be the 0.786 and 1 Fibonacci levels.
🔑 For opening a position now, we can enter on the break of 122512, and we could also use the price’s pullback to the SMA25 as an entry. For now, our triggers aren’t highly reliable, so positions should be based more on market momentum.
👑 BTC.D Analysis
Let’s move to Bitcoin Dominance. The dominance range box between the 64.44 and 64.82 is still ongoing, and dominance hasn’t broken out of this box yet.
⚡️ If the box breaks downward, a large amount of capital will flow into altcoins, and we could see major pumps in altcoins.
📅 Total2 Analysis
Moving on to Total2. Yesterday, the 1.3 top was broken and the price moved up toward 1.33 and has now reached that area.
I✨ f that resistance breaks, the next target will be 1.41. If a correction happens, 1.3 and 1.26 are the lower support zones.
📅 USDT.D Analysis
Now to Tether Dominance. A new bearish wave started yesterday and has continued down to 4.22.
🎲 If this zone breaks, the bearish leg can continue down to 4.08.
❌ Disclaimer ❌
Trading futures is highly risky and dangerous. If you're not an expert, these triggers may not be suitable for you. You should first learn risk and capital management. You can also use the educational content from this channel.
Finally, these triggers reflect my personal opinions on price action, and the market may move completely against this analysis. So, do your own research before opening any position.

Bitcoin Prediction that will blow your mind (warning for bulls) I am showing you that BTC made new ATH only in the USD pair and not in other pairs like EUR, and why, and what you can anticipate and what to watch out for from #Bitcoin next.

TradeCityPro | Bitcoin Daily Analysis #129👋 Welcome to TradeCity Pro!
Let’s take a look at the Bitcoin analysis and key crypto indices. As usual, in this analysis, I’ll review the futures triggers for the New York session.
⏳ 1-hour timeframe
Yesterday, Bitcoin faced a sharp drop after being rejected from the 122733 top and fell down to the 116829 level.
⚡️ Currently, the price has reached an important support area that I’ve marked for you, and at the same time, the RSI has entered the Oversold zone.
✅ Considering the main trend of the market is bullish, this RSI entry into Oversold could be a very good entry point for a long position, as it may indicate the end of the correction.
✨ If the price holds above the 116829 zone, we can enter a long position, and it’s worth opening a position at this level. Further entries can be taken with breakouts of 118494 and 122733.
👑 BTC.D Analysis
Let’s go to Bitcoin dominance. It has continued its downward movement and after breaking 64.44, it’s now moving down toward 64.18.
📊 If this level breaks, we’ll get confirmation of the continuation toward 63.96. In that case, long positions on altcoins would be very suitable.
📅 Total2 Analysis
Total2 is also undergoing a correction like Bitcoin and has settled below the 1.3 level.
⭐ If the correction continues, the next level to watch is 1.26. For long positions, you can enter after breakouts of 1.3 and 1.33.
📅 USDT.D Analysis
Now to Tether Dominance. After bouncing from the 4.22 bottom, it has returned to the box between 4.36 and 4.44.
🔑 If 4.36 breaks, the next bearish leg could start. On the other hand, if 4.44 breaks, we’ll get the first signal of a trend reversal.

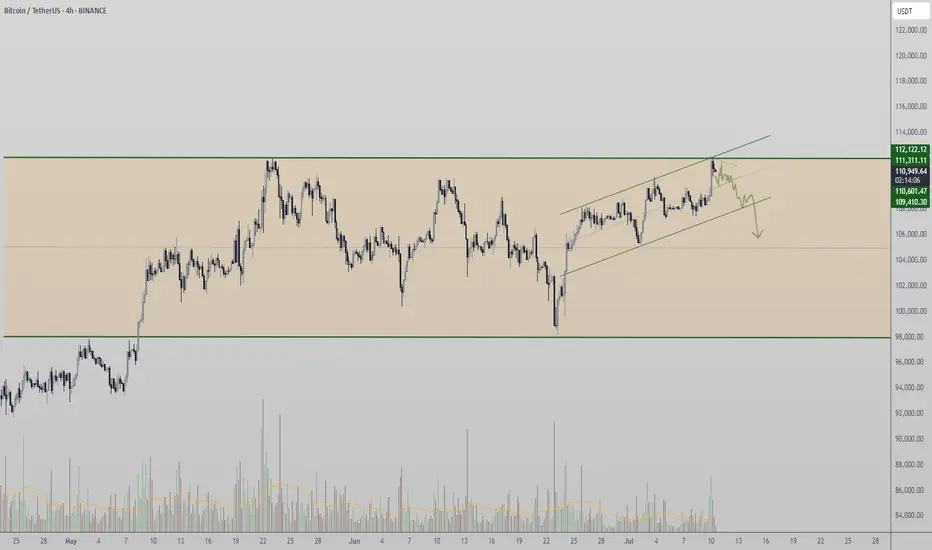
Bitcoin Tests Range High — Breakout or Rotation lower?Bitcoin is currently trading at a critical resistance level — the previous all-time high — which also marks the upper boundary of its multi-month high time frame range. While many are watching for a breakout, price action suggests that a continuation of range-bound behavior is still the more likely scenario. Without decisive volume or structural confirmation above this resistance, BTC may be gearing up for another rotation toward lower support.
Key Technical Points:
- Key Resistance at ATH: Bitcoin is retesting its prior all-time high, which is the current range high
- Volume Remains Weak: Lack of breakout volume signals indecision and caution
- Liquidity Now Resting Below: Upside liquidity has been cleared; downside offers more incentive for market makers
Bitcoin’s price has once again returned to the range high, aligned with its previous all-time high — a level that has consistently capped price over recent months. This area has acted as a significant inflection point where momentum has historically slowed, and price has failed to push through with conviction.
Currently, price action is showing signs of stalling, and importantly, there has been no influx of volume to suggest a true breakout is underway. When volume fails to accompany a test of resistance, it often signals weakening demand or exhaustion from buyers — increasing the risk of a false breakout or rejection.
Additionally, the upside liquidity has already been taken, meaning there’s now less incentive for large players to push price higher in the immediate short term. In contrast, resting liquidity lies beneath current levels, offering greater appeal for a downward move — particularly for market makers seeking efficiency and liquidity capture.
From a technical perspective, Bitcoin remains range-bound until a decisive breakout above the highs occurs with supporting volume and strong candle closures. As of now, this has not happened, keeping the likelihood of a rotation lower well on the table. Should price begin to trade down, watch for a move toward the mid-range or even the lower boundary of the range, depending on how momentum unfolds.
Unless Bitcoin breaks above its all-time high resistance with strong volume, expect the range structure to hold. A lack of bullish follow-through may lead to a rotation toward lower support levels.
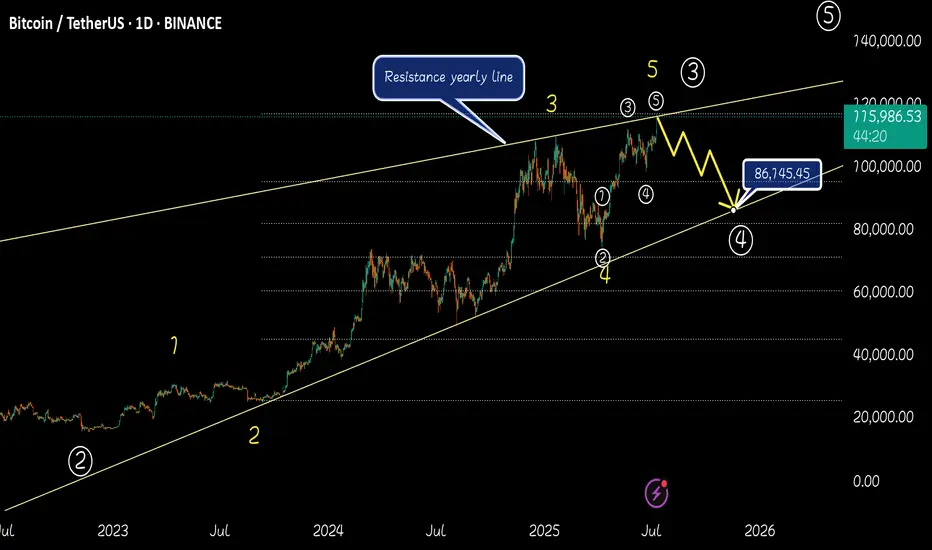
Crash incoming 117k - 86k Today btc record a new ATH . according to the Elliotts theory 117K was the end of main wave 3 . i think btc will start to dump very soon to 86k (wave4 ) . its need to start main wave 5 (86k - 140k) . Good luck. I think btc will bearish in next days.
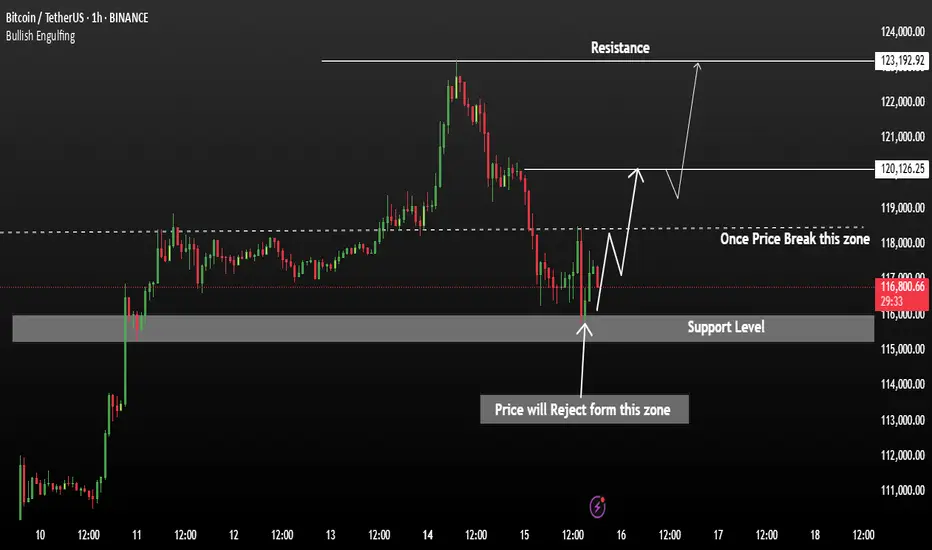
Bitcoin Price in Clear Bullish TrendBTCUSDT has formed a strong support zone around 115,500, where the price recently faced rejection, signalling potential bullish momentum. This zone is acting as a solid base, and any sustained move above the current levels could trigger an aggressive upward move.
Breakout Confirmation: A 1H candle close above 118,500 would confirm bullish continuation Upside Targets: 120,150 and 123,200,
A successful breakout above 118,500 could open the path toward 120K investor needs to monitor our chart.
PS:: Support with like and comments for more better analysis Thanks.
CoinMarketCap chart and correlation with BTC
Hello, traders.
If you "Follow", you can always get new information quickly.
Have a nice day today.
-------------------------------------
(USDT.D 1D chart)
USDT dominance is showing a downward trend along the medium- to long-term downtrend line.
The decline in USDT dominance can be interpreted as an upward trend in the coin market.
Therefore, if it remains below 4.91 or continues to decline, the coin market is likely to enter a bull market.
The coin market is expected to show a major bull market until 2025.
At this time, the USDT dominance is expected to fall to around 3.42 and then rise, causing the coin market to enter a bear market.
Therefore, a major bear market is expected in 2026.
-----------------------------------------------
(BTCUSDT 1M chart)
You might think that it would be good if it continued to rise in a bull market, but in reality, that is not the case.
The reason is that if the price continues to rise, you have to buy more money.
Therefore, it will show a pattern of falling when appropriate and rising again when appropriate.
As I mentioned earlier, 2025 is a major bull market, so it will eventually show a rising pattern.
So, when should we buy and when should we sell?
It would be nice if we could know this a little bit faster, but we can never know.
Currently, BTC is renewing its ATH, so it is even more difficult to predict the movement.
Therefore, we can only predict it through predictable chart analysis techniques.
Among them, the method I use is to predict and respond to the high point using the HA-Low, HA-High indicators and the DOM (DMI + OBV + MOMENTUM) indicator using the Heikin-Ashi chart.
The DOM indicator indicates the end of the high and low points, and the HA-Low and HA-High indicators are used to establish a basic trading strategy.
The sky blue (#00bcd4) arrow is generated, indicating that the DOM (60) indicator is likely to be generated soon.
In other words, it means that the end of the high point is becoming more likely.
When the DOM(60) indicator is created, there is a high possibility of resistance, so the price is likely to fall.
Therefore, you should think about a countermeasure for the decline.
However, as I mentioned earlier, since 2025 is expected to show a major uptrend, it is recommended to sell in installments at an appropriate level to preserve profits.
The reason is that we cannot know how far it will fall.
The start of a full-scale decline is likely to begin when it falls below the HA-High indicator.
Therefore, if it falls after the DOM(60) indicator is created, we should observe whether a new HA-High indicator is created.
If a new HA-High indicator is created, the key point is whether there is support in the vicinity.
If a new HA-High indicator is not created, it is likely to fall to the current HA-High indicator location of 73499.86.
-
A trend line has been formed between highs, but a trend line between lows has not yet been formed.
Therefore, it is difficult to predict how far it will fall once the decline begins.
In the 2025 bull market, BTC is expected to rise to around the Fibonacci ratio of 2.618 (133889.92).
Therefore, we should also consider countermeasures for this.
------------------------------------------------
(BTC.D 1M chart)
When will the altcoin bull market start?
I think the timing is when BTC dominance falls below 55.01 and is maintained or continues to decline.
I think the rising BTC dominance means that the funds flowing into the coin market are concentrated toward BTC.
Therefore, we should consider that a market for trading BTC has been formed.
If BTC dominance fails to fall below the 55.01-62.47 range, BTC dominance is expected to rise to around 73.63-77.07.
At this time, it is highly likely that it will encounter strong resistance and begin to decline.
Since it has not fallen below the mid- to long-term trend line, it seems likely that it will continue to rise.
In order to eventually turn into a downtrend, BTC dominance must fall below 60.
If not, I think it will be difficult to expect an uptrend in altcoins.
----------------------------------------------------------------------
(BTCUSDT 1D chart)
This period of volatility is expected to continue until July 11.
Therefore, the key issue is whether there is support near 111696.21.
If there is support at the 111696.21 point, it is expected to rise to the right Fibonacci ratio 2.24 (116940.43).
If not, we need to check whether there is support near 108316.90.
As I mentioned in the previous idea, three conditions must be met to break through the 111696.21 point upward.
- The StochRSI indicator is showing an upward trend with K>D,
- The PVT-MACD oscillator is showing an upward trend (if possible, above the 0 point),
- The OBV indicator of the Low Line ~ High Line channel is maintained above the High Line,
If the above conditions are met, I said that there is a high possibility of a stepwise upward trend from the 111696.21 point.
-
The next volatility period is expected to occur around July 18 (July 17-19).
Therefore, we need to see if it can be maintained above 111696.21 until the next volatility period.
If it fails, we need to check if it is supported above the M-Signal indicator on the 1D chart, near 108316.90.
If not, it is likely to fall to the M-Signal indicator on the 1W chart or near 99705.62.
-
The basic trading strategy is to buy near the HA-Low indicator and sell near the HA-High indicator.
However, if the HA-High indicator rises, there is a possibility of a stepwise uptrend, and if the HA-Low indicator falls, there is a possibility of a stepwise downtrend.
The end of the stepwise uptrend is a downtrend, and the end of the stepwise downtrend is an uptrend.
That is, we can see that the support around the HA-High ~ DOM(60) section and the DOM(-60) ~ HA-Low section will be important turning points for the future trend.
----------------------------------------------------
On the USDT dominance chart, it seems likely that August 3rd will be the volatility period.
Looking at the BTC chart, it seems likely that August 2nd to 5th (August 1st to 6th) will be the pre-movement for the volatility period of August 1st to 6th.
-
Thank you for reading to the end.
I hope you have a successful trade.
--------------------------------------------------
- This is an explanation of the big picture.
(3-year bull market, 1-year bear market pattern)
I will explain more details when the bear market starts.
------------------------------------------------------

Bitcoin: New All-Time High — What’s Next?Bitcoin had an incredible run, breaking the old all-time high ($111,980) with strong bullish momentum and setting a fresh ATH at $123,218 (Binance). We just witnessed the first major corrective move of ~6% and a decent bounce so far — but the big question is:
What’s next? Will Bitcoin break higher over the summer or form a trading range here?
Let’s dive into the technicals.
🧩 Higher Timeframe Structure
May–June Range:
BTC was stuck between $110K–$100K, forming an ABC corrective pattern. Using trend-based Fib extension (TBFE) from A–B–C:
✅ C wave completed at $98,922 (1.0 TBFE)
✅ Upside target hit at $122,137 (-1 TBFE)
Full Bull Market TBFE:
➡️ 1.0 → $107,301 → previously rejected
➡️ 1.272 → $123,158 → recent rejection zone
Pitchfork (log scale):
➡️ Tapped the upper resistance edge before rejecting.
Previous Bear Market Fib Extension:
➡️ 2.0 extension at $122,524 hit.
2018–2022 Cycle TBFE:
➡️ 1.618 at $122,011 tapped.
Macro Fibonacci Channel:
➡️ Connecting 2018 low ($3,782), 2021 ATH ($69K), 2022 low ($15,476) →
1.618–1.666 resistance band: $121K–$123.5K.
✅ Conclusion: Multiple fib confluences mark the $122K–$123K zone as critical resistance.
Daily Timeframe
➡️ FVG / Imbalance:
Big daily Fair Value Gap between the prior ATH and $115,222 swing low.
BTC broke the prior ATH (pATH) without retest → a pullback to this zone is likely.
Lower Timeframe / Short-Term Outlook
We likely saw a completed 5-wave impulse up → now correcting.
The -6% move was probably wave A, current bounce = wave B, next leg = wave C.
➡ Wave B short zone: $120K–$121K
➡ Wave C target (1.0 TBFE projection): ~$113,326
➡ Confluence at mid-FVG + nPOC
Trade Setups
🔴 Short Setup:
Entry: $120,300–$121,000
Stop: Above current ATH (~$123,300)
Target: $113,500
R:R ≈ 1:2.3
🟢 Long Setup:
Entry: Between Prior ATH and $113,000
Stop: Below anchored VWAP (~$110,500)
Target: Higher, depending on bounce confirmation.
🧠 Educational Insight: Why Fibs Matter at Market Extremes
When markets push into new all-time highs, most classic support/resistance levels disappear — there’s simply no historical price action to lean on. That’s where Fibonacci extensions, channels, and projections become powerful tools.
Here’s why:
➡ Fibonacci extensions (like the 1.272, 1.618, 2.0) help estimate where trend exhaustion or profit-taking zones may appear. They are based on the psychology of crowd behavior, as traders anchor expectations to proportional moves from previous swings.
➡ Trend-Based Fib Extensions (TBFE) project potential reversal or continuation zones using not just price levels, but also the symmetry of prior wave moves.
➡ Fibonacci channels align trend angles across multiple market cycles, giving macro context — like how the 2018 low, 2021 ATH, and 2022 low project the current 1.618–1.666 resistance zone.
In short:
When you don’t have left-hand price history, you lean on right-hand geometry.
That’s why the $122K–123K zone wasn’t just random — it’s a convergence of multiple fib levels, cycle projections, and technical structures across timeframes.
⚡ Final Thoughts
Bitcoin faces major resistance around $122K–$123K backed by multiple fib and structural levels. A retest of the prior ATH zone (~$112K–$113K) looks probable before the next big directional move. Watch lower timeframe structure for signs of completion in this corrective phase.
_________________________________
💬 If you found this helpful, drop a like and comment!
Want breakdowns of other charts? Leave your requests below.

The price of Bitcoin will once again reach a new high!BTCUSDT continues to show exceptional strength and strong bullish momentum. When we look back at the charts from 2023 and 2024, a clear and reliable pattern stands out. Each time Bitcoin touched the 50 EMA on the weekly chart, it triggered a significant rally that led to new all-time highs. That same setup appears to be forming once again.
BITCOIN tested the 50-week EMA around the $75,000 level and has since bounced with conviction. The price has reclaimed the $100,000 mark and is now challenging previous all-time high resistance. Historically, a successful bounce from this key moving average has not only signaled recovery but also sparked explosive upside moves.
Following this repeating pattern, the current cycle target is positioned at $150,000. A clean breakout above the current resistance zone could act as the trigger that launches Bitcoin into uncharted territory. The technical structure remains bullish, momentum is clearly accelerating, and the overall trend continues to favor the upside.
This moment represents a textbook Buy and HODL opportunity. Technical indicators are aligning, market sentiment is turning increasingly optimistic, and all signs suggest that Bitcoin could be preparing for another historic rally. Stay ready for what could be the next big move.

Bitcoin is bullish in world of War or Peace Simple and easy it is like Gold but better version and limited edition one.
Both(BTC & XAU) are bullish most of the time because future is not for Paper Tokens like Dollar or Yuan or Ruble or Euro or ..
Currency of strong countries seems interesting But soon with more laws and Taxes and Rules against each other Economic which USA start it, more and more Trades and things are going to take place in Crypto where the money is still non Trackable or it is tax free.
Also in a world of War as i mentioned in previous Analysis too, more Buys and Sells are going to take place via Crypto instead of countries currency.
Some countries Now are buying and selling weapons from their enemies even and it is possible in Crypto which no one judge or find the transactions.
interesting things which can not all written here are now need Crypto more than ever.
These prices are like a joke and soon maybe with or without some stop loss hunting to the downside and kicking out buyers with leverage market of Crypto will face another Huge gain.
DISCLAIMER: ((trade based on your own decision))
<<press like👍 if you enjoy💚

Bitcoin at a Crossroadshello guys!
In the current 1D chart of BTCUSDT, a Head & Shoulders pattern has formed, suggesting potential for significant price movement in the near term. The structure includes a defined left shoulder, head, and right shoulder, with a descending trendline acting as a critical resistance level.
🔹 Bearish Scenario:
If the price respects the descending trendline and fails to break above the neckline (around $109,480) , a bearish reversal is likely. In that case, the target based on the pattern lies near the $93,500–94,000 support zone. This level aligns with a previous consolidation area, making it a strong candidate for a reaction or bounce.
🔹 Bullish Scenario:
On the flip side, if the price breaks above the neckline and the descending trendline, invalidating the pattern, a strong bullish continuation could unfold. The potential breakout target would be around $127,000–130,000, in line with the projection from the head of the pattern.

TradeCityPro | Bitcoin Daily Analysis #126👋 Welcome to TradeCity Pro!
Let’s dive into the Bitcoin analysis and key crypto indices. As usual, in this analysis I’ll review the potential triggers for the New York futures session.
⏳ 1-Hour Timeframe
As you can see on the 1-Hour chart, Bitcoin started a bullish move after breaking the 111747 resistance, which continued up to 118494.
✨ Currently, the price is consolidating after reaching that resistance and has formed a range box between 116829 and 118494, fluctuating within this zone.
💥 The RSI oscillator has exited the Overbuy zone and is now near the 50 level. If it drops below 50, there is a possibility of a deeper correction.
⚡️ Confirmation of a deeper correction would come with a close below the 116829 level. The next support areas will be Fibonacci levels, which I have marked on the chart.
✔️ Since the SMA25 has reached the candles and there is no significant momentum yet, we’ll need to wait for the SMA99 to approach the price to see if momentum enters the market.
👑 BTC.D Analysis
Looking at Bitcoin Dominance, yesterday it reached the 64.18 support level and managed to bounce back, closing above 64.44.
🔔 Currently, it’s consolidating above 64.81, and if this holds, the trend could turn bullish for now.
📅 Total2 Analysis
Total2’s main resistance is at 1.33, but the price was rejected at 1.3 and is now correcting toward 1.26.
🔍 If the correction continues, the 0.382 and 0.618 Fibonacci levels would be reasonable areas to watch. If the upward move resumes, the next target will be 1.33.
📅 USDT.D Analysis
Tether Dominance has had a steep drop from 4.72 and has now reached 4.36. If support holds at this level, we could see a correction back toward Fibonacci zones.
🎲 A break below 4.36 would confirm continuation of the downtrend.

BTC AI Prediction Dashboard - 6h Price Path (16.07.25)
BTCUSDT Forecast:
Crypticorn AI Prediction Dashboard Projects 6h Price Path (Forward-Only)
Forecast timestamp: ~10:15 UTC
Timeframe: 15m
Prediction horizon: 6 hours
Model output:
Central estimate (blue line): -119,635
Represents the AI’s best estimate of BTC’s near-term price direction.
80% confidence band (light blue): 119,101 – 119,820
The light blue zone marks the 80% confidence range — the most likely area for price to close
40% confidence band (dark blue): 118,473 – 120,801
The dark blue zone shows the narrower 40% confidence range, where price is expected to stay with higher concentration
Volume on signal bar: 153.73
This chart shows a short-term Bitcoin price forecast using AI-generated confidence zones.
Candlesticks reflect actual BTC/USDT price action in 15-minute intervals.
This helps visualize expected volatility and potential price zones in the short term.

TradeCityPro | Bitcoin Daily Analysis #124👋 Welcome to TradeCity Pro!
Let’s dive into the analysis of Bitcoin and key crypto indicators. As usual, I’ll review the futures triggers for the New York session.
⏳ 1-Hour Timeframe
On the 1-hour timeframe, as you can see, Bitcoin made a bullish move yesterday after stabilizing above the 109391 level and managed to register a new ATH around the 112000 level.
⭐ The resistance at 111747 has effectively held back further price increases, and the price has reacted to it and entered a corrective phase.
✔️ I believe the correction could continue down to 110256. The next lower support levels are 109391 and 107853.
📈 If you already have a long position open, I recommend holding it. If the 111747 resistance breaks, a strong bullish trend could begin, and having an open position from earlier could have a big positive impact on your account.
🔼 If 111747 is broken, we can consider opening new long positions. If this level breaks, I’ll post a higher timeframe analysis to identify the next major resistance levels.
💥 RSI entering the Overbuy zone and rising volume would provide strong confirmation for this position.
👑 BTC.D Analysis
Bitcoin Dominance is still dropping. Yesterday, after breaking 64.81, it continued its downward move and is now approaching the 64.49 level.
🔍 If this level breaks, the drop could continue further, but in my opinion, after the recent drop, it's time for BTC.D to enter a correction phase.
📅 Total2 Analysis
Total2 has also had a bullish move, breaking through the 1.18 and 1.2 levels, and continues to rise.
🎲 The next resistance is at 1.24, which the price may target. However, I think there’s a high chance of a correction or consolidation phase starting soon.
📅 USDT.D Analysis
Looking at Tether Dominance, after the recent drop and the break of 4.72, it reached the 4.63 level and has formed a base there.
✨ If 4.63 breaks, USDT.D could head toward 4.56. In case of a pullback, the first level to watch is 4.72.
❌ Disclaimer ❌
Trading futures is highly risky and dangerous. If you're not an expert, these triggers may not be suitable for you. You should first learn risk and capital management. You can also use the educational content from this channel.
Finally, these triggers reflect my personal opinions on price action, and the market may move completely against this analysis. So, do your own research before opening any position.
