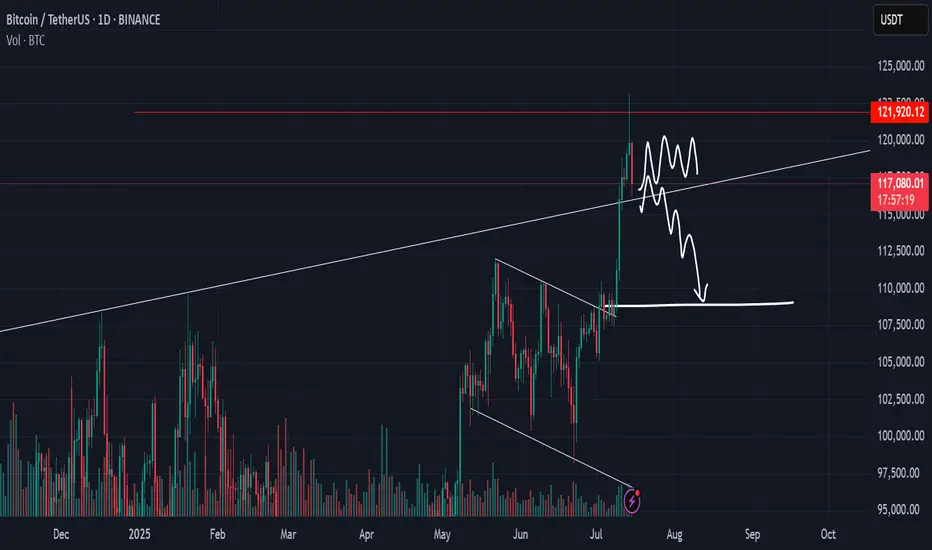
Bitcoin Wave Analysis – 16 July 2025- Bitcoin reversed from a support area
- Likely to rise to resistance level 122770.00
Bitcoin cryptocurrency recently reversed up from the support area located between the key support level 115000.00 and the support trendline of the daily up channel from June.
This support area was further strengthened by the 38.2% Fibonacci correction of the sharp upward impulse from July.
Given the clear daily uptrend and the strongly bullish sentiment seen across cryptocurrency markets today, Bitcoin cryptocurrency can be expected to rise to the next resistance level 122770.00 (top of the previous impulse wave i).
BTCDOWNUSDT trade ideas

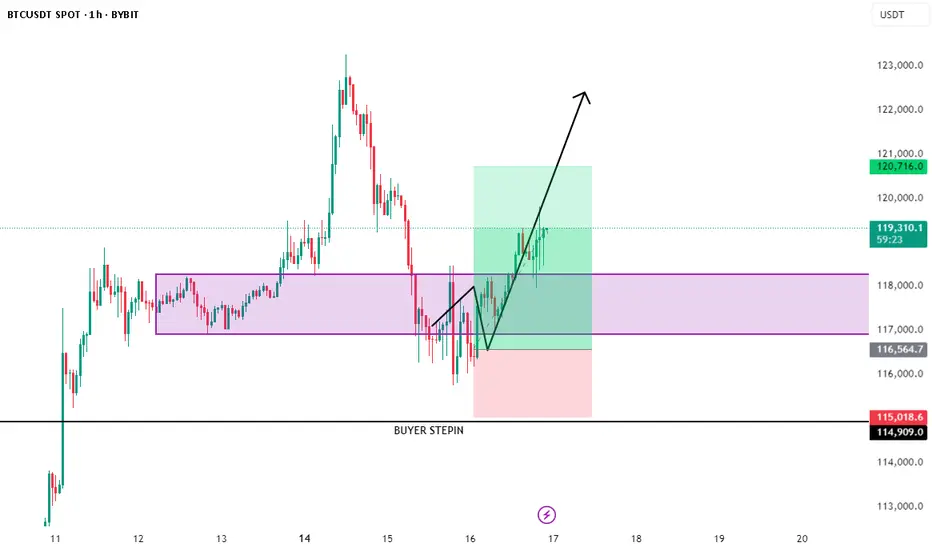
BTC/USDT Trade Update – July 16🚨 BTC/USDT Trade Update – As Planned! 🚨
Shared this setup earlier, and it’s unfolding exactly as expected. Hope you’re all locking in solid profits! 💸
🔹 Entry: BUYER STEP‑IN zone at 116.5 K – 118 K
🔹 Confirmation: Strong bullish engulfing from demand + reclaim of 118 K
🔹 Current Price: 119 K+ and climbing
🔹 Targets Ahead: 120.7 K 🔜 122 K 📈
📌 Why it’s working:
• Demand absorption after liquidity sweep
• V‑shaped recovery forming a higher low
• Increasing momentum + follow‑through volume
🔥 Riding the wave—letting profits run!
🔔 For more real‑time setups, follow 👉 @Ali15349323
#BTC #Bitcoin #CryptoTrading #PriceAction #Profits #TradingView
BTC 16.07.25Looking for LTF distribution to take out liquidity and create a MTF accumulation to then go higher.
Bitcoin Ranges While Altcoins Rise — Follow the Liquidity TrailHeyy traders, it’s Skeptic from Skeptic Lab! 💙 Dropping a red-hot update on Bitcoin and the crypto market to catch the next big wave. We’re diving into the Daily timeframe and market dynamics to track where the money’s flowing. here’s the play:
✔️ Daily Timeframe
As we flagged in my last Bitcoin chart, the $ 120,000 level is a liquidity magnet with heavy action. The July 14 candle tried breaking it but failed, leaving a downward shadow showing strong seller presence at this level. Plus, last week we hit the 4-week pivot point on the Weekly , and as expected, we’re now ranging around $120,000. Does this mean we ditch crypto? Big NO.
📊 Bitcoin Dominance (BTC.D)
Let’s zoom in on BTC.D —it’s gone sharply bearish, with yesterday’s candle screaming capital exiting Bitcoin. Traders who profited up to $120,000 are locking in gains and moving funds elsewhere. So, what’s the story?
Bitcoin broke its ceiling after 168 days, surging 10% to $122,000. Buyers took profits, pulling liquidity out.
Where’s the money going? Let’s test two theories:
USDT? Nope. USDT.D is also bearish.
Altcoins? Bingo! TOTAL2 (altcoin market cap) smashed its Daily resistance at 1.34 after months, signaling liquidity flooding into altcoins.
📉 Which Altcoins? Here’s the trick: check pair/BTC ratios . For example, to pick between Solana or Ethereum, compare S OL/BTC and ETH/BTC . The one with a stronger uptrend is soaking up more liquidity from Bitcoin.
🔔 Key Insight: This liquidity flow game is a game-changer for crypto traders. Want a full dominance tutorial? Let me know —it’ll show you how to track where the money moves and which coins get the most action.
🔼 Key Takeaway: Bitcoin’s ranging at $120,000, but altcoins are heating up as BTC.D drops. Hunt for altcoins with bullish pair/BTC charts to ride the liquidity wave. Risk management is your lifeline—cap risk at max 1%–2%. I’ll catch you in the next analysis—good luck, fam! <3
💬 Let’s Talk!
Which altcoin are you eyeing? Hit the comments, and let’s crush it together! 😊 If this update lit your fire, smash that boost—it fuels my mission! ✌️

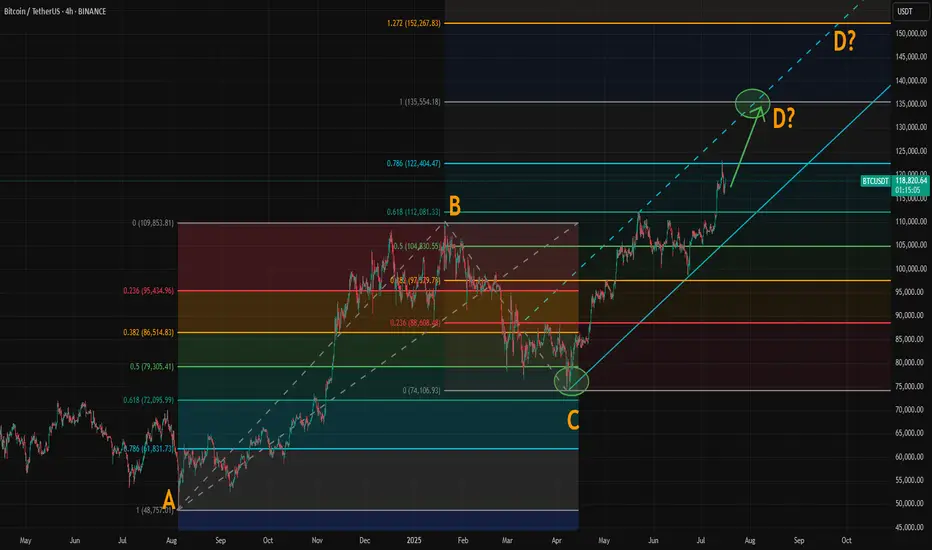
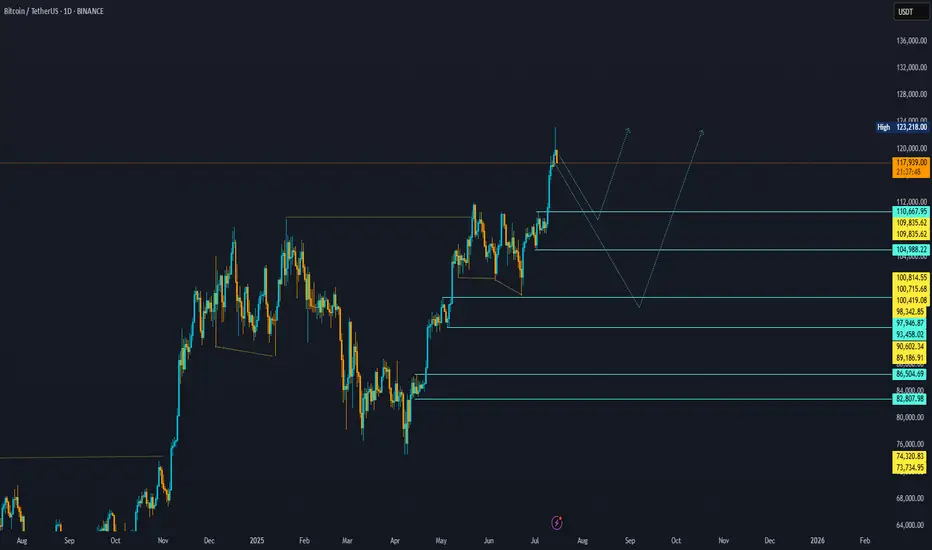
Where Could Bitcoin Make Its Cycle Top? Model and ABCD AlignedWith the breakout above resistance around 110,000, Bitcoin’s rally appears to be back on track. If you've been following our crypto analysis, either here or on our website, you’ll know our target range for this bull cycle is between 135,000 and 150,000, with the top of the range possibly extending further depending on the strength of the final wave.
Now, a possible ABCD pattern is forming, with point D potentially landing at either 135,000 or 150,000. A coincidence? Maybe, maybe not.
How Did We Arrive at the 135K–150K Target?
We based this range on historical halving cycle returns:
Halving Year - Return to Cycle Top
2012 - 9,076%
2016 - 2,122% (↓ 4.27x)
2020 - 541% (↓ 3.92x)
Two things stand out:
Each cycle has shown diminishing returns.
The rate of decline appears roughly consistent, dropping by around 4x each time—but slightly less with each cycle.
So depending on the multiplier used:
If returns fall by 4.27x again → target: 135K
If reduced by 4x → target: 140K
If reduced by 3.92x → target: 142K
If the rate of reduction itself slows (difference of 0.35 between 4.27 and 3.92) → target: 150K
While the sample size is too small, we believe the model holds reasonable logic with fundamental backing from various metrics.
The chart now shows a possible ABCD pattern:
If it becomes a classic AB = CD structure, point D could form near 135K.
If it becomes an extended ABCD (with CD = AB × 1.272), then point D could reach just above 150K.
These technical targets align closely with our halving model projections, increasing our confidence in the 135K–150K range as a likely top zone for this cycle.
Also, please check our earlier post for possible altseason start. A correlation between BTC/ETH and Gold/Silver might give some tips about possible Ether surge.
Where Is BTC Headed in the Next 7 Days?As Bitcoin (BTC) continues to dominate headlines, investors and traders are eager to understand its next move. With a current price of around $117,465 and a recent all-time high (ATH) of $122,980 on July 14, 2025, the cryptocurrency market is buzzing with excitement. Drawing from real-time data on social media platforms like X, web sources, and technical analysis, this article explores Bitcoin’s potential market direction over the next seven days, blending fundamental and sentiment insights for a comprehensive outlook. Whether you're a seasoned trader or a curious HODLer, here’s what you need to know about Bitcoin’s short-term trajectory.
Bitcoin’s Current Market Landscape
Bitcoin boasts a market capitalization of $2.34 trillion and a 24-hour trading volume of $88.63 billion as of July 16, 2025. Its market dominance stands at 62.92%, though it dipped slightly by 0.54% recently, hinting at competition from altcoins. The market is driven by strong fundamentals, including institutional adoption and supply constraints, but short-term volatility looms as traders monitor key price levels. Let’s break down the factors shaping Bitcoin’s path and forecast its movement through July 23, 2025.
Fundamental Factors Driving Bitcoin’s Momentum
Over 265 companies hold Bitcoin, with portfolios valued in the billions. Spot Bitcoin exchange-traded funds (ETFs) recorded $1.69 billion in inflows this week, reflecting strong institutional confidence in Bitcoin as a store of value.
The April 2024 halving reduced miner rewards, tightening supply—a pattern that has historically fueled bullish cycles. Analysts predict sustained upward pressure as demand grows against a constrained supply.
Bitcoin’s correlation with risk assets like the S&P 500 (0.73–0.90 in Q2 2025) underscores its role as a hedge against inflation and geopolitical uncertainty, amplified by recent U.S. policy shifts favoring crypto.
Over 95% of Bitcoin addresses are in profit, and declining exchange reserves suggest long-term holders are confident in higher prices, reducing available supply.
However, risks like profit-taking after the recent high and macroeconomic uncertainties, such as trade tensions, could introduce short-term fluctuations. These fundamentals set the stage for Bitcoin’s next moves.
Sentiment Analysis. Gauging the Market’s Mood
Market sentiment, gathered from online discussions and news, leans bullish with some cautionary undertones.
Recent analysis indicates that bearish sentiment often signals market bottoms, suggesting a potential bullish reversal. Whale accumulation amid retail uncertainty further supports optimism. Bitcoin’s sentiment score averages 82/100, with 45.49% bullish, 11.49% bearish, and 54.51% neutral commentary, reflecting high engagement.
Institutional enthusiasm, ETF inflows, and pro-crypto policy developments drive positive sentiment, particularly in the U.S. and Europe. However, concerns about price manipulation—evidenced by a +1,550% surge in related online searches—and potential profit-taking temper short-term optimism.
High trading activity during European hours (08:00–17:00 GMT) often extends Asian session trends, while weekends see increased volatility due to lower institutional participation.
The overall sentiment is bullish, with short-term bearish signals potentially creating buying opportunities for savvy investors.
Technical Analysis
Technical analysis across 15-minute (15m), 1-hour (H1), and 4-hour (H4) time frames offers insights into Bitcoin’s short-term behavior
15m and H1 Time Frames: Recent chart patterns show a rejection below $117,800, indicating a short-term bearish structure. Support lies at $115,000–$116,600, with resistance at $117,800–$118,000. Indicators like the Relative Strength Index (RSI at 68) and MACD suggest neutral momentum, with a bearish bias if Bitcoin remains below $118,000. A break below $115,000 could push prices toward $109,000–$110,000.
H4 Time Frame: The market is consolidating, with the 9-period Exponential Moving Average (EMA) catching up to price. The long-term trend remains bullish, supported by rising 50-day and 200-day moving averages. Overall, technical indicators rate Bitcoin as a “Buy,” with 13 Buy signals from moving averages and neutral oscillators, pointing to a potential retest of $120,000–$123,000 if support holds.
The charts suggest a bullish long-term trend with short-term consolidation, making support levels critical for traders.
Bitcoin Price Forecast for Next 7 Days
Synthesizing fundamental strength, sentiment trends, and technical signals, here’s Bitcoin’s likely direction by July 23, 2025
Bullish Scenario: If Bitcoin holds above the $115,000–$116,000 support zone, it could rally to $120,000–$123,000, fueled by institutional demand, ETF inflows, and positive sentiment. Rising moving averages and a bullish H4 trend support this, with analysts eyeing even higher long-term targets. A breakout above $118,000 could trigger a push toward the recent high or beyond.
Bearish Scenario: Short-term bearish signals on 15m and H1 time frames, combined with profit-taking risks, suggest a potential dip to $115,000–$116,000. A break below could target $109,000–$110,000, particularly if macroeconomic concerns or altcoin competition intensify.
Bitcoin may test $115,000–$116,000 in the next few days due to short-term bearish pressures, but strong fundamentals and bullish sentiment make a rebound to $120,000–$123,000 likely by July 23, 2025. Any pullback should be viewed as a buying opportunity, given the robust institutional and on-chain metrics.
Key Levels to Watch
Support: $115,000–$116,600 (short-term), $109,000–$110,000 (secondary)
Resistance: $117,800–$118,000 (immediate), $120,000–$123,000 (next target)
Catalysts: Keep an eye on ETF flows, macroeconomic developments (e.g., inflation, trade policies), and online sentiment for potential market shifts.
Bitcoin’s market is in a dynamic phase, balancing short-term volatility with a strong bullish foundation. Traders should monitor the $115,000–$116,000 support zone for signs of a bounce or further correction, while long-term investors can take comfort in the robust fundamentals driving Bitcoin’s growth. The next seven days could see BTC testing $120,000–$123,000 if key levels hold, though a brief dip is possible. Stay informed on market developments and be ready to seize opportunities in this exciting crypto landscape.
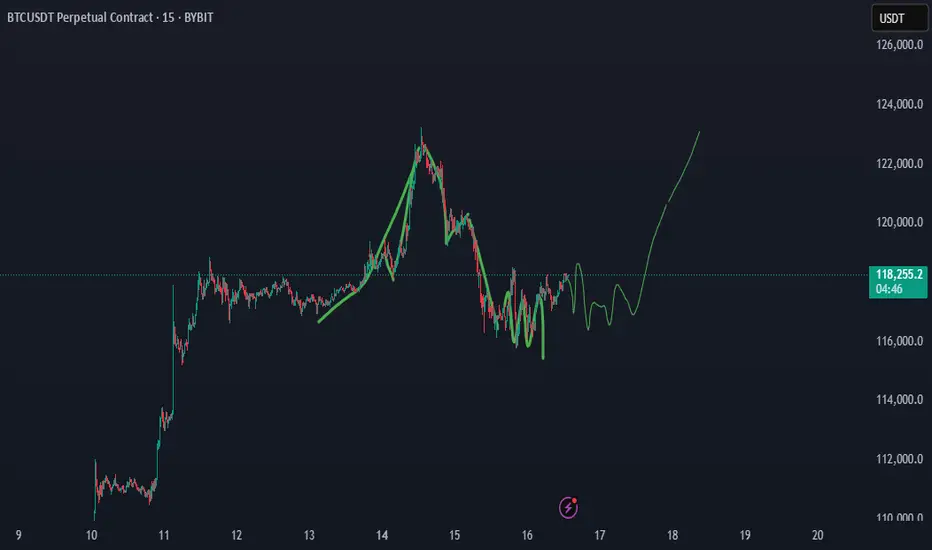
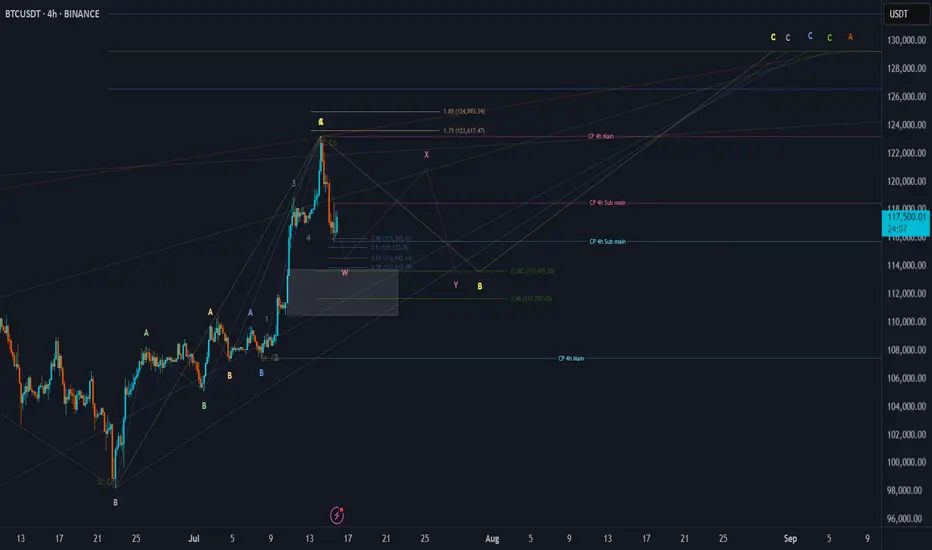
BTC Price Prediction and Elliott Wave AnalysisHello friends,
>> Thank you for joining me in my analysis. I think we have started the Yellow wave B as a micro correction. In my opinion, we will watch three waves wxy as in pink color, or it will extend to be an Irregular flat pattern where x will cross 123250
>> Till now, I am waiting to cross 118500 and stay above it after crossing for double the same time frame (my strategy).
keep like and support me to continue, See you soon!
Thanks, Bros
Bitcoin Next Breakout Pump?So far the $117k support seem to have held which is good news for the bulls. Now we should anticipate a reclaim of the $120Ks; this should form a pretty good double bottom for CRYPTOCAP:BTC to surge to $130Ks and more, of course.
BTCshort term sell positionDuring the retracement phase, there’s a good opportunity to take a short position

BTC price analysisDO NOT FORGET USING A STOP LOSS
Warning:
This is just a suggestion and we do not guarantee profits. We advise you analyze the chart before opening any position.
I hope you are always profitable

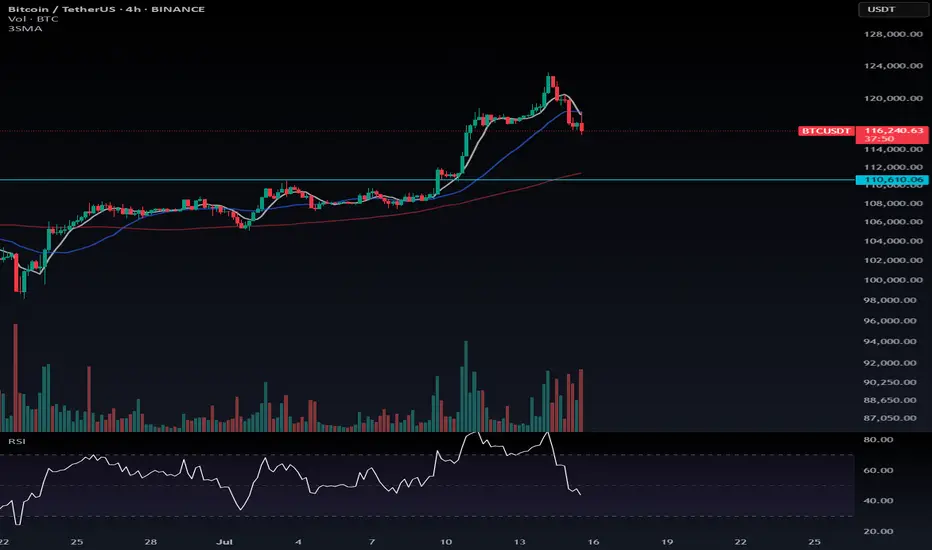
Don’t Fear Big Pullback Candles — We’re Still in a Bullish Trend🚀 Don’t Fear Big Pullback Candles — We’re Still in a Bullish Trend!
We’re currently in a long-term uptrend, so don’t let large corrective candles spook you. As long as Bitcoin stays above $110,610, there’s no reason to look for shorts. Be patient — let the market build its structure before it hands us a clean long trigger.
Right now, with BTC pulling back, BTC Dominance is also dipping, which is a bullish sign for altcoins. Instead of hunting shorts, focus on altcoins that are outperforming Bitcoin or showing bullish setups.
---
💬 Which alts are you watching right now? Drop your favorites in the comments!
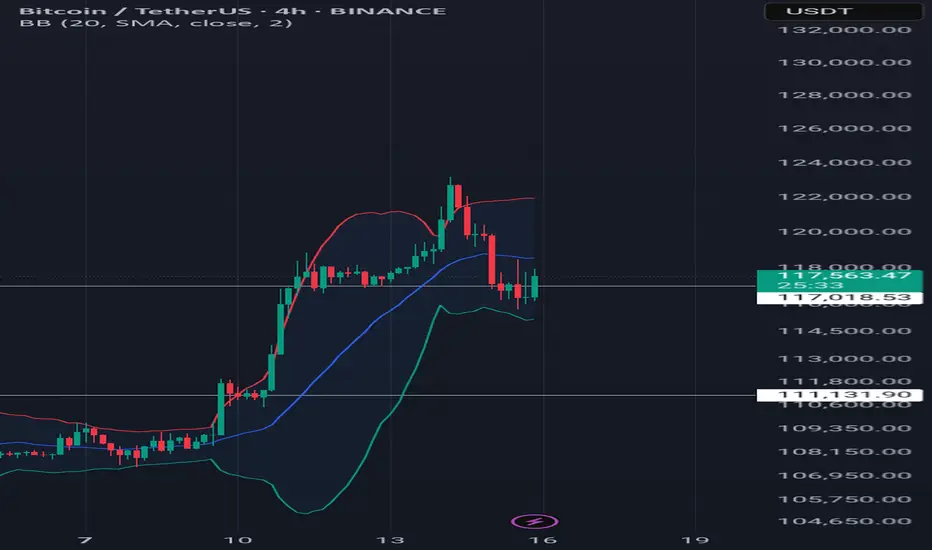
1d BTC current movement (quick info)Just a quick reminder. the current upper band of BINANCE:BTCUSDT of the past two cicles is being broken right now. if you zoom in you can even see a retest of this band now as support. if it holds, this could really mean a parabolic shift.
Will look into it further.

Bitcoin Eyes $200K: Why a Correction Could Come FirstAs Bitcoin continues its remarkable run, optimism is high that we could see BTC break the $200,000 mark this year. The momentum is there, with bullish sentiment across the crypto and traditional finance spaces. Yet, it’s important to acknowledge a potential short-term correction ahead before new highs are reached.
Why a Correction May Happen Soon
Several factors point to a volatile period in the weeks ahead:
Upcoming Tariffs: On August 1st, the new round of tariffs announced by President Trump is set to take effect. Trade disputes historically introduce uncertainty into global markets and can sap risk appetite, even in alternative assets like crypto.
Federal Reserve Policy: The Federal Reserve has not yet begun lowering interest rates. High rates continue to pressure both equity and crypto markets by making cash relatively more attractive and increasing the cost of leverage.
Geopolitical Tensions: Ongoing instability in the Middle East adds another layer of unpredictability. Geopolitical flare-ups often lead to market volatility as investors act defensively.
The Takeaway
While Bitcoin is on track to reach unprecedented levels this year, investors should remain mindful of the broader market context. Short-term corrections are part of any healthy bull run and can be driven by macroeconomic and geopolitical events. Staying informed and maintaining a disciplined approach will be crucial for navigating what promises to be an exciting—and eventful—rest of the year.
Not Investment Advice!
#crypto #bitcoin #short #correction #dump #uncertainty #volatility #war #news #bearish

BTC Scenario for this daysHere’s my BTC/USDT analysis.
Hello everyone 👋
❓Has something strange happened today?
Well, on the daily timeframe, we’ve had one red candle after five consecutive green candles — maybe that’s it?
Many traders wanted to take some profit after the recent bullish run.
Also, the transfer of 40,000 BTC to an exchange by a whale likely acted as a trigger for that sell-off.
🟡 So what now?
✅ As long as BTC stays above 110,000, the bullish scenario remains valid.
If price drops below 110,000, we’ll need to reassess based on dominance metrics before making any bearish decisions.
Still, under 110K, I’ll start considering potential short setups.
📍There is a strong support zone between 115,000 – 116,000 for long positions.
If that zone breaks, a drop toward 110,000 is likely.
On the other hand, a rebound from 115K – 116K and a retest of 122,000 is still on the table.
🔄 There’s also a chance BTC will consolidate in the current range for a while.
🚀 Finally, a break above 120,000 opens the door for a move toward 130,000 as the next major target.
---
🙏 Thanks for reading!
If this analysis was helpful, hit the 🚀 icon to support the post.
#BTC Update #7 – July 15, 2025#BTC Update #7 – July 15, 2025
Bitcoin is currently within the consolidation zone where it previously paused during its last upward move. From this zone, it had previously bounced and created a new all-time high. It is now undergoing a correction, and the level it has reached aligns with the 0.382 Fibonacci retracement, which is perfectly normal for a first stop in a correction.
If the correction continues, the second stop could be around $114,795, and the third around $113,012. If it reaches these levels, it will have filled at least half of the imbalance created during the previous rally.
Looking at the volume, I anticipate that Bitcoin might start to bounce from this level. If it manages to break above the $122,666 zone, the next target would be around $127,172.
I do not plan to buy Bitcoin here unless I see a high-volume green candle. However, if Bitcoin breaks above the $118,900 level with strong volume, a long position might be considered, as the target would likely shift toward the $127,000 range.

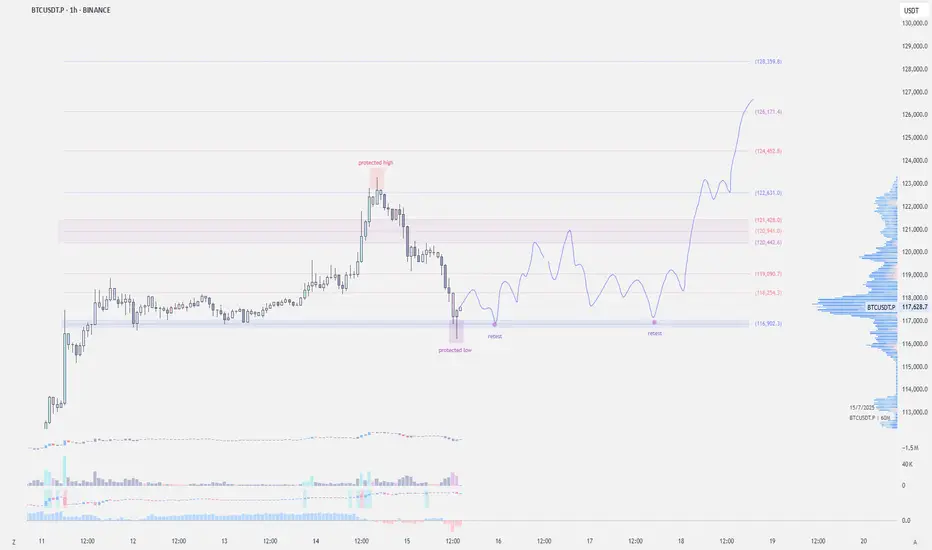
BTCUSDT.P liquidity analysis🟠 CRYPTOCAP:BTC
📄 This analysis is for liquidity and comparing supply and demand ratios
🚨 We start by noting that actual selling pressure began at 121826 and this ratio increased as it dropped below 119723
📄 Any daily close below 117612 will increase this pressure, which is logical after such a rise, specifically in Bitcoin
⭕️ The two closest important levels with liquidity and buying strength are at 114813 and 110623
◀️ The current rebound from 116114 (the lowest point Bitcoin has reached currently at the time of writing this analysis) is insufficient in terms of liquidity and needs more momentum, and attention here should be on the level 117612
📄 The current movement is between 117612 - 114813, the range where Bitcoin stabilized before achieving the historical peak, and thus maintaining this range will provide a boost for a larger rise

It stopped (resisted) where the AI said it would! Very Exciting!Witness the precision: Price hit resistance exactly as predicted by AI analysis. Thrilling confirmation of my AI tech-driven trading insights!


Bitcoin, its time to short full leverage ?this idea still great
now bitcoin ranging or auto dump ?
short full leverage when retesting on resisten is great
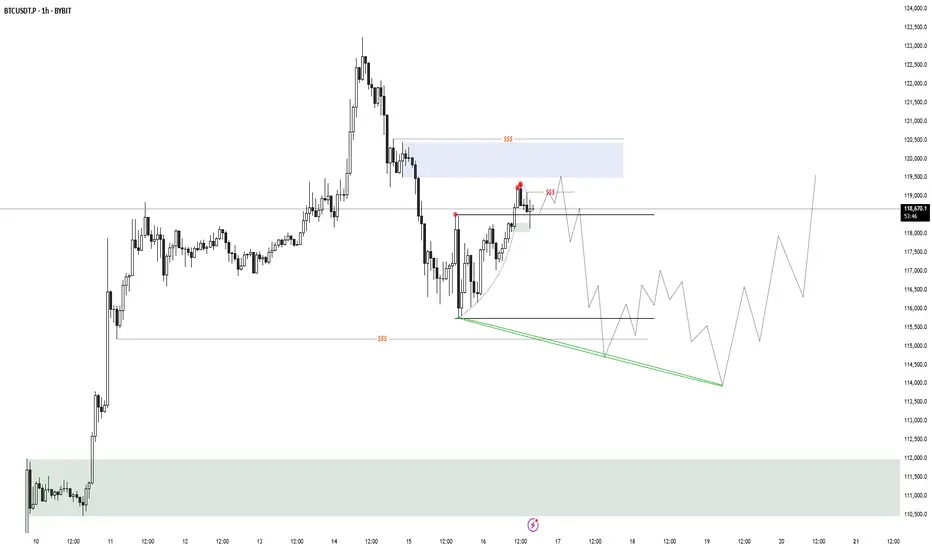
$BTC - LTF OutlookCRYPTOCAP:BTC | 1h
We're establishing a new value area here
Looking at a potential ltf setup:
If 116.5k holds as base support, targeting a move toward 120.5k–121.4k (immediate supply zone)
Similar to past price action, we might see a few pushes before breaking through ltf supply.
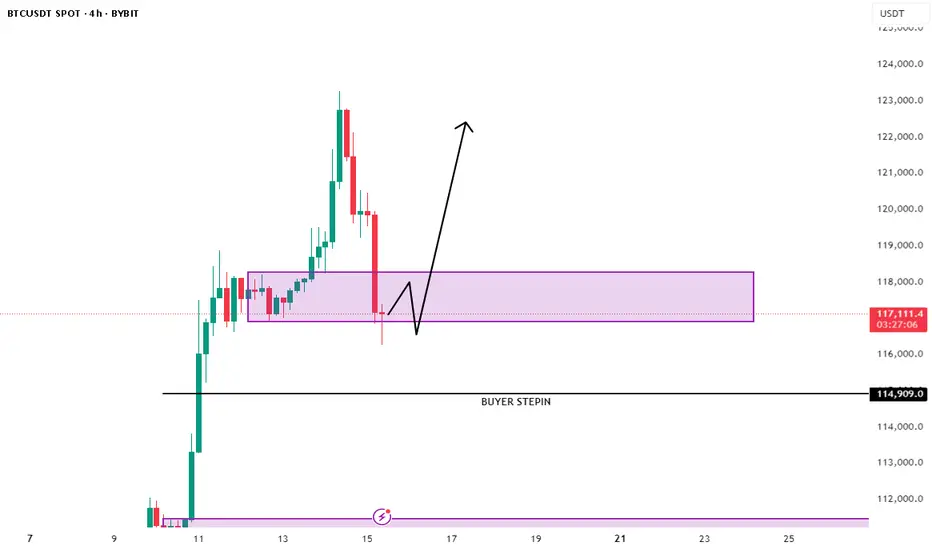
BTC/USDT Long Position Plan🔥 BTC/USDT LONG IDEA (4H CHART)
Published by: Ali15349323
Timeframe: 4H
Exchange: Bybit Spot
Date: July 15, 2025
📊 Analysis Summary:
Bitcoin is pulling back after a strong impulsive move upward. Price has now entered a key 4H demand zone between 116,200 – 117,300, which previously acted as a consolidation base before the breakout.
We are now watching for a potential long entry in this zone, with a bounce confirmation and invalidation criteria clearly defined.
📌 Trade Plan (Long Setup)
Entry Zone:
🔹 116,200 – 117,300 USDT
🔹 Price is currently reacting within this support range
Stop Loss (Invalidation):
🔹 Below 114,900 USDT
🔹 A 4H candle close below this level would break structure and invalidate the setup
Take Profit Targets:
🔹 TP1: 121,000 – Local resistance
🔹 TP2: 123,000 – 124,000 – Imbalance fill zone
🔹 TP3 (Optional): 125,500+ – If momentum continues
🧠 Reasoning Behind the Trade:
✅ Strong demand zone with historical reaction
✅ Wick rejection from the lower boundary, showing early buyer interest
✅ Price structure still bullish unless 114.9k breaks
✅ Previous sell-off likely triggered liquidation — now a chance for recovery bounce
⚠️ Invalidation Criteria:
❌ A 4H candle close below 114,900 signals demand has failed
❌ In this case, the setup is no longer valid — next demand sits around 111k – 112k
🧾 Summary:
We’re looking for a bullish continuation if BTC holds above the current demand zone. A sweep-and-reclaim structure could give confirmation. If the zone fails, no trade — we step aside and wait for deeper support.
📣 Don’t forget to:
🔁 Like & Share
🧠 Follow me @Ali15349323 on X for more trades
#BTC #Bitcoin #Crypto #LongSetup #TechnicalAnalysis #TradingView
BTC next bull run after taking restAs is clear, BTC has made a new high, and we should wait for the next bullish entry after a retracement.
BTC — Long from Support Box (#4h) | BULLISH1. Buy: Limit order 115.5k–116.6k
2. Alert: If close < 113k, scenario invalid
3. Target: 125k
