How many bag holders will BTC leave behind?We've had our fun and some fake pumping from the short squeeze. No comes the real stuff! What are the fundamentals and what problem is BTC trying to solve? Ok, crickets. It's a speculative asset, that's it. If history repeats itself, which it typically does, we will see a major pull back and anyone who's bought at the top will have a negative performing portfolio. It's too expensive and you still can't buy a banana with BTC and there are plenty of middlemen involved, which goes 100% against it's original purpose (after the financial crisis).
If you're up, this would be a good time to sell IMHO and buy at the next support level, which is way below 100k.
BTCDOWNUSDT trade ideas

Bitcoin Go 130k Now you just have to take a long position and the whole market will be pumped.
Bitcoin 130k __134k

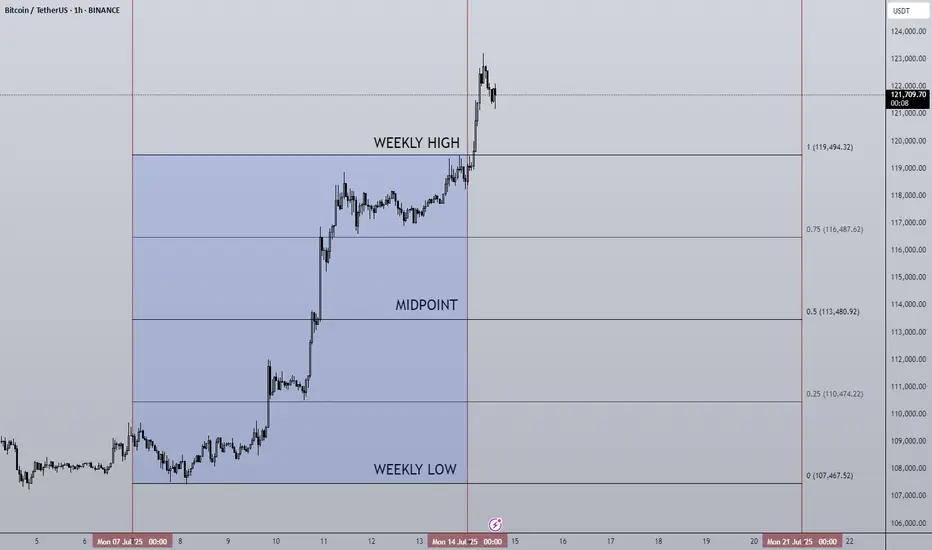
14/07/25 Weekly OutlookLast weeks high: $119,494.32
Last weeks low: $107,467.52
Midpoint: $113,480.92
NEW BTC ATH!
This is what we've all been waiting for, BTC breaks through resistance at $110,000-112,000 to set a the highest weekly close ever ($119,086). Thanks to a further $2.27B net inflows via BTC ETFs, the passing of the "big beautiful bill" flipping from a more deficit reduction stance by the US to an environment perfectly suited to risk on assets. Things are looking good for Bitcoin.
This week already in the Asia session BTC has broken above the weekly high to hit $123,100. Despite this incredible rally BTC.D has been falling since Thursday of last week. To me this signals altcoins have started to play catch up and we've seen that with ETH breaking $3000 (+14% relative to BTC).
I would like to see BTC consolidating here above the weekly high while altcoin majors break their choppy rangebound environments and shift to a trending environment just as BTC had last week.
There are also major data releases this week:
Tuesday CPI
Wednesday PPI
Thursday Euro CPI
Thursday US Initial Jobless Claims
I do not expect these data releases to have a major effect on the markets in their current state due to the risk appetite we've seen in both crypto and equities, such shallow pullbacks prove the demand is there to absorb and sell-side pressure for now.
Now is an excellent time to back strong projects with great fundamentals that are breaking out from downtrends/ranges in both their USD & BTC pairs, as BTC.D drops alts can print some great returns. Beta plays of ETH & SOL can offer higher returns than the majors themselves in these market conditions too.
Good luck this week everybody!
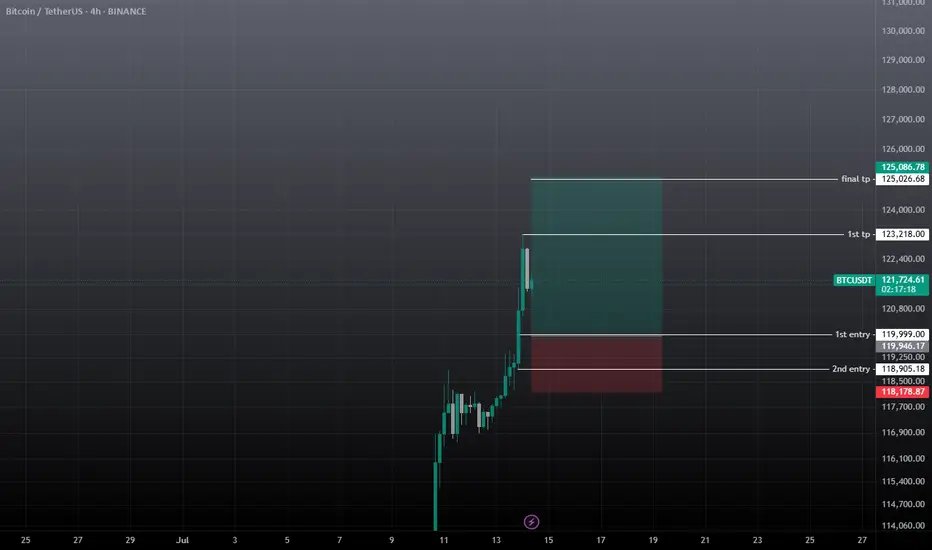
BTC BUY / LONG SCALP TRADEWait for the entry to be filled, must use SL and don't use high margin on any trade. If TPs achieved first then ignore the trade.

btcusdt buy / long scalp setupWait for the entry and must use sl on all trades, if tp achieves first then ignore it.
Long Target UpdateSince there was more info in the price action, I updated my last view of it. I expect a 5th wave extension and a deep pullback. Be careful if we reach +130k and hold the sl tight and observe if any structure for changing trend is forming.

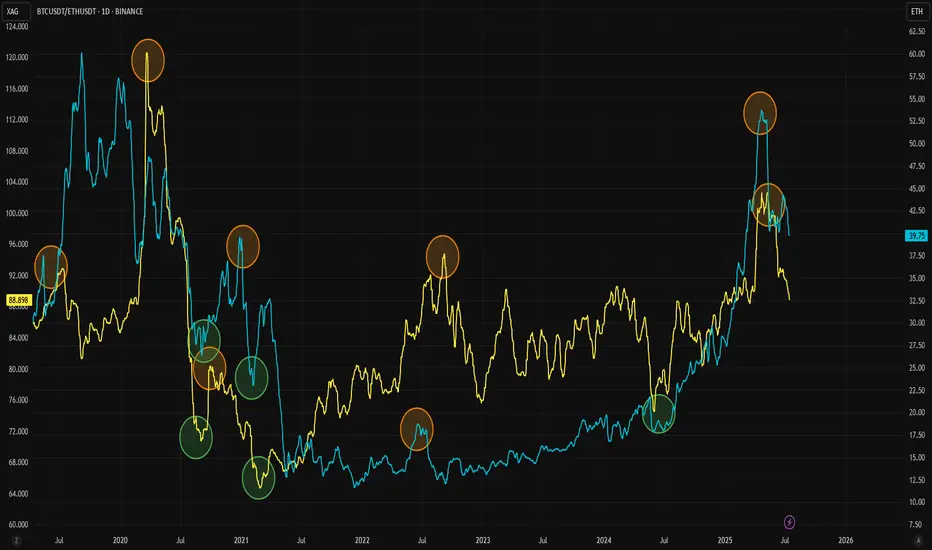
Want to Know What Happens in Crypto? Check Silver InsteadThe Gold/Silver ratio is one of the key indicators that highlights major turning points in modern economic history. Similarly, the ETH/BTC ratio is widely followed as a gauge of strength in the crypto market and the beginning of altcoin seasons. Interestingly, these two ratios also appear to correlate well with each other.
As adoption of both Ethereum and Bitcoin has grown, the Gold/Silver and BTC/ETH ratios have started to move more closely together. They often follow similar patterns, with tops and bottoms forming one after the other. For clarity, this analysis uses the BTC/ETH ratio rather than ETH/BTC.
Historically, BTC/ETH tends to lead during market tops, followed by a similar move in the Gold/Silver ratio. This pattern has been observed repeatedly since 2020. When it comes to bottoms, the timing between the two ratios is usually tighter, as seen during the 2020, 2021, and 2024 lows.
The latest signal came from a top in the BTC/ETH ratio, and the Gold/Silver ratio now appears to be following that move. Given the cyclical nature of crypto markets, both ETH and silver could be at the early stages of new upward trends. For a potential trend reversal, it may be wise to keep a closer eye on silver in the coming weeks.
BTC Hits Channel Ceiling – Smart Money Taking ProfitsBINANCE:BTCUSDT.P
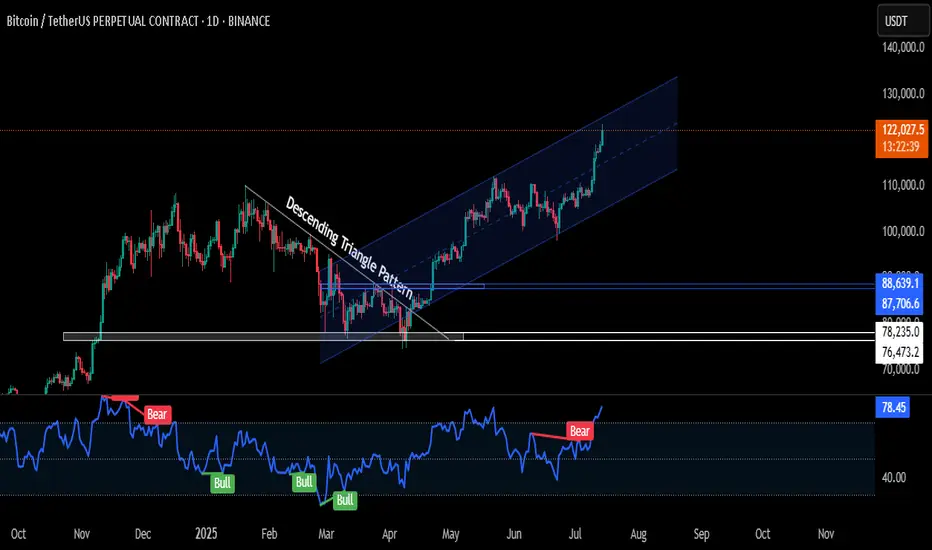
🚨 BTC has cleanly broken above $120K, tagging $123,300 today (ATH) — pushing the top boundary of a well-respected rising channel that’s been in play since April.
🔍 Analysis:
Structure & Trend:
Price broke out of a Descending Triangle back in March — that move initiated a trend, not just a spike. Since then, BTC has followed an ascending channel, showing institutional-style demand: controlled, aggressive, and layered.
Current Price Action:
We’re at the upper edge of the rising channel, where many traders either:
- Exit early out of fear of reversal,
or
- Chase breakout longs, often just before a shakeout.
Smart trading now = discipline, not FOMO
If BTC fails to hold above $120K, expect a cool-off to the channel midline around ($111K–$112K) or even lower.
🧠 What to Do as a Trader:
Already in from Lower?
This is your TP zone or trailing stop region. Don't get greedy.
Protect capital. Re-enter on retest or new setup.
Looking to Enter Now?
Not ideal. Let the chart either break and retest cleanly OR
pull back to mid-channel ($112K area) for a high-R:R setup.
📌 Summary
BTC is bullish — no denial. But this is the zone where pros reduce risk and wait for confirmation, while most retail enters blindly.
Don’t be the liquidity.
✅ Follow for more real-time updates
🔁 Share it with your fellow traders
🚀 And hit that Boost button to support the work!
Let’s trade smart, not emotionally. 💯
#CMPInsights
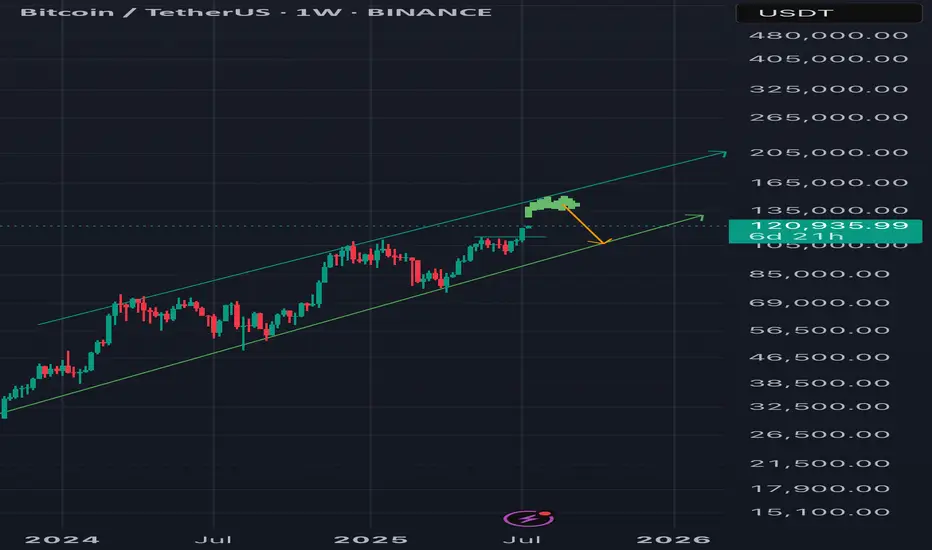
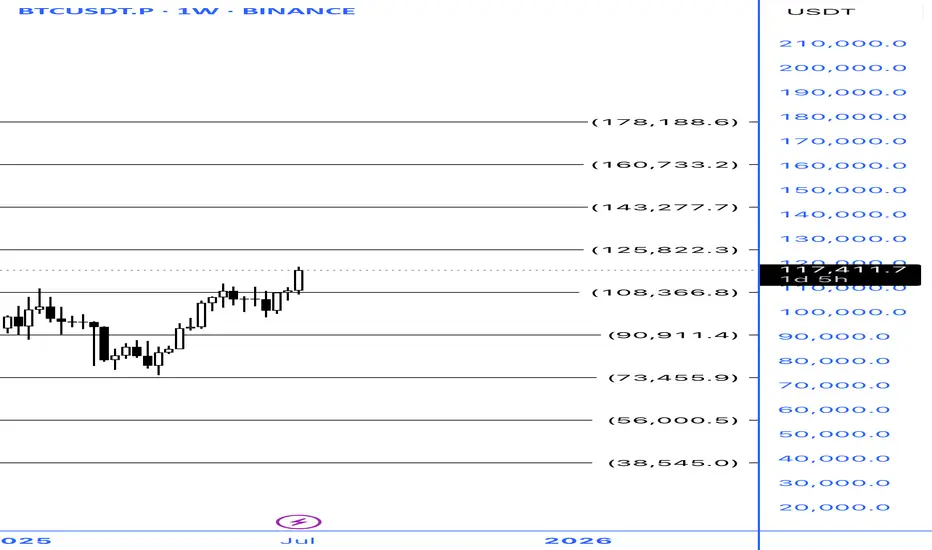
BITCOIN BREAKS YEARS LONG ASCENDING TRENDLINE RESISTANCEThe recent surge in the price of Bitcoin has led to the break of years long ascending trendline resistance as can be seen on Weekly BTC chart.
The price of BTC can soar higher above this resistance level and can take support from this level to mark a successful breakout.
Breakouts like this does create FOMO among traders but trading such breakouts must be done with caution as the price can still fall under the resistance level.
Best of Luck!!

It is possible that Bitcoin is finishing wave 4It is possible that
Bitcoin is finishing wave 4
Will expand to wave 5
The target is more than 250,000 dollars

btc buy longterm"🌟 Welcome to Golden Candle! 🌟
We're a team of 📈 passionate traders 📉 who love sharing our 🔍 technical analysis insights 🔎 with the TradingView community. 🌎
Our goal is to provide 💡 valuable perspectives 💡 on market trends and patterns, but 🚫 please note that our analyses are not intended as buy or sell recommendations. 🚫
Instead, they reflect our own 💭 personal attitudes and thoughts. 💭
Follow along and 📚 learn 📚 from our analyses! 📊💡"

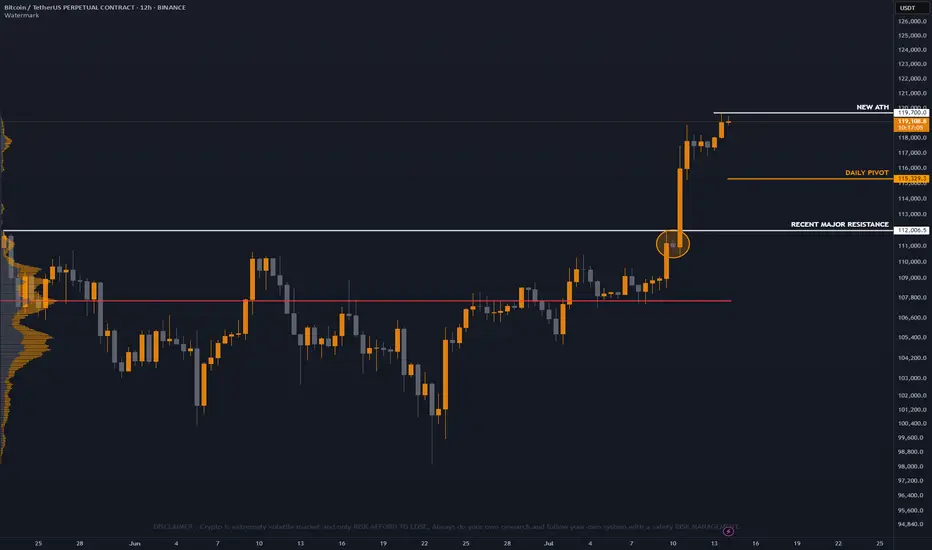
Bitcoin's Macro View: The Next Major Resistance ZoneAnalysis of the Daily Chart
This is the daily (1D) chart for Bitcoin (BTC/USDT), which shows the "big picture" trend over many months.
1. The Significance of the Breakout
You are correct to highlight the breakout. After consolidating for months and forming a solid base since April 2025, Bitcoin has now decisively broken out to new highs for the year. This is a very strong bullish signal on a macro scale, indicating that the long-term uptrend is accelerating.
2. The Immediate Resistance: The Green Zone ($128,000 - $132,000)
After such a powerful move, the next major obstacle is the area marked by the green box on your chart.
What is this zone? This area, approximately between $128,000 and $132,000, represents a major historical resistance or supply zone.
Why is it important? This is likely a price level where significant selling occurred in the past. As the price returns to this zone:
Traders who bought at the previous top may look to sell to get their money back ("break-even selling").
Bulls who have been riding the trend up from the lows may see this as a logical area to take profits.
New sellers may view it as an opportune level to open short positions.
What to Expect
When the price enters this key zone, we can expect a significant reaction. It is the next major battleground between buyers and sellers. Watch for:
A slowdown in the upward momentum.
A period of consolidation or sideways price action.
A potential rejection or a significant pullback from this area.
A clean and powerful break above this $128k - $132k zone would be an exceptionally bullish event, signaling a high probability of continuation towards new all-time highs.

Btc usdt idea I think Btc will top around 140k and alt season will start at the distribution phase . we are so close for the money to start moving to the eth and other alts . pick wisely the time will arrive very quickly
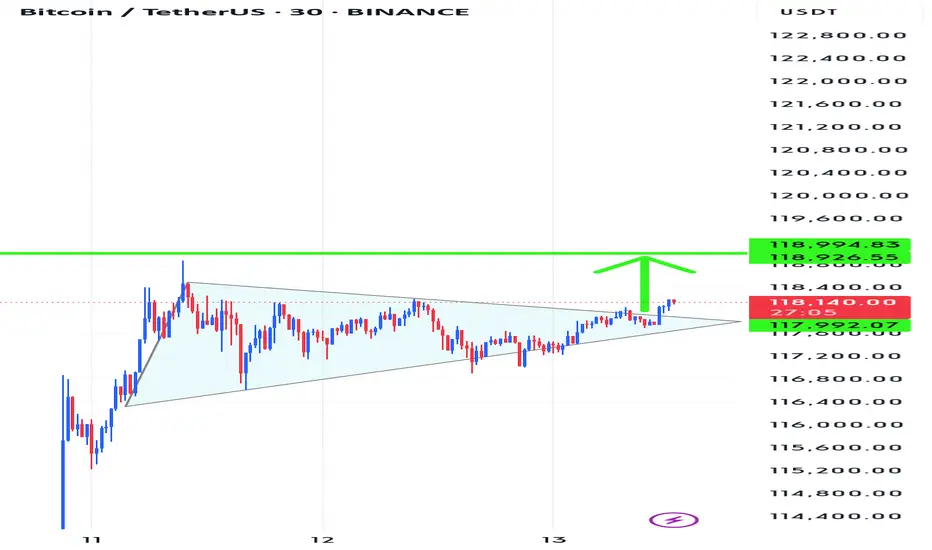
Btcusdt 4hr timeframe, bullish iH&S patternComming from shorters take profit area, formed a bullish ih&s pattern. If closes above 108725 in 4hr time, may activate the pattern.
Targets are 111500, 115000 and 120000
Invalidation if closes below 105k

Bitcoin Update H12 Timeframe
New All time high unlocked again this time at 119700 area ! 🚀
Take note panda fam there's a unfilled gap below on bitcoin price still consider correction below is still possible, Above ATH price is discovery price panda fam.
But as of now since BTC is on fire and hype, Buyers volume are still strong this time, Trade safe always panda fam will focus on altcoins scalp trade. 🔥
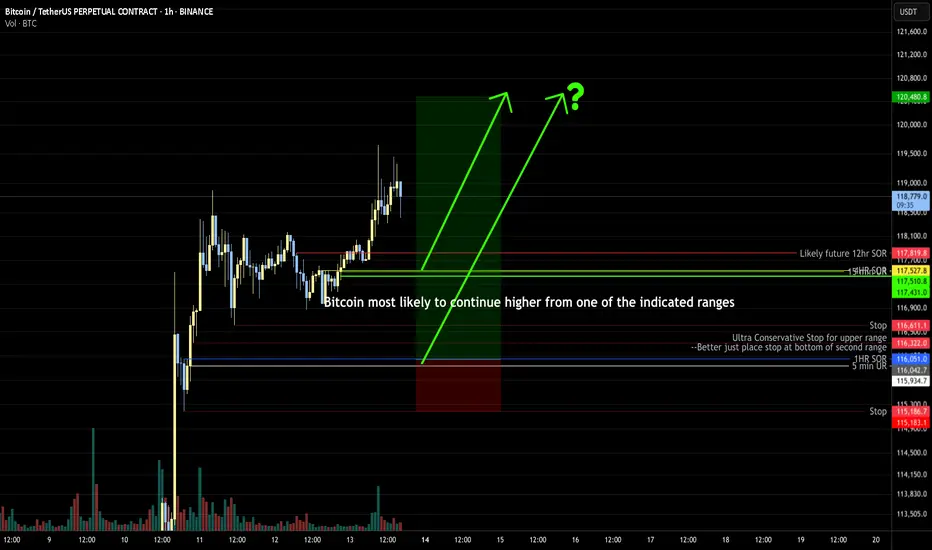
Bitcoin Overall: higherBitcoin most likely to continue higher from one of the indicated ranges. It may be best to split a trade 1/2 entry on one and 1/2 entry on other with stop below the second, or 2 trades with 1/2 normal risk.
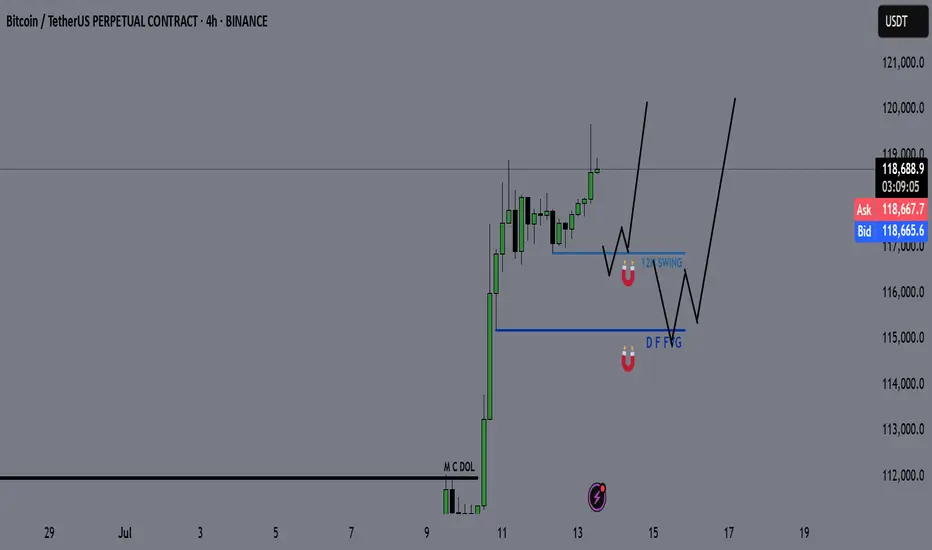
Bitcoin - BTC | Weekly Market Recap & Outlook 13.07.2025What Happened Last Week?
Bitcoin broke out of the recent downtrend structure and established a bullish leg with clear momentum.
The breakout was supported by volume and price structure, suggesting a trend reversal rather than a temporary deviation.
Weekly Bias and Strategy
The current outlook is bullish.
A retracement or sideways consolidation between the $120,000 and $114,000 zone is possible.
This zone may act as accumulation before further upside.
Key Points of Interest (POIs):
12H Swing Liquidity (turquoise line)
Daily FVG (blue line)
These levels will be monitored for long setups with confirmation on lower timeframes.
Macro Consideration – Fed Chairman Jerome Powell
Recent market speculation has increased regarding Jerome Powell potentially stepping down as Chair of the Federal Reserve.
If such a resignation is confirmed, it may act as a significant bullish catalyst for Bitcoin and other risk assets, possibly accelerating upside without allowing for any meaningful pullback.
Summary
• Bullish breakout confirmed
• Long bias maintained unless major invalidation occurs
• Watching retracement levels for entries
• Macro catalyst (Powell resignation) may trigger strong continuation without retrace
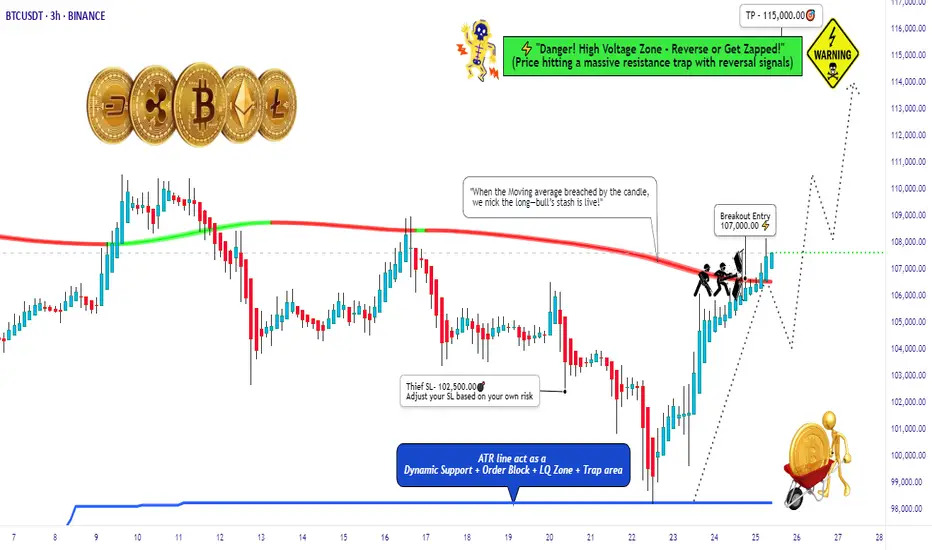
BTC/USD Thief Breakout at $107K – Eyeing $115K!🚨 Thief Entry Setup: BTC/USD Breakout Play 🚨
Overview:
Jump in after the $107 000 breakout—aiming for $115 000 with a tight “Thief SL” at $102 500. Adjust the stop‑loss to match your personal risk tolerance.
🧠 Setup Summary
Pair: BTC/USD
Entry trigger: Breakout above $107 000
Stop‑Loss: “Thief SL” at $102 500 (use your own risk‑based SL)
Target: $115 000
🎯 Why This Setup?
Clear breakout level at $107 000 = fresh momentum
Tight SL cushion (≈‑4.3%) = defined risk
Target ≈ +7.5% potential = strong reward-to-risk (~1.75:1)
📏 Risk Management Tips:
Only risk a small % of your capital—never exceed your comfort zone.
Move your SL to breakeven once mid‑target is hit to lock in profits.
Trailing your stop‑loss could secure bigger gains if BTC surges toward $115 000.
BTCUSD IS still bullish? Yes sure
Hi dears
I think Bitcoin is continuing to rise. The first target is probably $120,000 and then $140,000.
What do you think?
If you agree with me, please like and comment.
Thank you.
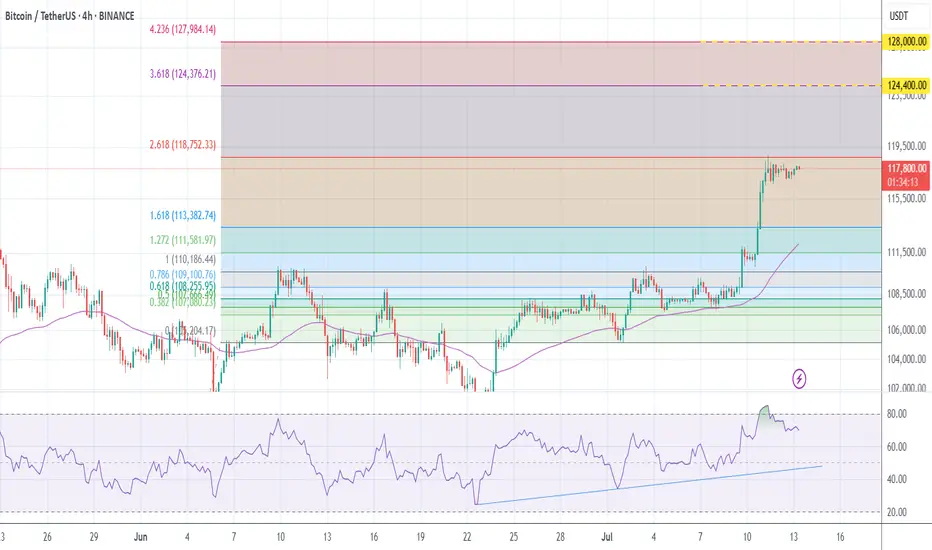
#Buy Bitcoin H4This trading system based on Divergency and fibo level
Bitcoin has reached the target level of 2.62 and in the continuation of the upward trend has the potential to reach the levels of 3.62 and 4.23 at prices of 124,400 and 128,000 and then the end of the story.
Bitcoin goes higher! Hello lads. I’m expecting BTC to go much higher than people say. The price is respecting the extensions range
BTCUSDT | Bullish | Going to make new highs.BTCUSDT is in bullish trend and its parabolic move paves way for new highs.It will print new higher low and make the second leg of the trend.Thus it will continue its bullish trend until unless it breaks its higher low.

BTCUSDTIf Bitcoin's weekly timeframe is modeled according to the previous step, it can go up to $120,000 for the first target, according to the previous analysis, but the second target could be in the range of $137,757 to $144,000.
