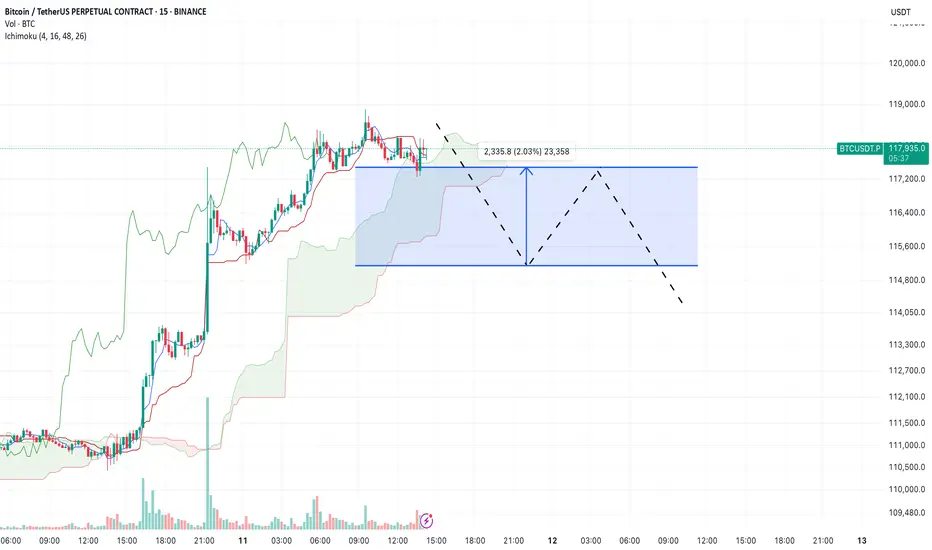
Continued Bitcoin AnalysisAccording to the exact analysis, Bitcoin fell to the specified range and is currently on an upward path. You can follow the rest of the analysis in the main analysis updates.
Sasha Charkhchian
BTCDOWNUSDT trade ideas

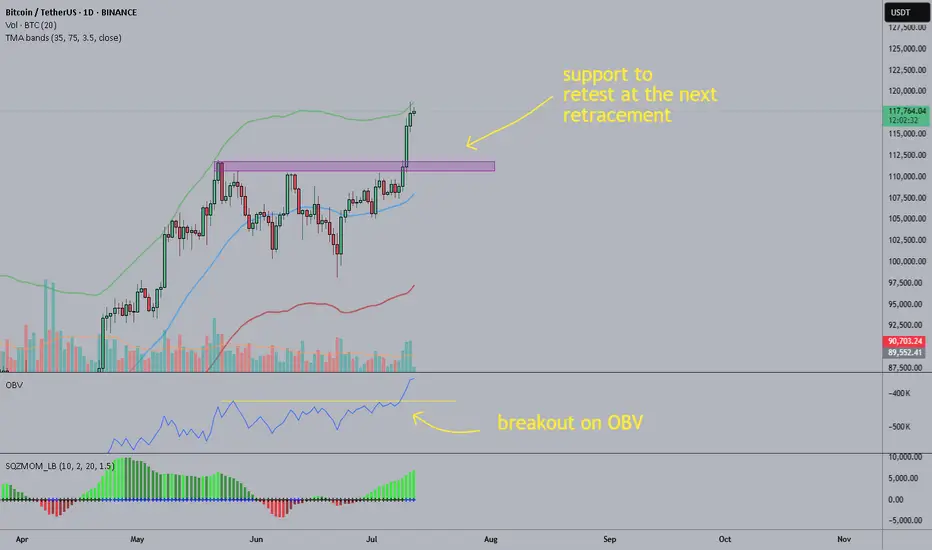
BTC: the breakout should be legitAs you can see the breakout had 3 days of rising volume and OBV also broke out so it should bne legit. On daily the upper band of the TMA bands is being tested, probably soon we'll see a retracement, I suppose the former resistance is now the support to test, however if the euphory continues we could see another peak of the price while RSI stays below the "overbought zone".
I'd look at opportunities to short although I usually don't trade BTC, I use it mostly as indicator on when to buy alts.
Good luck
Bitcoin flightpath: great vs good1D timeframe.
There are 2 signs that the price of Bitcoin is about to explode:
1. We have broken above the ATH
2. BTC peaks Nov-Dec in historical halving cycles 2013/2017/2021
And there are 2 paths that could play out.
1. Great.
BTC has touched an uptrend (white line with 3 x red crosses). A break above this uptrend + a weekly candle close above 110K could result in a parabolic run to the upside with a target estimate of 246K. A bounce off the uptrend could be a good long entry.
2. Good
We break below the uptrend represented by the thick white line and said line begin to act as resistance. This would result in a higher high estimated at 125K. A bounce off 95K could be good long entry.

BTCUSDT: Breakout Confirmed, Bulls in ControlThe primary technical feature here is a well-established ascending channel that has been guiding the price higher for several months. The market has respected this structure with remarkable precision, using the lower green bands as a launchpad and the median red line as a dynamic point of interest.
The Bullish Breakout:
What demands our attention now is the recent price action. After a multi-week consolidation period, where price traded within a range between roughly 100,000 (Down) and 110,000 (Up), we have witnessed a decisive breakout. This is a classic continuation pattern, signaling that the bulls have absorbed the selling pressure and are ready to push for the next leg higher.
Key Support: The breakout level, marked as the Key Support Area around 110,000, is now the most critical level to watch. What was once resistance is now the primary floor. As long as the price holds above this zone on a daily closing basis, the immediate outlook remains firmly bullish.
Next Target: With this breakout, the path is cleared for a test of the upper boundary of the ascending channel. The recent high near 117,500 is the first hurdle, but a sustained push could see price targeting the 125,000 level and beyond in the coming weeks.
The Bearish Invalidation:
For this bullish thesis to be invalidated, we would need to see a clear sign of weakness.
The first warning shot for the bulls would be a failure to hold the Key Support Area, with the price closing back inside the previous consolidation range below 110,000.
A definitive shift in the trend would only occur with a break and close below the primary support of the entire ascending channel.
Conclusion:
The technical picture for Bitcoin is strong. The recent breakout from a defined range within a larger uptrend is a high-probability bullish signal. The path of least resistance is up. The strategy is to look for continued strength as long as the price remains constructive above the 110,000 support zone.
Disclaimer:
The information provided in this chart is for educational and informational purposes only and should not be considered as investment advice. Trading and investing involve substantial risk and are not suitable for every investor. You should carefully consider your financial situation and consult with a financial advisor before making any investment decisions. The creator of this chart does not guarantee any specific outcome or profit and is not responsible for any losses incurred as a result of using this information. Past performance is not indicative of future results. Use this information at your own risk. This chart has been created for my own improvement in Trading and Investment Analysis. Please do your own analysis before any investments.

BTC/USDT – Intraday Reflection & Plan (15m, Ichimoku) by RiscoraYesterday was a fantastic bullish day, but price never reached my planned long entry block — buyers were too strong for a proper retest.
At this stage, I believe the bullish impulse has run its course and we’re likely to see a sideways phase, as marked on my chart. I don’t expect new highs from here: the market is overcrowded with longs, and this rally needs to cool off.
My base case is that BTC consolidates in this range for a while, with price chopping back and forth to unwind the excess leverage.
I’ll be watching for signs of distribution: a rising wedge or a deeper pullback can’t be ruled out, but I’ll wait for clear signals from indicators and market positioning (especially long/short ratios).
For now, I plan to range trade this zone, but shorts are very risky — that’s a strong countertrend play. If you must short, use minimal size, because the uptrend is still powerful and I could be wrong.
Let’s watch how the structure develops.
#BTC #Crypto #Trading #Ichimoku #Riscora
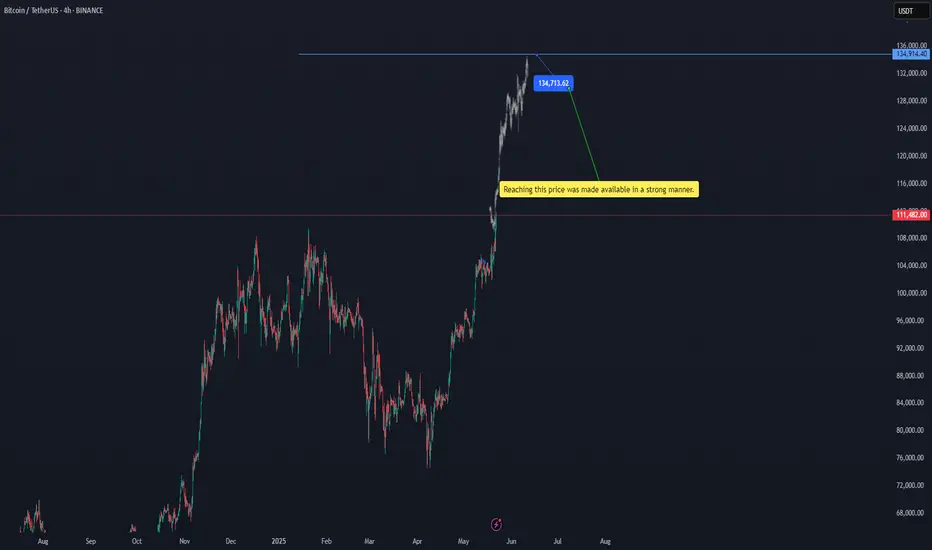
btcusdtReaching this price was made available in a strong manner. 134713.16$ BINANCE:BTCUSDT
Of course, there is a possibility of a temporary correction at the current price, but the target is $134,713.
#btc
bitcoin targets in 1h timeframeBased on the price structure created and the price trend, I have identified a possible target for Bitcoin. Let's see what happens.

BTCUSDTHi everyone
nice move , yeah!
here are the levels that you can consider in your trading.
In my opinion every correction could be a good opportunity to buy.
have fun
DYOR!

king BTC !As we were waiting for Bitcoin to move up, we published its signal on our channel
, and it was a beautiful analysis,
now we are waiting for the price of $ 120 thousand, the price may move down from here, we will buy again at prices of 114350 or 111, with the target of 126 thousand, good luck,
to profit with us, send a private message, everything is free

BTCUSDTBitcoin may be looking to complete the downward correction from the $101,000 price range to $99,000 and then begin a long-term upward trend. Pay close attention to the extent of the correction and don't give in to fear or greed.
In any case, it should go to $1300,000.
BINANCE:BTCUSDT

Can Bitcoin see $120,000?
Hi My Dears
If the Bitcoin price closes above $106,602, we can be optimistic about the specified targets.
I think Bitcoin has the potential to reach $120,000. We just have to wait.

Bitcoin breaks through a new high, aiming at 120,000!Bitcoin breaks through a new high, aiming at 120,000! ——Trend analysis and operation strategy
Bitcoin (BTC) finally broke through the shock range and broke through the 120,000 US dollar mark, setting a new record! The current market sentiment is high, and both technical and capital aspects show that bulls have an absolute advantage.
Key data observation:
Price structure: After breaking through the previous high, 120,000 US dollars became a new psychological barrier. If it can stand firm, the upper space will be further opened.
Support confirmation: The 114,000-115,000 range forms a short-term strong support. If the callback is not broken, the trend will continue.
Fund flow: Institutional positions are stable, derivatives have not shown excessive leverage, and the healthy rising structure is still there.
My opinion: The bull market has no top, but we need to be wary of short-term profit-taking. The trend has not changed, and low-absorption is still the main strategy.
【Operation strategy: Pullback is an opportunity】
1. Short-term layout:
Entry range: 114000-115000 (trend support + Fibonacci retracement level)
Target: 120000 (expected to accelerate after breakthrough)
Risk control: If it falls below 113000, the market structure needs to be re-evaluated
2. Trend holders:
Stay stable at 114000 and continue to hold. Observe the breakthrough strength above 120,000. If the volume increases, the target can be higher (such as 125000-130000).
【Risk warning】
Short-term volatility intensifies: A rapid pullback may occur after a new high, so avoid blindly chasing highs.
Macro variables: Fed policies and geopolitical situations may still trigger a spike.
My conclusion: Pullbacks in a bull market are all better opportunities to get on board. Keep a low-multiple mindset, but strictly control risks.
BTCUSDT – Bullish Momentum MaintainedBitcoin is maintaining a solid bullish structure after breaking out of its recent accumulation zone and filling the FVG gap around $110,400. On the H4 chart, BTCUSDT has just completed a successful retest near the dynamic support zone and is now aiming for the potential resistance at $112,949 – where it intersects with a long-term trendline. A breakout above this level could signal the start of a new expansion phase.
Major news from yesterday regarding new capital inflows into several approved spot Bitcoin ETFs, combined with rising expectations of a Fed rate cut later in Q3, are fueling strong buying momentum. This rally could gain even more strength if crypto markets continue to attract liquidity.

BTC Long / Buy SetupBTC is strongly Bullish towards 120k liquidity level, I'm not seeing any healthy correction before hitting the 120k level. If BTC strongly breaks and closes below 106.9k then chances are high that it will touch the weekly level and again come to 107k level, but this time it will struggle to break the 107k level because it will become bearish fvg, if it holds the 107k level and give any strong reaction from the zone then the next level is 120k. even a wick towards 105k or below doesn't matter, any body closing below the 106.9k (at least 4hrs) will lead short term weakness to the trend.

TECHNICAL ANALYSISI BTC 1 HR TIME FRAME 📊 Technical Analysis – BTCUSDT.P (1H Chart)
✅ 1. Overall Trend:
The market is in a strong bullish trend on the 1-hour chart, confirmed by multiple CHoCH (Change of Character) and BOS (Break of Structure) points.
📌 2. Price Structure:
🔹 First CHoCH:
Indicates weakness in the prior downtrend.
The following BOS confirms a structure shift to the upside.
🔹 Second CHoCH:
After a minor correction, buyers regained control.
Another BOS confirms continuation of bullish momentum.
🟢 3. Demand Zones:
Multiple demand zones are marked in green.
The most relevant zone right now is between 113,100 – 113,600, still untested.
A bullish reaction is likely if price pulls back into this area.
⚠️ 4. Current Price Action:
Price has reached around 115,487 after the latest BOS.
A minor bearish reaction is visible, suggesting a possible short-term correction.
As long as the BOS level holds, the overall structure remains bullish.
🔍 5. Candlestick Signal:
No clear Engulfing candle yet, but if:
A strong red candle forms followed by a full bullish engulfing candle within the demand zone,
→ that would be a valid Bullish Engulfing pattern and a potential reversal signal.
🎯 Conclusion:
Market structure is currently bullish.
Watch for pullbacks to the 113,100–113,600 zone.
Ideal entries come with confirmation (e.g., engulfing candle or strong rejection).
Always apply strict risk management.
❗️Disclaimer:
This analysis is for educational purposes only and does not constitute financial advice or a buy/sell signal.
Please do your own research and trade based on your personal strategy and risk tolerance.
BITGET:BTCUSDT.P

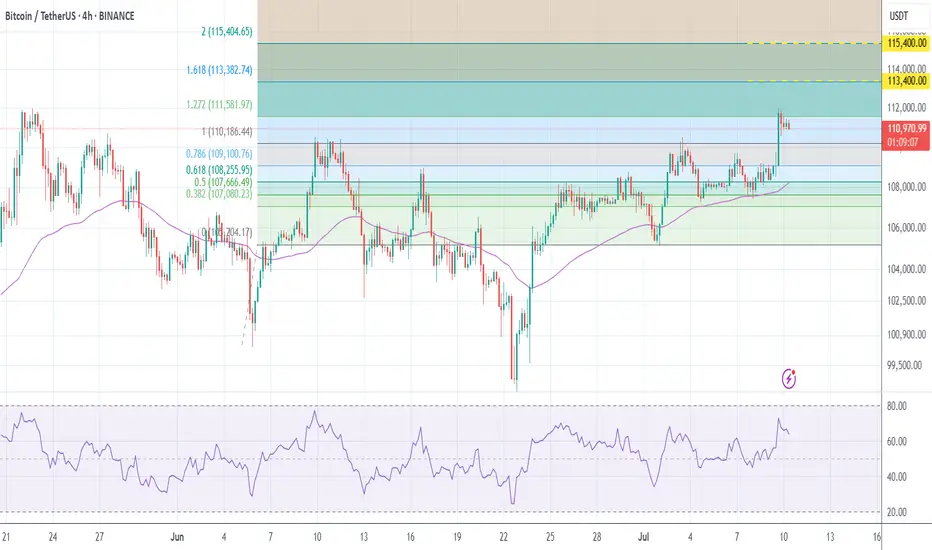
#Buy Bitoin @ H4This trading system is based on the divergence between the price and the RSI indicator and Fibonacci levels.
In the H4 chart, it can be seen that level 1 was broken and the price reached level 1.27. Levels 1.62 and 2 at prices 113,400 and 115,400 are the next targets.
Of course, the breakdown of level 1 may have a pullback.
I will post a short-term analysis on the 15-minute time frame in other posts.
If take a look at weekly time frameIf we take a look at weekly time frame btcusdt has formed a bullish cup and handle/ iH&S pattern and the nearest take profit area is the 120k. It is a good tp area for short term traders.

Bitcoin Wave Analysis – 10 July 2025- Bitcoin broke round resistance level 110000.00
- Likely to rise to resistance level 120000.00
Bitcoin cryptocurrency recently broke the round resistance level 110000.00 (which stopped multiple upward impulse waves from the start of this year).
The breakout of the resistance level 110000.00 should strengthen the bullish pressure on Bitcoin in the coming trading sessions.
Given the strongly bullish sentiment seen across the cryptocurrency markets today, Bitcoin cryptocurrency can be expected to rise to the next resistance level 120000.00 (target price for the completion of wave (3)).

BTC-USDT Analysis for the Past 24 HoursOver the past 24 hours, BTC showed excellent price action — I personally entered a long position at 110,000 and captured a clean +2.59% move, locking in profits without being greedy.
🚀 Price Action
Bitcoin climbed confidently from around 109,485 to 113,472 USDT — a gain of roughly 3.6%. The strongest impulse came between 00:00 and 01:00, with the candle surging from 111,341 to 113,685. It was a sharp and confident move with no signs of weakness.
📊 Market Observations
• Trading volume significantly increased during the night, especially from 03:00 to 01:00 — typical behavior during an aggressive short squeeze.
• Daily high: 113,757 USDT; low: 109,443.
• Technically, the market is continuing its uptrend after holding the key support level at 105,200 USDT last week.
📰 Fundamental Signals
• Kimchi premium is negative (-0.69%) — Korean investors seem to be in risk-off mode.
• Upbit listed BABY BTC, and activity in altcoins is picking up.
• Institutions are still cautious — even after BTC broke above 109,700, there’s no strong bullish sentiment from their side.
📌 My Take
The rally is strong, but not euphoric. There’s clear interest in BTC, and volume confirms the trend’s strength. However, the ETF flows and ongoing USDT discount in China signal the need for caution. Now is the time to avoid greed, take partial profits, and closely monitor how the market reacts to upcoming resistance levels.
BTC/USDT Multi - time frame analysis and {4HR }BTC/USDT Multi-Timeframe SMC Analysis – July 8, 2025
1. Top-Down Analysis:
Daily Timeframe (Macro Market Structure & Narrative - Inferred from chart context):
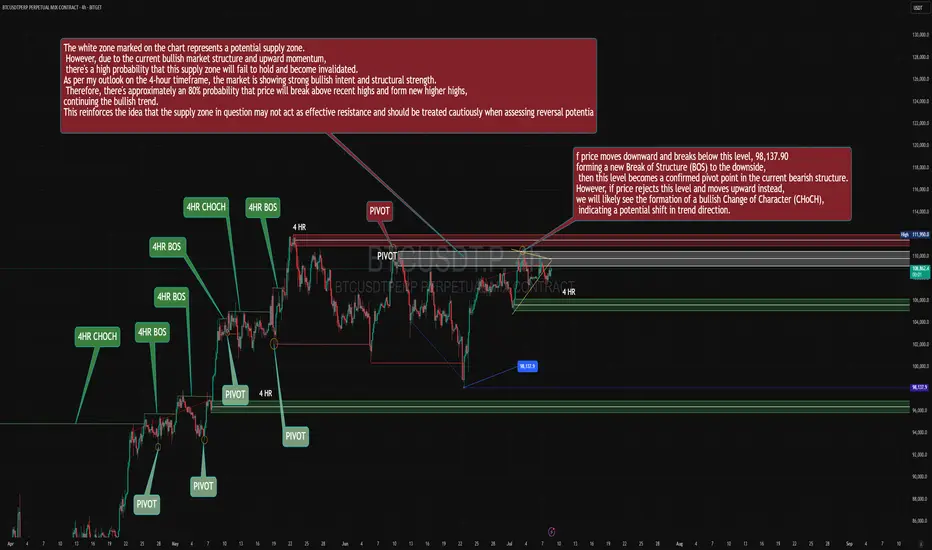
The broader market structure indicates a prolonged consolidation phase, initiated around mid-June, characterized by defined support and resistance levels. The identified supply zone, ranging approximately from $108,000 to $109,500 and labeled as "Potential Supply Zone" on the chart, is a key daily-level area.
Crucially, despite entering this daily supply, the strong underlying bullish order flow suggests a high probability that this supply zone may not act as an effective distribution point. The overarching narrative from higher timeframes indicates robust institutional buying pressure, implying a potential shift in the broader trend to unequivocally bullish upon a clear breach of this daily supply.
4H Timeframe (Swing Structure, Internal BOS/CHoCH):
The 4H swing structure explicitly displays a very clear bullish order flow. We observe a series of consecutively confirmed CHoCH (Change of Character) and BOS (Break of Structure) to the upside (indicated by "4HR CHOCH" and "4HR BOS" annotations). This unequivocally establishes a decidedly bullish 4H swing bias.
The most recent 4H BOS occurred around the $107,000 level, after which price has continued its upward trajectory.
Price is currently engaging with a 4H supply zone (marked by the white box). However, given the dominant bullish order flow on the 4H, there is a high probability that this supply zone will be invalidated, allowing price to extend its bullish movement. This phenomenon often signifies an "Imbalance Fill" or "Liquidity Grab" by smart money to fuel further upside.
1H Timeframe (Entry-Level Structure & POIs):
The 1H timeframe currently reflects a phase of consolidation or minor correction following the recent bullish impulse.
In alignment with the decisive bullish 4H bias, any retracement observed on the 1H timeframe is to be considered a buying opportunity.
The "PIVOT" marked around $105,000 serves as a potential 1H demand area, which could be a target for a deeper retracement before the continuation of the bullish move. However, considering the current market strength, price might not even reach this level and could resume its ascent from current or slightly higher levels.
The current "PIVOT" at approximately $108,500 represents a temporary internal resistance. A decisive break and sustained close above this pivot would provide stronger confirmation for the continuation of the bullish trend.
2. Identification:
Clean Breaks of Structure (BOS) and Changes of Character (CHoCH):
4H: Multiple clear bullish BOS and CHoCH events, indicative of strong bullish order flow.
1H: Internal structure currently shows consolidation prior to a likely bullish BOS to new highs.
Valid Supply & Demand Zones (Unmitigated only):
Unmitigated 4H/1H Supply Zone: Approximately $108,000 - $109,500 (marked by the white box). However, as noted, it is anticipated to be invalidated due to the overall bullish order flow.
Unmitigated 4H/1H Demand Zones: Lower down, around the $105,000 PIVOT and the green-shaded regions on the chart (potential demand areas that would activate upon a deeper retracement).
Internal and external liquidity pools (buy/sell-side):
External Buy-side Liquidity: Above the all-time highs or previous "High" (observed at $111,900 on the prior chart).
Internal Buy-side Liquidity: Above current range highs (approx. $109,500) and above recent pivots.
Internal Sell-side Liquidity: Below recent 1H pivots, particularly below $107,000 and $105,000 (which could act as inducement).
Inducement patterns and liquidity grabs (internal sweeps):
Any minor retracement or downside fluctuation from the current supply zone could act as inducement to draw in sellers, before price resumes its bullish trajectory.
Previous sweeps to the downside have served as confirmation of liquidity accumulation for prior bullish moves.
Order blocks, FVGs, mitigation blocks, and imbalance zones:
Given the impulsive nature of the bullish moves, bullish FVGs and OBs should be considered in retracements (e.g., around the $105,000 demand area).
The current supply zone (white box) also contains OB/FVG, but as mentioned, its invalidation probability is high.
Active market range and internal liquidity engineering:
The active 4H market range encompasses the recent bullish move from $102,000 to current highs.
Internal liquidity engineering currently involves drawing sellers into the supply zone and subsequently invalidating it for continued bullish advancement.
3. Delivery:
Directional Bias with Contextual Narrative:
Strongly Bullish. The 4H order flow is unequivocally bullish, with repeated confirmations of bullish BOS and CHoCH. While price is entering a supply zone, the overall bullish strength suggests it is highly probable this zone will be invalidated, leading to further upside to target new highs. The market narrative points towards a continuation of the uptrend, targeting external buy-side liquidity.
Actionable Setup (Long):
Asset: BTC/USDT Perpetual Futures
Entry Level (POI, OB or FVG):
Scenario 1 (Aggressive Entry - given market strength): Enter long within the $107,500 - $108,000 range (upon confirmation of bullish price action on the 1H or 15-minute timeframe within the supply zone, indicating its invalidation). This entry presumes the supply zone will be breached.
Scenario 2 (Conservative Entry - upon retracement): Enter long within the $105,000 - $105,200 range (the pivot area and potential demand zone). This point would activate upon a deeper retracement into a discount area.
Given the chart and current strength, Scenario 1 appears more probable, but price action confirmation is critical.
Stop-Loss (Invalidation Structure):
For Scenario 1: Place stop-loss below the last valid 1H structural low that confirms the bullish impulse, or below $106,500.
For Scenario 2: Place stop-loss below the demand zone and below the $104,500 pivot, e.g., $104,000.
Target Level (Minimum 3R+):
Target 1 (1R): $109,500 (Break of current supply range high and liquidity grab).
Target 2 (2R): $111,000 (Retest of previous "High").
Target 3 (3R+ / Primary Target): $112,500 - $113,500 (Formation of new highs and targeting fresh buy-side liquidity).
R-multiple Calculation Example: If for Scenario 1, entry is $107,700 and stop is $106,500 (1200 points risk), a 3R target would be $107,700 + (3 * $1200) = $111,300, which aligns with our targets.
Confluences:
Multi-Timeframe Alignment: Decisive bullish 4H order flow provides strong support for a bullish bias, treating any retracement as an opportunity.
Liquidity: New highs and external buy-side liquidity serve as clear targets.
Supply Zone Weakness: Despite price entering a supply zone, the underlying bullish strength suggests its probable invalidation.
Pivot Price Action: Repeated bullish pivots and structural breaks confirm the trend.
This analysis presents a high-conviction long setup for BTC/USDT. However, close attention to price action confirmations on lower timeframes (e.g., 1H or 15-minute) within the current supply zone will be crucial for aggressive entry. Should price retrace, anticipate a bounce from lower demand zones.
Disclaimer: This is a market analysis based on current price action and structure. It does not constitute a buy or sell signal. Always conduct your own research and risk assessment before taking any trades
BITGET:BTCUSDT.P
BTC/USDT – Intraday Long Plan (5m, Ichimoku) by RiscoraI see the green zone as an attractive area to look for long entries.
After the strong move, I expect BTC to stay in a range for now. My main plan is to long from the green block and look to take profits at the upper boundary (yellow block), where liquidity is clustered.
No interest in shorts at the moment — will monitor price action for changes.
Range trading is the priority until further direction emerges.
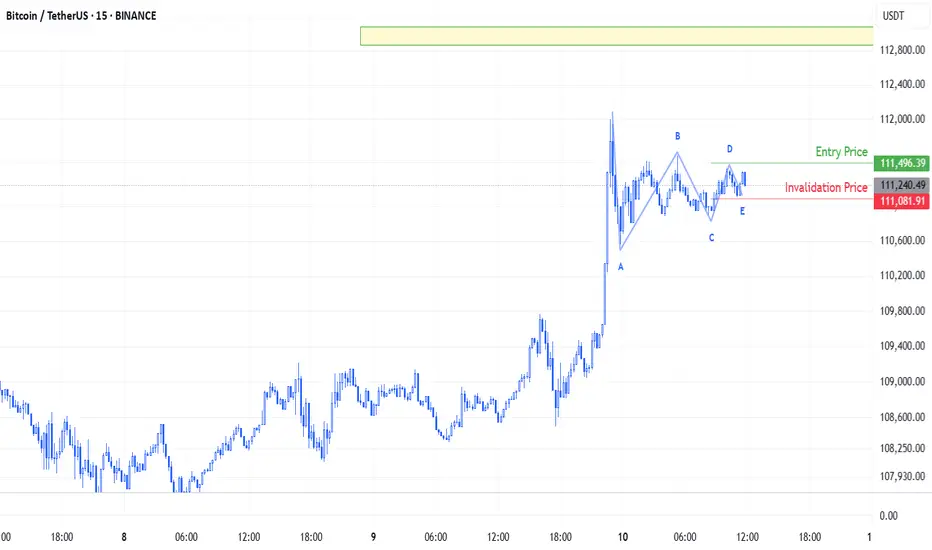
BTC/USDT Elliott Waves A symmetrical triangle has formed on BINANCE:BTCUSDT , most likely as part of Wave 4, following the previous explosive move.
Entry is triggered if the price breaks above Wave D of the triangle, and stop loss is placed just below Wave E.
Cluster analysis suggests that the price will likely reach near the 112,950 level.
#BTC Update #5 – July 10, 2025🟠 #BTC Update #5 – July 10, 2025
Bitcoin is currently trading inside a supply zone and seems to be preparing for a corrective move after its impulsive rally — but the first clear step of that correction has yet to appear. At the same time, USDT Dominance is hovering near a support zone. If it bounces from here, Bitcoin’s pullback could accelerate.
Additionally, BTC has approached a previous resistance level, making it an uncertain area for new entries. At this stage, I don’t find it logical to open either a Long or Short position. Once the correction completes, the first major target is likely the 123,250 zone.
For now, I’m just monitoring. No trade recommendation at this time.
