$BTC Daily Outlook BYBIT:BTCUSDT.P
Macro Picture
Weekly Chart
Both Bias & Momentum aligned bullish
Moving towards 111968.0 vLevel (HH) - ATH
Be careful with Weekly FA from that Level
More upside room from here
vLevels Range between 111968.0 - 77083.5
Daily Chart
Both Bias & Momentum aligned Bullish
Failed Auction at 102000.0
Validated from Volume Footprint Charts - Selling Delta trapped on this Failed Auction - POC & Value Area at Wick Lows
vLevels Range between 111968.0 - 102000.0
More Upside room from here, but overall consolidation for now as we are inside a High Volume Node
A pullback would be ideal to look for entries
10-Hour Chart
Price is currently inside an Inside Bar Range between 109740.9 - 107134.7
Overall momentum from the Intraweek Chart (10-Hour) is bearish due to a Failed Auction around 109740.9
Need to wait for confirmation for New Failed Auction Today.
vLevels zone around 105335.0 - 104567.0
Would be nice to have a pullback towards this zone, in which we can start looking for rejections for Intra-Week Longs
Nice zone to look for longs is also IB Range Low 107134.7
Intraday Picture
1-Hour Chart
No outlook for now, waiting for Intra-Week Chart Confirmation
No shorts from here, as HTF bias & momentum remain bullish
Patience - Overall range, don't want to get chopped here.
10-Minute Chart
No Outlook for now, waiting for MTFs and HTFs confirmation
Bitcoin Outlook — Narrative Recap
On the higher time-frames the picture is straightforward: both weekly and daily bias and momentum are in sync to the upside. Price is grinding toward the prior all-time high vLevel at 111 968 USD. Treat that level with respect, if a weekly failed auction (FA) forms there, it could mark the next inflection, but for now there is still air between price and that resistance. The broader weekly value range spans from 111 968 USD down to 77 083 USD.
The daily chart reinforces the bullish thesis. A failed auction printed at 102 000 USD, and volume-footprint data show sell-side delta trapped at those wick lows; the point of control and value area also sit there. 102 k is now strong support. Price is chopping inside a high-volume node, so a healthy pullback toward 102 k (or at least into value) would be the ideal place to reload longs before the next push higher.
Drop to the 10-hour “intra-week” view and momentum tilts short-term bearish. Price is boxed inside an inside-bar range between 109 741 USD and 107 135 USD after a failed auction at the range high. The preferred play is patience: let price drift into either the IB low at 107 135 USD or, even better, the deeper vLevel cluster at 105 335 USD – 104 567 USD. There we’ll watch for a fresh failed auction or obvious seller exhaustion to trigger new longs targeting the ATH zone.
On the 1-hour and 10-minute intraday charts there is no edge yet, conditions are choppy and hostage to the intra-week setup to align with the Higher Timeframes. With higher-time-frame bias still firmly bullish, fading strength makes little sense; stand aside until the 10-hour chart confirms a pullback and reversal.
Bottom line: stay bullish, stalk a pullback, and look to join strength from 107 k or 105–104 k. A decisive daily close back below 102 k would force a rethink; until then, patience is the edge.
BTCDOWNUSDT trade ideas

BTC Bulls, this one is for you ;)As most of you know, I’ve been bullish on Bitcoin for quite a while now. And today, I want to show you exactly which resistance levels I’m watching if the breakout continues.
On the weekly BTC/USDT chart, I’ve marked out five key upside targets, all based on Fibonacci extension levels — not just random lines, but technical zones that often attract serious reaction from the market.
Let’s break them down:
🔸 Target 1 — $124K
This lines up with the 141.4% Fibonacci extension and also happens to match the projected move of a textbook Cup & Handle pattern. It’s the first big checkpoint.
🔸 Target 2 — $137K
Here we’ve got the 227.2% Fib level — a classic continuation zone if momentum remains strong.
🔸 Target 3 — $145K
Next up is the 241.4% extension, where we could see some heavier resistance and price interaction.
🔸 Target 4 — $155K
One of the strongest zones on the map. Why? Because it merges four separate Fibonacci extensions in one cluster. A real decision point.
🔸 Target 5 — $167K
And the final target (for now) — the 261.8% extension. If BTC gets here, it’ll be a major event.
🎯 My View:
This isn’t hopium. These levels are based on market structure, Fibonacci math, and historical behavior. As always, I’ll adjust based on price action, but these are the areas I’m preparing for.

BTCUSDT — Bulls Testing the Smart Money Zone BINANCE:BTCUSDT is knocking on the door of a key supply area, where smart money typically steps in to set the next market direction. The latest 15-minute chart, powered by the GalihRidha ZoneX indicator, puts us right at a classic decision point — here’s what the market is telling us:
1. Bulls Pushed into Supply
After a sharp rally from the demand cluster around 108,600–108,900 (see the green/blue ZoneX blocks), BTCUSDT has powered straight into the upper red supply zone, aligning perfectly with a previous high.
This area isn’t just technical resistance — it’s where institutional players tend to absorb late longs and test true buying conviction. Recent wicks into this zone suggest the first signs of exhaustion or aggressive selling.
2. Liquidity Pools and the Battle for Control
Notice how the yellow dashed line (yesterday’s high) and the red block (ZoneX supply) form a liquidity shelf. This is where both breakout buyers and aggressive shorters are active.
If bulls can establish support above this shelf, it often signals true trend continuation. If not, this same zone is primed for a fakeout reversal.
3. The VWAP/Midline Story
Below, the VWAP band and midline (dotted) tell us where fair value and market balance sit. Price spent hours consolidating here before the breakout. Any pullback into this area (around 108,900) will be a major test: will buyers defend, or will the breakout unwind?
4. Scenarios and What to Watch
Bullish scenario:
A strong close and hold above the red supply zone could unleash another wave higher, as shorts get squeezed and trend followers pile in. Watch for retests of the broken supply as new support.
Bearish scenario:
If price can’t hold above the supply zone and quickly falls back below, expect sellers to target the VWAP/midline band. A deeper flush could see a return all the way to the green demand zone.
Neutral/chop:
If price oscillates around this supply zone, expect a battle of wicks — a classic “liquidity grab” before the next directional move.
My Approach
I’m letting the zone do the talking. No FOMO at the top; I want to see if bulls can really flip this area to support.
Patience is key: I’ll trade with momentum on confirmation above, or fade a failed breakout with a tight stop.
Summary:
BTCUSDT is in a classic smart money test zone. Whoever wins this battle will set the next move — don’t trade blindly, trade with the levels the big players watch!
If you found this analysis useful, smash like and follow for more smart money zone breakdowns!

BTC back to 110K, ATH effortPlan BTC today: 09 July 2025
Related Information:!!!
Cryptocurrencies are trading in a volatile environment driven by tariff-related uncertainties ahead of the release of the Federal Reserve's (Fed) Minutes from the June meeting, scheduled for Wednesday. Bitcoin (BTC) continues to exhibit technical weakness, trading below the key resistance level near $109,000. Trading activity in the spot market remains subdued, with K33 Research reporting a 4% decline in weekly volume to $2.1 billion.
Aside from a few selective rallies, as evidenced by Wednesday’s top-performing tokens, most altcoins are underperforming relative to Bitcoin, reflecting limited engagement from the retail segment. Nonetheless, Ethereum (ETH) is showing early signs of a potential upward move after breaking above the former resistance-turned-support level at $2,600. Ripple (XRP), meanwhile, has extended its recovery above $2.33, posting over 1% in intraday gains.
personal opinion:!!!
Continued efforts by the bulls, breaking ATH above the 110,000 price zone. The time is near for the FED to lower interest rates.
Important price zone to consider :!!!
support zone : 109.200
resistance zone : 109.700
Sustainable trading to beat the market
#Buy BitCoin#Buy BTCUSD
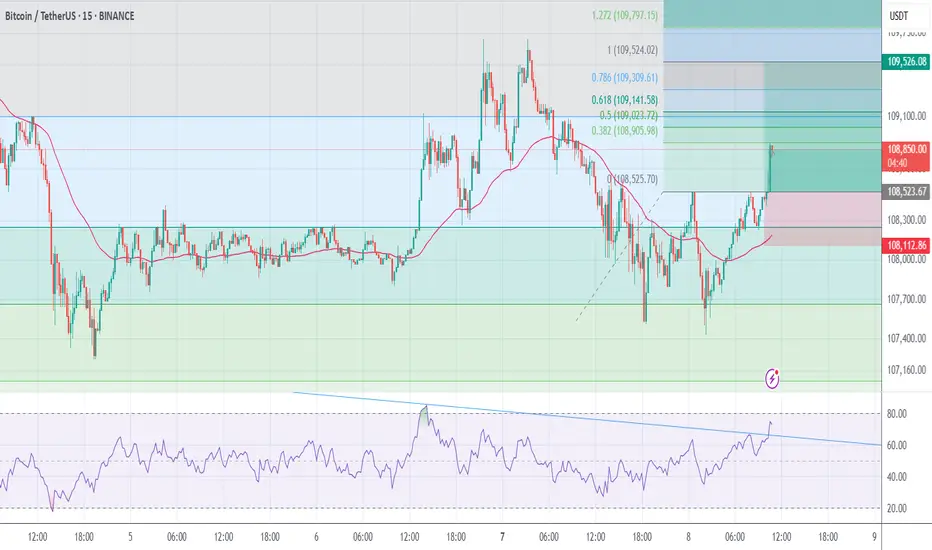
this trading system based on Divergency ans fibo
EntryPrice =108500
T.P= 109500
S.l=108100
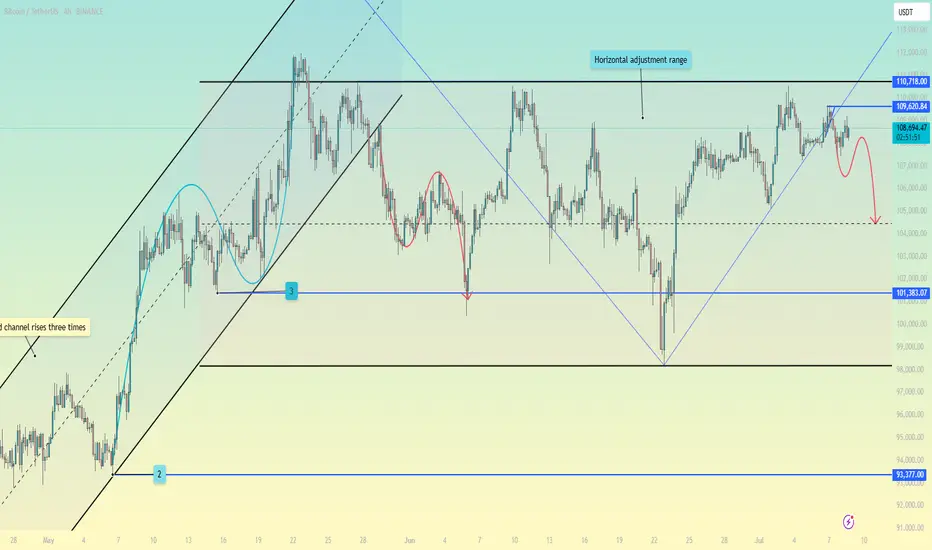
Bitcoin 8H – Higher Lows Forming Above Key SupportBitcoin has spent the last two months consolidating within a well-defined horizontal range, anchored by strong support around the $100,000 zone. The current chart highlights a series of higher lows building beneath overhead resistance, signaling growing bullish pressure.
Each pullback has been bought up consistently at or near the same key support level, suggesting institutional accumulation or strong demand in this area. Price has now tested this level three separate times without a breakdown, which strengthens its validity as a major floor in the current structure.
At the same time, the market has shifted from lower highs to higher lows — a common early signal of an impending breakout. The trendline drawn from the May low to the most recent higher low illustrates this dynamic clearly. Price is now compressing within a narrowing range between the support floor and the horizontal ceiling near $110,000.
Technical Highlights:
Ascending trendline supporting price since May
Three successful defenses of the $100K support zone
Horizontal resistance near $110K continues to cap upside
Price is currently coiling within an increasingly tighter range
Consolidation within this structure suggests a breakout is approaching
If BTC can break and hold above the $110,000 resistance with volume, this would likely mark the beginning of the next expansion leg to the upside. However, any loss of the $100K zone would invalidate this ascending structure and expose BTC to deeper pullbacks toward the $95K–$92K range.
🧠 Trade Considerations:
Bias remains bullish while higher lows hold
Breakout above $110K opens room for continuation toward $115K and beyond
Breakdown below $100K support would flip the structure bearish

There’s a higher probability of an upward breakout.🚨 Bitcoin Technical Update – Key Levels Ahead! 🚨
Bitcoin is currently forming a symmetrical triangle pattern, a classic setup that often signals a strong move ahead. At the moment, the market is leaning toward the upside, showing early signs of bullish momentum.
📈 If we see a breakout to the upside, it's crucial to wait for a retest of the breakout level. A successful retest could confirm the move, setting the stage for a strong upward rally. However, if the breakout fails, don’t rush in — just observe the price action closely to see how the market reacts.
⚖️ There’s a higher probability of an upward breakout, as liquidity is still building above, and there are strong support levels holding below. This combination could act as a springboard for price to move higher.
🔍 As always, Do Your Own Research (DYOR) before entering any trade. Stay alert and manage your risk wisely!
Bitcoin Formed Next level Formation #bitcoinHello trader's
Here is something special formation in Bitcoin chart...
Now. You know which side is breaking....
If don't comment

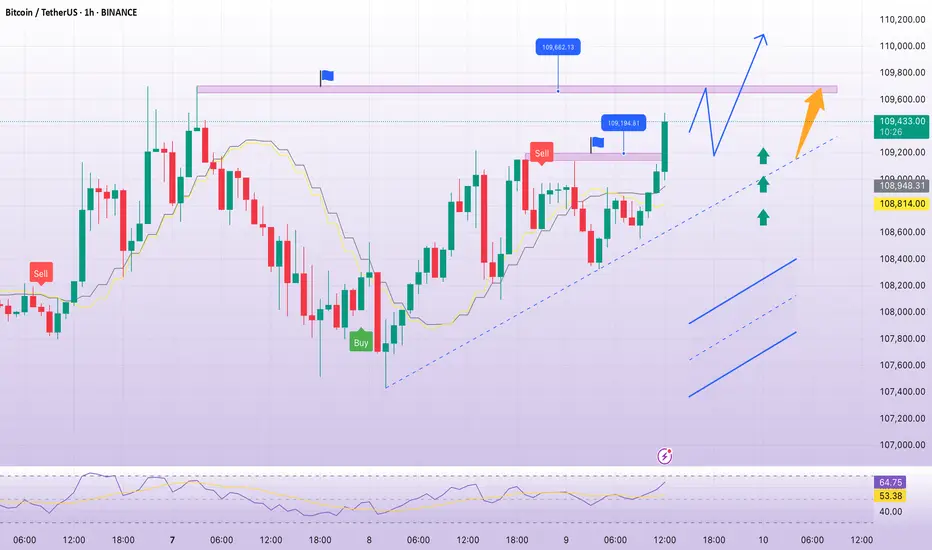
Bitcoin Market Outlook📈 Bitcoin Market Outlook
We're seeing lower highs forming on the chart, which suggests a possible short-term bearish trend.
🔹 I'm watching $109,953 for a long position — if price breaks above that level, I’ll consider entering with a stop-buy using the exchange's order book.
🔹 For a short position, the current trigger is $107,344, but keep in mind this level may change — I’ll update if needed.
🚨 If you’re shorting, use a tight stop-loss and take profits quickly.
In this kind of market, risk and money management are everything.
💬 Let me know what you think in the comments — always happy to hear your take!

BTCUSDT – Ready to Launch from Accumulation Zone?BTCUSDT is consolidating around the $101,000 FVG zone – a previously strong launchpad. Price structure remains bullish, forming higher lows and showing a healthy throwback pattern.
If the $101,448 level holds, the next target could be $116,000 – a potential 14% rally in two weeks.
Fundamentals support the upside: expectations of Fed rate cuts and renewed ETF inflows are fueling fresh momentum for Bitcoin.
Still, watch for price action confirmation – and always manage your risk!


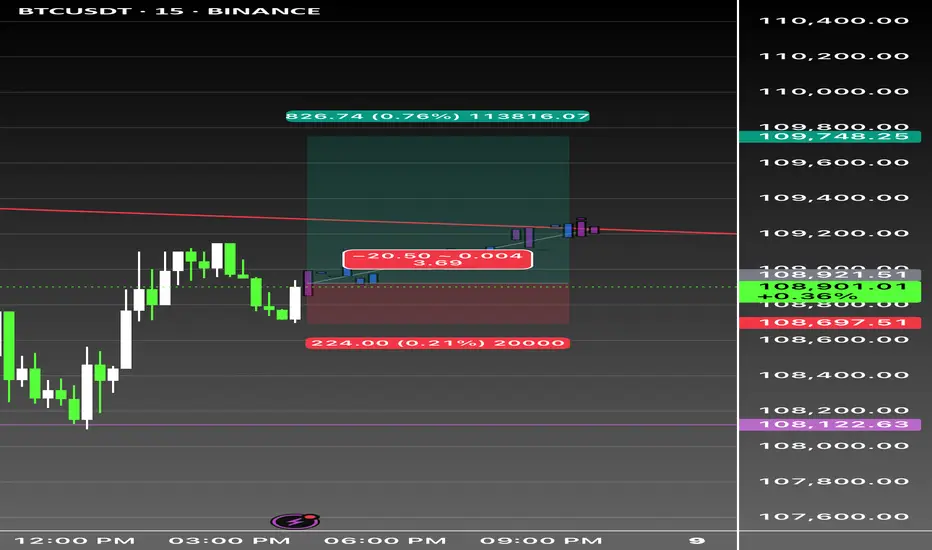
BTC Long scalp tight stop 📈 BTCUSDT 15min | Long Trigger Alert
Caught a breakout move 🔥
✅ Entry: 108,697
🎯 Target: 109,748 (+0.76%)
🛑 Stop: 108,473 (Tight 0.21% risk)
🔗 RRR: 3.69
Triggered after reclaim and retest near trendline resistance — flipped into support. Consolidation candles printed bullish structure above EMA. Watching for continuation 🚀
🎯 High confluence setup
💪 Clean structure
🔍 15m momentum shift confirmed
Leverage: 20x+ scalp friendly, manage tight.
Confidence: 8/10
#BTC #CryptoTrading #BTCUSDT #LeverageTrading #ScalpSetup
BTC accumulates momentum again in the range
Macroeconomic and policy impact
Trump tariff policy: The United States announced that it would impose 25%-40% tariffs on Japan, South Korea and other countries (effective on August 1), triggering market risk aversion, and Bitcoin once fell to the support level of $107,5004.
Federal Reserve policy: The market is concerned about the possibility of a rate cut in July. If the Fed turns dovish, it may boost the price of Bitcoin by 17.
Musk and Trump conflict: The public dispute between the two sides over the "Big and Beautiful Act" caused short-term fluctuations in the crypto market, with DOGE leading the decline and BTC once under pressure by 2.
Bitcoin is currently in the key liquidity-intensive area of 105,000-108,800 US dollars, and the long and short sides are fiercely competing here:
Above $108,800: A large number of short stop-loss orders are gathered, and a breakthrough may trigger a chain of short liquidations, pushing the price towards $113,000-130,000.
Below $107,100: There are dense long leveraged positions. A break below this level may trigger forced liquidation of long positions, causing the price to fall back to the $92,000-$95,000 support zone 1.
Technical aspects and market structure
Breakout-retracement mode: If the weekly close stabilizes at $107,720, the upward trend may be confirmed, with the target pointing to $110,000-$130,000. The historical analogy of the "step-up" structure in Q4 2024 indicates that the bull market may continue.
Short-term resistance and support:
Resistance level: $108,500 (if it breaks through, it may test $110,000).
Support level: $107,500 (if it breaks below, it may drop to $106,500)410.
Bitcoin has recently fluctuated between $106,000 and $110,000, with ETF inflows and long-term holders selling forming a seesaw 57.
Summary
Bitcoin is currently in a critical game range. The short-term trend may be determined by the liquidation trigger point (107,100-108,800 US dollars), and is also affected by macro policies (tariffs, the Federal Reserve) and institutional capital flows. The medium- and long-term bullish expectations are strong, but attention should be paid to high leverage risks and changes in market sentiment.
BTC , 4hr , BearishBTC is Forming a Pattern and it is at the top of the Another Pattern and It is facing rejection 3 Times from Above and now it is forming another pattern inside and Ready for Break Down of the Pattern , if it breaks the Pattern Down then it will be bearish almost 90% it will move to down side , if it has not given Breakdown and moving inside the small pattern then wait patiently and observe carefully .
Then it may also give Breakout for up side .
Follow Risk Management Properly
Follow for More Swing Ideas Like this .

Orangeman vs The Federal Reverse: Season 1 (2018–2020)It all started in 2018... 🎬
🧱📈💼 March 21, 2018: Jerome Powell steps in as the new Fed Chair. Almost immediately, the Fed hikes rates from 1.50% to 1.75%, citing a strong U.S. economy.
💬📊🇺🇸 June 13, 2018: Another hike to 2.00%. Powell says the U.S. economy is “in great shape.” But markets? Not so thrilled.
🗣️📉🇺🇸 July 19, 2018: Enter The Orangeman—President Trump publicly attacks the Fed's policy, breaking tradition. He’s “not thrilled” with the hikes.
📉🏦 September 26, 2018: Yet another hike to 2.25%. The Fed stays firm. Trump? Getting louder.
❗😠💬 "I'm not happy with the Fed." – Trump
⚠️📉📉 December 19, 2018: Fourth hike of the year to 2.50%. Markets tank. Rumors swirl: Trump wants Powell gone.
🔥💣👔 Behind the scenes: Trump reportedly explores ways to dismiss Powell. The pressure is on.
📛🇺🇸📉 June 10, 2019: The battle heats up. Trump calls the hikes a “big mistake” and demands rate cuts.
✂️📉📉 July 31, 2019: Powell blinks. The Fed cuts rates by 0.25%—first cut since 2008. Trump tweets:
👎🐦💸 “Powell let us down.”
⬇️📉🔁 September 18, 2019: Second cut.
⚖️🔁🧩 October 30, 2019: Third consecutive cut. The Fed pivots completely. The Orangeman’s influence is undeniable.
🦠🧪📉 March 2020: COVID strikes. The Fed responds with emergency rate cuts.
🌀🧻💸 March 15 & 23, 2020: Rates slashed to near zero. QE infinity unleashed. Powell goes full printer mode. Bitcoin begins to stir...
Season 1 closes with markets melting down, a pandemic, and the Fed surrendering to zero rates.
But The Orangeman isn’t done...
And The Federal Reverse still lurks in the shadows.
Next up: tariffs, China, currency wars, and another campaign trail. 🐉💵⚔️
Season 2 is coming.
Stay tuned...
One tweets.
The other tightens.
Who controls our future?
One Love,
The FXPROFESSOR 💙

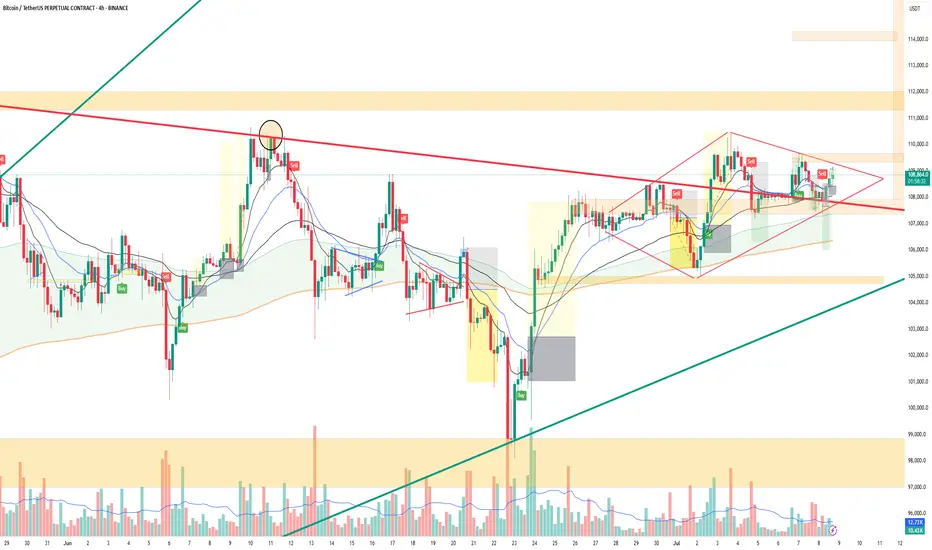
Diamond Pattern Context (4H BTC Chart)The structure forming from June 27 to July 8 appears to be a diamond top, a reversal pattern often seen after uptrends.
Price expanded (broadening left) and then started converging (right side) — classic diamond symmetry.
It has developed right at the macro trendline resistance (~109.5K), increasing its reliability.
Volume has declined during the right half of the diamond, which is consistent with pattern expectations.
✅ Implications of Diamond Pattern
Bearish Bias (Diamond Top):
If price breaks below the lower boundary (~107.8K), it confirms the pattern → potential move to 104.5K–102.5K zone.
Measured move ≈ height of pattern (109.8K–106K) ≈ 3.8K drop.
Invalidation/Bullish Flip:
Break and hold above 109.5K with volume would invalidate the bearish diamond.
In that case, it flips into a squeeze breakout with upside to 110.8K–111.5K+.
🎯 Conclusion:
The diamond top, combined with macro resistance and declining volume, strengthens the bearish breakdown scenario.
However, no confirmation yet — remain neutral to bearish unless either:
✅ Clean breakout >109.5K
🔻 Breakdown <107.8K with volume
BTC PRICE PREDICTION
According to my personal analysis, Bitcoin has the potential to reach between $112,000 and $120,000.
Everyone should hold onto their coins confidently and avoid panic. The market is expected to move upward. Stay focused and trust the process.

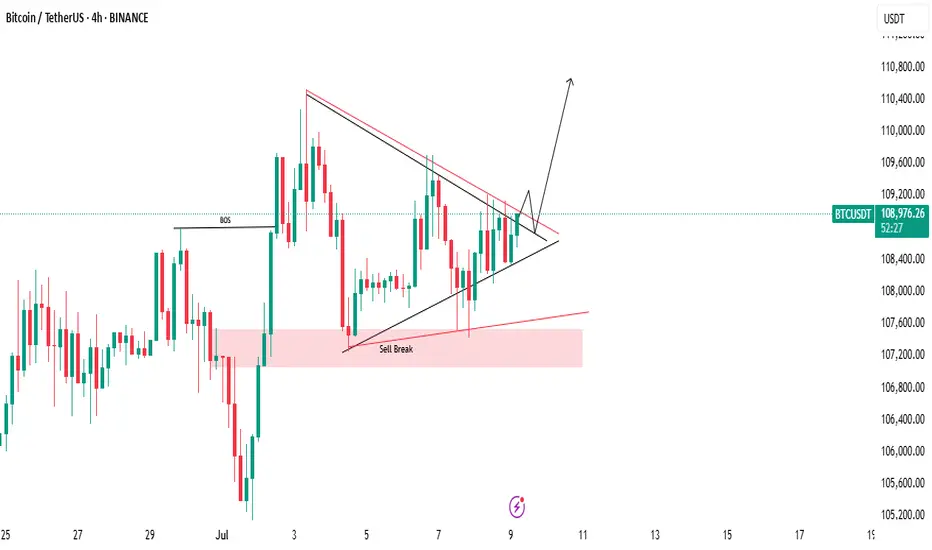
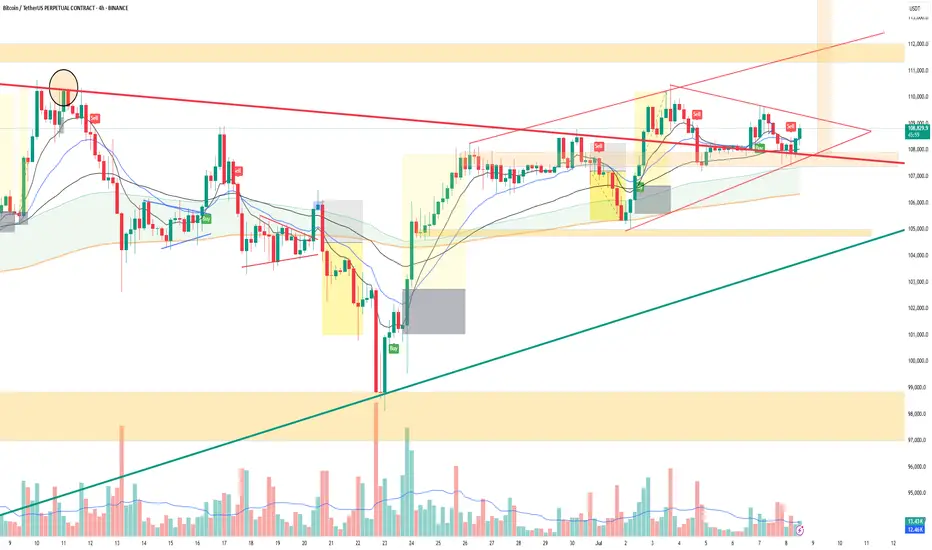
BTCUSDT 4H Analysis | Apex Decision ZoneStructure & Price Action
BTC is consolidating within a symmetrical triangle (red trendlines).
Price is squeezing near the apex, suggesting an imminent breakout.
Strong defense at ascending channel support (~108K zone) + green trendline.
Lower highs indicate sellers still active, but higher lows reflect buyer strength too.
Price bounced from previous demand block (green box), now pushing toward resistance.
📊 Indicator Confluence
RSI: Curling up from mid-range (~52–55), no divergence, neutral-to-bullish tilt.
DMI/ADX: ADX rising slightly, -DI weakening vs +DI → potential trend shift brewing.
MACD: Histogram flat; momentum hasn't confirmed either side yet.
Wave Trend: Bouncing from mid-line, bullish cross may form if price breaks triangle.
Volume: Gradual decline = typical pre-breakout compression. Watch for spike.
Stochastic: Flipped bullish from oversold — early bullish bias.
🎯 Summary & Probabilities:
BTC is coiling near triangle apex — breakout likely soon.
🔼 Break above 109.4K with volume → 60% chance of move to 110.5K–111.5K.
🔽 Drop below 107.9K → 40% chance of fall to 106.3K–104.4K.
Bias: Neutral-to-bullish — confirmation needed.
Is the Fear & Greed Index Becoming a Victim of Its Own Success?I’ve noticed something about the Fear & Greed Index that rarely gets discussed:
Its reputation as a “contrarian indicator” may actually dampen market declines. When everyone sees “Extreme Fear” and believes it’s time to buy, the panic doesn’t deepen as it might have in the past—potentially muting major market lows.
This creates a feedback loop:
The index signals “buy the fear,”
Enough traders pile in,
The market stabilizes before real capitulation sets in.
When a widely-followed counter-indicator becomes common knowledge, it can lose its edge. In today’s markets, these signals may serve more as social safety nets than as true predictors of sentiment extremes.
Bottom line: If the “fear” signal stops working, or stops triggering buying, it could be a warning that the market’s safety net is gone. I wonder, is the VIX subject to the same mitigating effect?
The Fear & Greed Index has never been truly tested during a long term bear market.
But then it may partly be why we have not had one in so long.
Would love to hear your thoughts—has anyone else noticed this effect?
BTC SCALP TRADE / Long Setupwait for the entry, must use SL. If final tp is achieved then trade is not valid, active till final tp. Must use proper risk management. Expecting upside move. If SL hit then take previous trade, It's still valid.

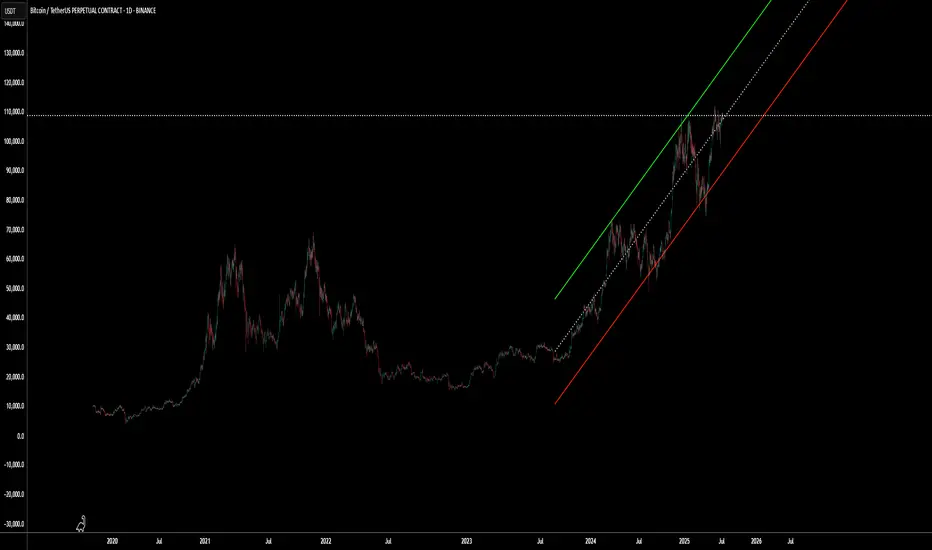
Like the previous cycles!Our basis is the Fibonacci retracement with 78%. The 78% level should be aligned with the previous peak.


My Long term BTC-USDTP PLANmy long term plan or the rest of the year leading into April im working on.. still needs a little more confirmation but today pull was very significant indeed
