[SeoVereign] BITCOIN Bearish Outlook – July 6, 2025We are the SeoVereign Trading Team.
With sharp insight and precise analysis, we regularly share trading ideas on Bitcoin and other major assets—always guided by structure, sentiment, and momentum.
🔔 Follow us to never miss a market update.
🚀 Boosts provide strong motivation and drive to the SeoVereign team.
--------------------------------------------------------------------------------------------------------
Hello,
This is SeoVereign.
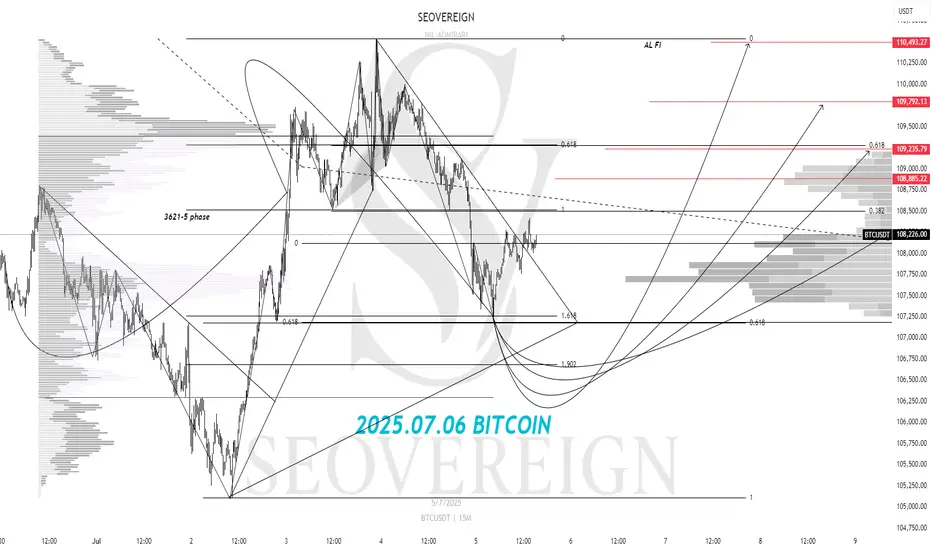
As of July 6, 2025, I present a bullish outlook on Bitcoin.
It has been a while since I last shared a long position perspective.
Those of you who have consistently followed SeoVereign’s ideas would know that, until now, most of the entry points have been centered around short positions. We have closely tracked the market, identifying opportunities amid the downtrend.
However, after comprehensively analyzing the recent overall market atmosphere, we have come to the conclusion that upward pressure is gradually increasing rather than downward pressure. After reviewing technical indicators and wave structures, we have determined that it is reasonable to consider a buy — in other words, a long position — at this stage.
The first target for this idea is set at an average of around 109,500 . This figure is based on a comprehensive judgment that includes the current wave structure, previous key support/resistance zones, and momentum trends. Of course, this target may be flexibly adjusted depending on how the market develops, and if necessary, the rationale will be clearly revised accordingly.
As always, we will continue to track this idea and refine our logic based on the real-time developments and structures, further solidifying the grounds for the long bet.
Wishing you continued good fortune.
BTCDOWNUSDT trade ideas
BTCUSDT short-term analysishi traders
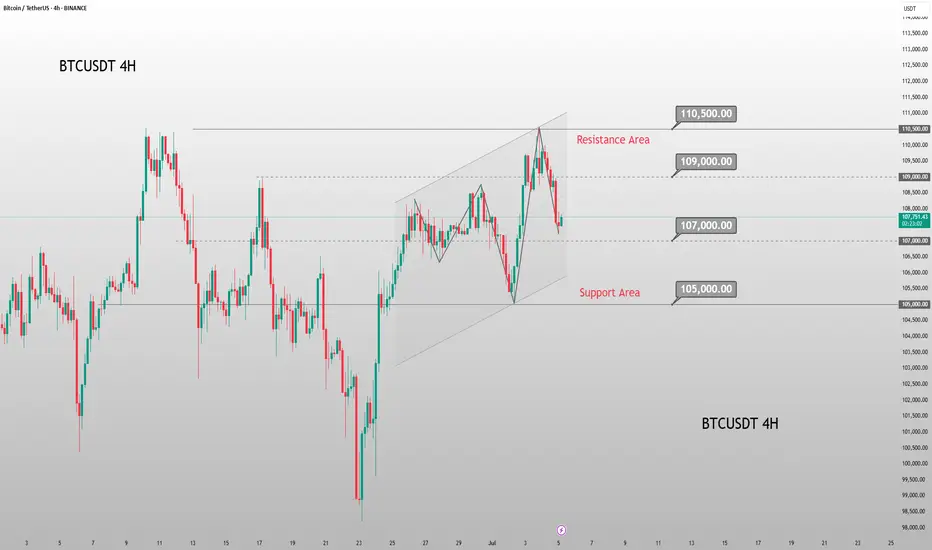
Let's have a look at BTC on 4h time frame.
RSI (14): Currently at 60.40, suggesting mild bullish momentum but not overbought.
RSI Moving Average: Around 50.92, confirming recent upward momentum.
MACD bullish cross suggest more upside in a short term.
Breakout Confirmation: Price has broken above a recent horizontal resistance (near $109,236), now acting as support.
Bullish Continuation Expected
Support & Resistance:
New Support: $109,236
Resistance to Break: Around $111,742
✅ Conclusion:
This is a bullish breakout trade based on horizontal support/resistance, favorable RSI, and a clear RR setup. The trader anticipates a pullback and continuation toward $111.7K, using a tight stop just below the breakout zone to minimize risk.

BTC Smart money Bullish don’t be fooled !**BITCOIN MICROSTRUCTURE ANALYSIS: Institutional Accumulation Through Order Flow Divergence**
The current BTCUSD market structure presents a compelling case study in institutional accumulation mechanics, utilizing sophisticated order flow analysis to identify smart money positioning ahead of retail market participants.
**Technical Infrastructure Analysis**
The convergence of multiple analytical frameworks reveals a coordinated accumulation pattern across various timeframes and exchanges. Volume Profile Analysis on the primary chart indicates substantial institutional interest between $108,000-$110,000, with the Point of Control (POC) establishing a robust foundation for directional bias determination.
**Order Flow Microstructure Dynamics**
The Bitfinex footprint data reveals critical microstructural imbalances that traditional technical analysis often overlooks. The current candle displays a **-4.52 delta** with price resilience at $109,480, indicating aggressive institutional absorption of retail selling pressure. This negative delta combined with price strength represents a classic **Wyckoff accumulation signature** - large participants are utilizing iceberg orders and hidden liquidity pools to build positions without triggering algorithmic momentum systems.
**Smart Money Positioning Mechanics**
Three key indicators confirm institutional accumulation:
1. **Cumulative Volume Delta (CVD) Divergence**: Both spot and perpetual markets showing negative CVD (-95.77K spot, -50.05K perp) while price maintains elevation, indicating off-exchange accumulation through dark pools and cross-trading networks.
1. **Open Interest Expansion**: The increase from 77.89K to 78.75K contracts with minimal funding rate pressure suggests fresh institutional capital rather than retail speculation.
1. **Volume Profile Concentration**: The heatmap reveals 105.85M in trading volume concentrated within the $108K-$110K range, representing systematic accumulation rather than random market activity.
**Institutional Arbitrage Mechanics**
The funding rate dynamics (0.001783 with periodic negative spikes to -0.000753) indicate sophisticated carry trade positioning. Institutions are likely utilizing the negative funding periods to establish leveraged long positions while simultaneously hedging through spot accumulation, creating a self-reinforcing feedback loop.
**Market Microstructure Implications**
This accumulation pattern typically precedes **Phase C markup** in Wyckoff methodology, where institutional players transition from absorption to active price discovery. The thin volume profile above $112,000 suggests minimal resistance once the breakout occurs, creating conditions for rapid price expansion toward the $113,600 target.
**Risk-Adjusted Positioning Strategy**
The confluence of volume profile analysis, order flow dynamics, and institutional positioning indicators supports a high-probability long bias with the following parameters:
- **Entry Zone**: $109,000-$109,200 (current accumulation range)
- **Risk Management**: Stop loss at $108,200 (below institutional POC)
- **Target Sequence**: $110,653 → $112,000 → $113,600
- **Confidence Level**: 90% (upgraded from initial 75% based on footprint confirmation)
**Forward-Looking Market Structure**
The sophisticated nature of this accumulation pattern suggests institutional preparation for a significant directional move. The combination of hidden liquidity absorption, funding rate arbitrage, and volume profile concentration creates optimal conditions for sustained upward momentum once the $110,000 psychological resistance is cleared.
This analysis exemplifies how advanced order flow techniques can provide substantial informational advantages over traditional technical analysis, particularly in identifying institutional positioning ahead of retail market recognition.
*Position sizing should remain within 3-5% of total portfolio allocation, with dynamic risk management protocols adjusted based on evolving market microstructure conditions.*

Possible buy for BTCUSDT Price is approaching our demand zone
Let's keep an eye 👀
If price will respect our zone.
BINANCE:BTCUSD
Sunday blessings


BTCUSDT Possible Move IntradayHello Traders,
BTCUSD we are likely to sweep 30m high then come back to consilidated area before further move, we shall wait and take the decision after proper confirmation.
Thanks, BINANCE:BTCUSDT.P BINANCE:BTCUSDT.P
minters.

BTCUSDT LongsHello Traders,
Though we are at weekend but as far BINANCE:BTCUSDT.P intraday look, 30M charts showing some bullish momentum to 109600 today.
Thanks,
Minters

BTC/USDT – Breakout Brewing? Eyes on 110K+ Timeframe: 4H | Exchange: Binance | Date: July 🧠 What’s Happening?
Bitcoin just fired out of a bullish wedge with strong volume and is marching inside a clean rising channel.
All eyes now on the golden Fibonacci zone — and beyond!
🎯 Key Levels
📍 Immediate Resistance:
→ $109,940 – Holding at the 0.5 Fib
→ $110,580 – $111,491: Golden Pocket (0.618–0.786 Fib)
→ $112,652: Full Fib Extension + Channel Top
📍 Support Zone:
→ $108,200 – $107,800: Must hold for bulls
→ Below $107.5K = momentum shift ⚠️
🔍 Technical Signals Lighting Up
✅ Bullish breakout from descending wedge
✅ Strong volume confirms breakout intent
✅ RSI at 57+, trending upward
✅ MACD crossing bullish
✅ Stochastic RSI curling from oversold
✅ ADX increasing – trend gaining strength
🚀 Trade Setup (Idea Only!)
Above $110K = bullish continuation
Next stops: $111.5K – $112.6K
Hold $108K = bullish structure intact
Below $107.5K = reevaluate bias
🧨 Summary:
Bulls have the momentum — but can they punch through the golden zone?
$110K+ is the battleground. Break it, and we’re off to $112K+.
💬 What’s your bias? Bulls or bears? Drop a chart or comment below 👇
🔔 Follow for daily setups & sharp market commentary!

BTC Roadmap to 220KApril 9, 2025 marked a historic shift in the Bitcoin market structure. On that day, institutional giants and sovereign funds aggressively stepped in, buying back BTC in large volumes as price retraced to its previous all-time high (ATH) zone around $69K. This wasn't just a typical dip buy — it was a coordinated accumulation event that triggered the fastest 30-day rally in Bitcoin history, pushing the price above $90K, then $100K, and now consolidating just under $110K.
BTC is currently hovering near $110K — testing it for the fourth time over the past two months. This level has evolved into a major macro flip zone, where previous all-time resistance is attempting to become new long-term support.As of now nee just one ignite candle to break major resistance above 110K then will enter to price discovery zone.
HINT:
The current Bitcoin production cost (mining break-even) sits around $100K due to:
Post-halving mining difficulty
Higher energy costs
Institutional-scale mining operations
This implies miners and institutions need BTC > $100K to remain profitable, aligning them on the same side: supporting price, not dumping.
#BTC #Bitcoin #BTCUSDT #CryptoAnalysis #BitcoinBreakout #PriceDiscovery #InstitutionalBuy #CryptoTradeSetup #BTCMacro #BTCBullRun #CryptoTA #BitcoinHalving #CryptoSupercycle #TradingView

BTC: 650 Point Long Trade To 108,650$ (Date: Sat 05 Jul 25)High potential signal as my all signals. Don't miss this opportunity. At least open a trade in demo just to test.
Details:
Entry: Now - 108,100 $
Target Price: 108,650 $
Stop loss: 107,700 $
Trade Ideas:
There is a flag pattern here after a good down trend. So here is possibility for a small pull back till my target price.
Trade Signal:
I provide trade signals here so follow my account and you can check my previous analysis regarding BITCOIN. So don't miss trade opportunity so follow must.
BINANCE:BTCUSDT BINANCE:BTCUSDT.P BYBIT:BTCUSDT.P

BTC/USDT.P ShortMy Trade Thesis & Rationale:
Here is my thinking on this short setup. I believe this is a high-confluence opportunity where the price action aligns perfectly with what I'm seeing in the underlying market dynamics.
1. The Big Picture (Daily/4H Context):
Price is currently operating at a major historical resistance zone ($110k+). This level has acted as a "ceiling" multiple times, making it a high-probability area for sellers to step in.
I've noticed that momentum on the 4-hour chart has clearly stalled, which to me signals buyer exhaustion after the last run-up.
2. The Tactical Setup (1H/15M Price Action):
After stalling at the highs, the price formed a clear distribution range on the 1-hour chart—a sign that sellers were likely absorbing the remaining buying pressure.
✅ THE TRIGGER: My entry is based on a decisive, high-volume breakdown below the key support of this range at $107,300. This breakdown was followed by what I see as a weak, low-volume retest, confirming buyer weakness and offering a prime entry.
3. My Logic:
🎯 TARGET: I've set my take profit at $106,800 because it's located within a dense pool of long liquidations. I believe these levels often act as a strong magnet for price.
❌ INVALIDATION: My stop loss at $107,550 is placed just above the broken structure. If the price reclaims this level, my bearish breakdown thesis would be proven wrong, and it's my signal to get out.

"Bitcoin to $110,000? Here's What the Charts Are Saying!"📈 Is Bitcoin Going to $110,000?
In this video, we analyze Bitcoin’s current price action and key resistance levels to understand whether BTC is gearing up for a breakout to $110K. Using technical indicators, market sentiment, and on-chain data, we break it down in simple terms so anyone can follow.

The calm before the stormBTC has been rejected at resistance for now, which was to be expected. More importantly, the price is currently trading above the golden pocket of the overall correction. This suggests the correction might be over and that we could eventually break to new ATHs.
$BTC to $107KPrice retraded into range of equilibrium on the 1h TF and created a bearish OB on the 15m TF and also a bearish rejection block on the 5m TF, which indicates that price might break lower in the next few days, with sellside liquidity pools at $107K.

Evening BTC Trend Analysis and Trading SuggestionsLet's review this afternoon's market performance. The BTC price, as we anticipated, rebounded to around 109,000 in the afternoon before plummeting sharply. Living up to "Black Friday", this violent drop was well within our expectations. In the afternoon's live trading, we also reminded everyone that as long as there was a rebound to the upper zone, it was a good opportunity to go short. This drop has created a space of nearly 1,500 points. Currently, the BTC price has pulled back to around 107,800.
From the current 4-hour K-line chart, after a strong upward surge, the market encountered significant resistance near the upper track of the Bollinger Bands. As bullish momentum gradually faded, the price started to come under pressure and decline, suggesting that the short-term upward trend may come to a temporary halt. At present, the market has recorded multiple consecutive candlesticks with large bearish bodies. The price has not only effectively broken below the key support level of the Bollinger Bands' middle track but also caused the Bollinger Bands channel to switch from expanding to narrowing, indicating that market volatility is decreasing. In terms of trading volume, it showed a moderate increase during the price pullback, which further confirms the authenticity of the bearish selling pressure.
BTCUSD
sell@108000-1085000
tp:107000-106000
Investment itself is not the source of risk; it is only when investment behavior escapes rational control that risks lie in wait. In the trading process, always bear in mind that restraining impulsiveness is the primary criterion for success. I share trading signals daily, and all signals have been accurate without error for a full month. Regardless of your past profits or losses, with my assistance, you have the hope to achieve a breakthrough in your investment.
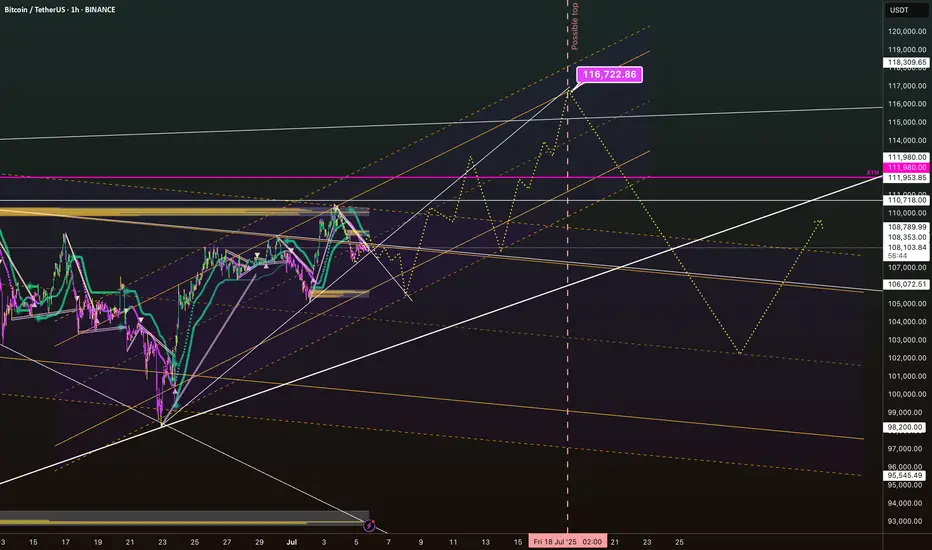
BTC/USDT July Outlook: Road to 116K or a Trap Below?The current structure shows Bitcoin consolidating after a strong bounce off the June lows. We’re now forming a potential bullish continuation pattern within a clear rising channel (dashed yellow lines), but the price is currently testing a mid-channel liquidity zone around $108,000–$110,000.
Key observations:
Local resistance zone: $111,980 (marked ATH) – a major liquidity magnet that could trigger a squeeze if broken. Support range: $106,000–$103,000 – strong confluence zone if price rejects current structure. Potential fakeout: Liquidity dip down to the $98,200–$95,500 zone is possible before a mid-July reversal (highlighted yellow path and vertical time marker on July 18).
Upside target: The upper channel boundary and projected fib confluence points to a bullish target of $116,722 by mid-to-late July.
Invalidations:
Sustained break below $95,000 could negate the bullish structure and push us into deeper correction territory.
Timing: The key date to watch is around July 18, where multiple structural lines and projection paths converge.
What’s your bias for July? Trap and rip… or stairway to 117K?
#Bitcoin #BTCUSDT #CryptoAnalysis #TradingView #LiquidityZones #BTCJulyOutlook
#BTC Update #3 – July 5, 2025🟠 #BTC Update #3 – July 5, 2025
Bitcoin is currently in a corrective phase following its latest impulsive move. To confirm that the correction is complete, I’d need to see a fresh impulsive leg. Until then, price may continue to pull back .
Looking at the liquidation heatmap, I’m seeing stacked liquidity between $107,100 and $106,500 . Based on that, I wouldn’t be surprised to see BTC wick down toward $106,000, sweep that zone, and potentially initiate a long-biased impulsive bounce.
If that bounce materializes, my first target is the $110,000 region . It’s also worth noting that Bitcoin is currently sitting inside a supply zone, which could add short-term resistance before any breakout.

BTC Prediction This is a Bitcoin price chart with a potential short entry strategy. The chart shows a resistance level at 252.53, and a support level, indicating a key point for price movement. The entry for the short trade is marked at 108,126.76, with a target price of 107,000. The stop loss is placed at 108,126.76, suggesting a minimal risk for the trade. The chart also highlights the target value and a potential loss scenario.

#BTC Update #2 – July 5, 2025🟠 #BTC Update #2 – July 5, 2025
I still see $112,000 as Bitcoin’s next major target. That said, the $110,000 zone continues to offer strong resistance, and price hasn’t managed to break through it with conviction yet.
If BTC can’t clear $110K with momentum, I expect a potential pullback. For now, I consider price action to be stuck in a decision zone. Without a clean breakout above $110K, I wouldn’t be surprised to see a deeper correction before any meaningful upside continues.

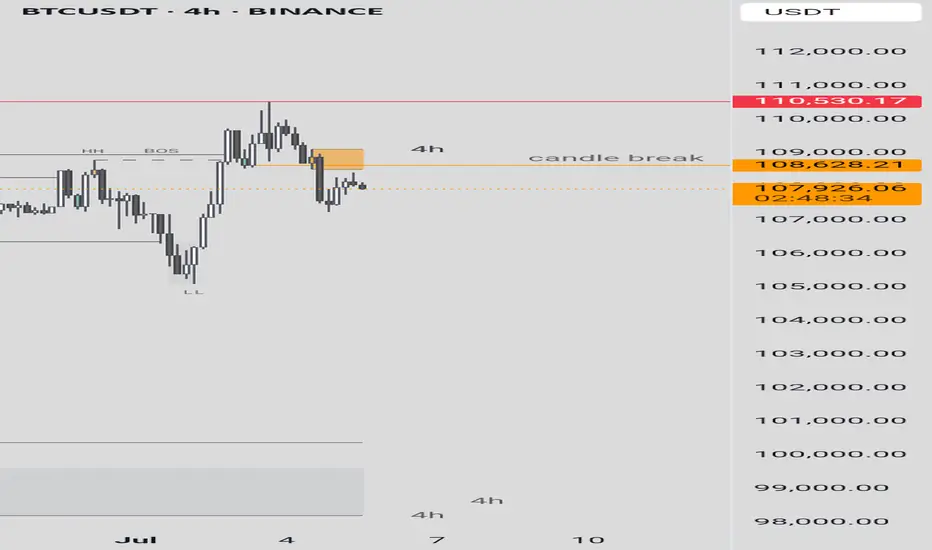
BTCUSDT This is a 4-hour candlestick chart for BTCUSDT on Binance, covering the period from June 4 to July 4, 2025. The chart includes technical analysis annotations such as:Higher Highs (HH) and Higher Lows (LH) indicating an uptrend.Lower Highs (LH) and Lower Lows (LL) suggesting a potential downtrend or consolidation.CHOCH (Change of Character) marking a shift in market structure.BOS (Break of Structure) indicating a break in the previous trend.A red horizontal line at 110,530.17, possibly a resistance level.An orange dashed line around 108,259.99, possibly a key support or pivot level.Price levels on the right (e.g., 110,530.17, 108,628.21) showing recent highs and the current price at 01:01:45.The chart shows a recent upward movement followed by a sharp drop, with the price currently near 105,000. This could indicate a rejection at resistance or a breakout attempt.
Overall, the market is currently trending down in the short term, but there is a chance for a comeback if support holds. Monitor the key levels of 105,000 and 102,500 for further confirmation.
BTC/USDT Back Test Perhaps it's not surprising to say that I see a chance to put the $99,000 zone back in the test. Just because of the FVG. Even if it doesn't happen, I see an upward trend now.

Btcusd techinical analysis.Btcusd techinical analysis next move psibale at h1 time frame.not finchinal advice.
