BTC/USDT Back Test Perhaps it's not surprising to say that I see a chance to put the $99,000 zone back in the test. Just because of the FVG. Even if it doesn't happen, I see an upward trend now.
BTCDOWNUSDT trade ideas

Btcusd techinical analysis.Btcusd techinical analysis next move psibale at h1 time frame.not finchinal advice.


BTC SCALP Tradeas long as BTC doesn't closes below the mentioned area on 1hr tf, it will bounce and hit the fresh sellers SL. Once we have a closing below the area it can take correction upto 98-97K area.

BTC Scalp Long / Buy SetupWait for the entry first, BTC must sweep the liquidation levels below side first then it should start pumping towards the tp, if it takes 2nd tp first then trade is not valid, if it takes first tp and then come back at entry level trade is still valid. if 4hr candle closing below the Bullish OB then close the position otherwise wick doesn't matter.

BTC Analysisfor here no trade zone, short from mentioned zone and keep the sl tight, I would prefer long from the 100k zone, if we get daily closing below the mentioned zone then will long from 92-90k area, target still remains the same 112k-120k

BTC short setup As previous weekly went good on BTC, a nice bounce from the area on swing setup. Now wait for the liquidity grab from 107.8k then take short, that whiteline is important to break and sustain for btc to continue it's Bullish trend. Longer sl is just to avoid wick damage closing matter here. Good luck, book at least 50% on 105.2k rest hold the position, and take long from mentioned zone.

Bearish Bias
Bitcoin is currently trading around 107,849, showing signs of downward pressure:
🔻 MACD: Bearish crossover — MACD line is below the signal line, momentum is weakening.
🔻 Stochastic RSI: Rejected from mid-levels and turning down — indicating potential continuation of the bearish trend.
🔻 Moving Averages: Price is hovering below MA30 and struggling to reclaim key levels like 108,250.
📉 Key Levels
Resistance: 108,250 – 108,600
Support: 107,590 → 107,222
If BTC breaks below 107,590, expect further downside toward 107,222 or even 106,900.
🧠 Outlook: Bearish bias remains in the short term unless BTC reclaims and holds above 108,250 with volume.

BTCUSDT PRICE PREDICTION If Bitcoin closes two consecutive candles below the 50 Moving Average with full body confirmation, then nothing can stop the price from dropping further — unless it eventually touches the 112,000 level.

BITCOIN BITCOIN ,instead of forecasting the price movement i will follow its action, it doesn't matter the direction ,am always right because i follow the direction.
break of the current supply roof on 3hr is a buy confirmation and target will be 115-117k and if we retest and fail to break the descending 3hr supply roof we are selling and target will be 94k (ema+sma ) 4hr demand floor and aggressive sell will be around 90k zone .
NOTE ;everybody is a good trader ,but not everyone is patient enough to wait for a free trade.
trading is 100% educated probability ,don't take it personal.

BITCOIN BITCOIN ,instead of forecasting the price movement, i will follow its price action,
break of the current supply roof on 3hr is a buy confirmation and target will be 115-117k and if we retest and fail to break the descending 3hr supply roof we are selling and target will be 94k (ema+sma ) strategy 4hr demand floor and aggressive sell will be around 90k zone .
NOTE ;everybody is a good trader ,but not everyone is patient enough to wait for a free trade.
trading is 100% educated probability ,don't take it personal.
focus on learning ,rather than how rich you want to become overnight.

#Sell Bitcoinmy trading system is based on divergency and fibo.
#Sell Bitcoin
entry price = 108000$
T.P = 106400 $
S.l = 108700 $
RR = 2.5
Outside of the analysis🔔 The Awakening of Legendary Whales | 9 Transactions from 14-Year-Old Wallets! 🔔🕯
Today, the market witnessed a rare event:
Addresses that had been completely dormant since 2011 (back when BTC was under $2!) suddenly woke up — each moving 10,000 BTC, worth around $1 billion!
📌 Details of some transactions:
💸 10,000 BTC
💵 Approx. ~$1.08B
📤 From: A wallet inactive for 14.2 years
⌛️ Time: 18:15
💸 10,009 BTC
💵 Approx. ~$1.079B
📤 From: A similar address, slightly different amount
⌛️ Time: 18:32
🖥 Analysis:
This simultaneous awakening of multiple ancient wallets, along with the movement of BTC toward exchanges, suggests:
There might be a large-scale plan behind the scenes
Possible market play by first-generation whales
Or a project undergoing restructuring and asset redistribution
👀 Interesting fact: In 2011, these addresses were only worth around $34,000. Today? They're moving billions.
💎 When Bitcoin’s past wakes up, the future starts to tremble…
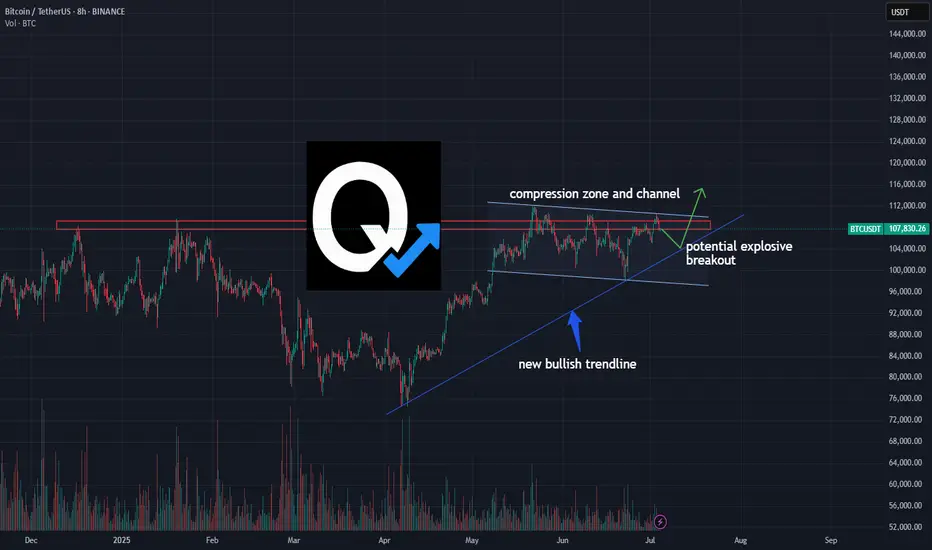
BTC/USDT – Compression Points to Potential Explosive BreakoutBitcoin is grinding into a major compression zone between horizontal resistance and a new bullish trendline. Volume is tightening, structure is intact, and the pressure is building.
This 8H chart highlights a classic breakout setup — a squeeze inside a channel, supported by an ascending trendline that has held clean since April.
🚀 A breakout above $110K could open up rapid upside continuation.
🧭 A retest of the trendline would offer a possible high-reward long entry.
📉 Breakdown invalidates the structure — watch $104K closely.
This is not financial advice — just a breakdown of what the chart is showing. Trade safe, think independently, and manage your risk.
#BTC #Bitcoin #CryptoTrading #BTCUSDT #TechnicalAnalysis #BreakoutSetup #CompressionZone #QuantTradingPro
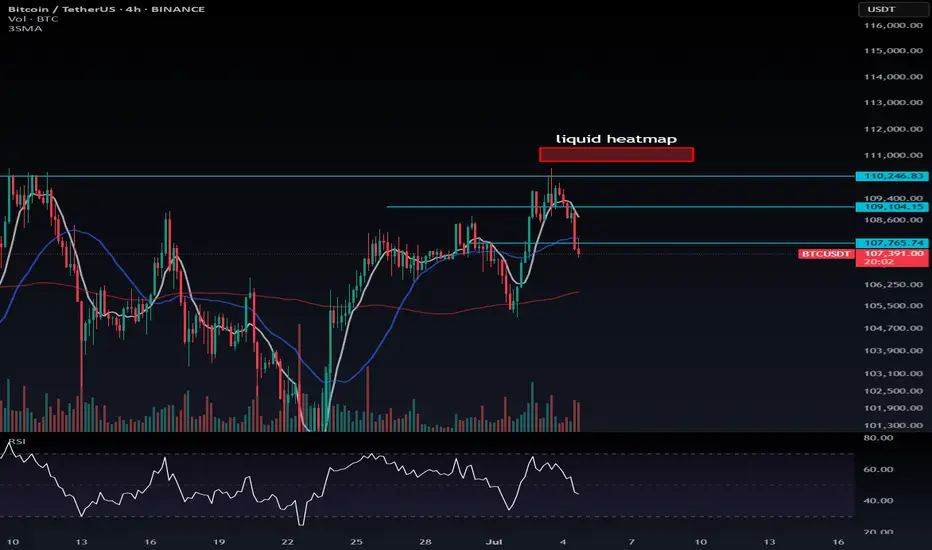
BTC shorting opportunity comes againBTC climbed above 108000 again, and the short-term bullish power was slightly stronger. According to the current strength, BTC still has room for growth, but it is still under pressure in the 109000-110000 area in the short term; if there is no major positive news, BTC may find it difficult to break through the resistance area in the short term under the current conditions, and may even experience stagflation and retreat again after approaching the resistance area.
Therefore, I think shorting BTC with the help of the resistance area is still the first choice for short-term trading. We can boldly short BTC in the 108500-109500 area and look towards the target area around 106000 again.

BTC Trade SetupBTC will not take any major correction until it sweeps upside liquidation and close with big red candle, So take the long only on BTC. Wick possible below the SL. I will hold the trade without sl if it comes to entry, if tp achieved first then ignore the trade. Also July breakout possible for BTC, July always positive for BTC, let's see.


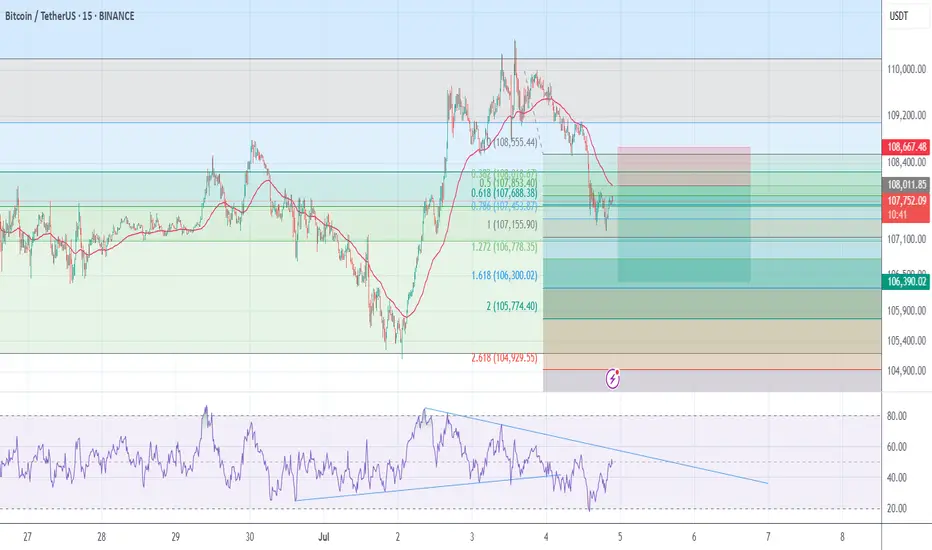
BTCUSDT 30-Min | Microstructure Breakdown at Key ConfluencePrice Action:
BTC rejected from Fib 0.5–0.618 zone (110.2K–111.5K), aligning with rising channel resistance.
Failed breakout attempt above local highs (~109.6K) → price sharply reversed.
Clean breakdown from rising wedge/channel support (blue) and EMA cluster.
Support/Resistance:
Immediate support at 107.5K (red horizontal) now under pressure.
Next key support: 106.6K zone (channel lower bound, Fib cluster, previous demand).
Resistance remains strong at 109.8K–110.2K (gray zone + trendline).
Indicators:
Volume spike during recent breakdown = bearish confirmation
Multiple consecutive sell signals after EMA flattening = momentum shift
Minor bounce attempts got rejected at descending EMA stack
🎯 Quick Take:
Bias: Bearish below 108.2K
Scalp short active while price is under red horizontal + EMAs
Watch for bounce attempt near 106.6K–106.3K
Invalidation: Clean reclaim of 108.6K + bullish volume

Tripple Top There was a clear Tripple top pattern by BTC from the 1day chart view. According to how to trade Tripple top.
HOW TO TRADE TRIPPLE TOP
Wait for price to fall below neckline (bottom line under mountains).
Boom! Price break neckline = sell
Target:
Measure from top of mountain to neckline
That size = profit distance down
Stop loss:
Put above last mountain (safe from bear attack
No guess. No hope. Wait for break. Then smash sell.

Is Bitcoin still bullish?Many still don't realize that the US economy is based on selling stable debt, for example, they give a loan to one country with a two-year repayment period, then they give the same loan in the form of another loan to another country with a shorter period, for example, one year.
With this description, I think that with the huge volume we have had for sale in the past months, the price should now have a deep correction.

Bitcoin Bulls Are Losing Power - Signal To Sell NOW!!!?Bitcoin Bulls seem to be losing power. If this rising wedge aka Contracting triangle starts to break down, the descending triangle we are trading at will resume and MARKETSCOM:BITCOIN might go as low as $93k!!! Is your trading strategy ready for that?

BTC Looking To Break Above Resistance Of Bull-FlagBTC showed a strong move off support at 100310 that is now looking to break above resistance of the bull-flag, which will signal the end of the decline. A daily break above 106800 is confirmation of the uptrend continuation, which should target ATH in the first instance. Following a pullback, BTC should then make its way to new highs, with a first target at 138000, which is a 100% extension from 74500, with a bull-flag mid-point.
Trades
Long on a break above the descending resistance (close on the 30min chart)
Add to long position on a break above 106800
Reduce position size at 112000, to allow for a brief pullback or potential consolidation at ATH
Return to 100% allocation on a solid close above 112000 or a pullback to 106800

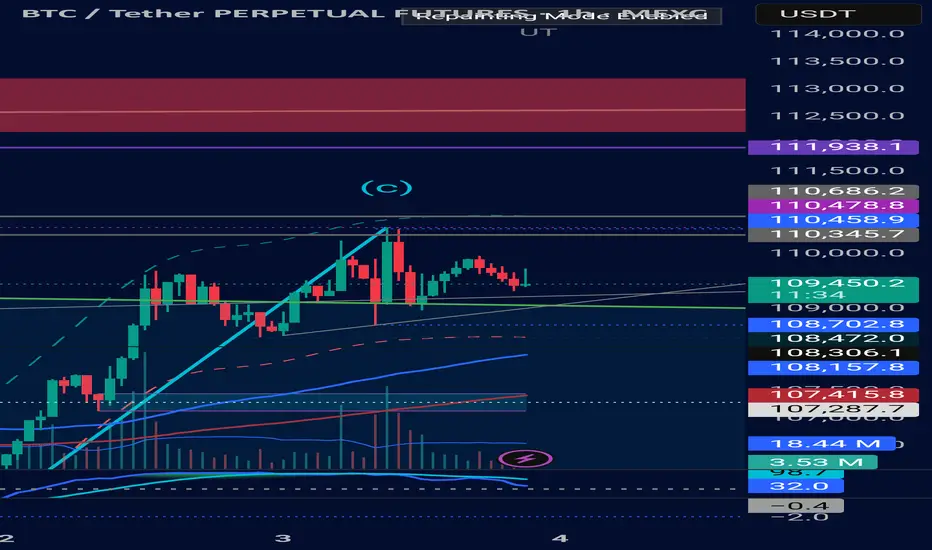
Btc Wyckoff distribution Based on the Wyckoff distribution methodology, the current chart suggests an upward trajectory, considering the presence of unfilled CME and FVG gaps. The anticipated scenario involves a continuation of the UT phase, potentially reaching targets around 112k/113k, followed by a correction towards the CME gap at approximately 102.5k. Subsequently, a continuation into the UTA phase is expected, which may indicate the conclusion of the bull market.