BTC weekly price predictionthis is my personal idea and analysis and i dont follow any other one analysis
BTCDOWNUSDT trade ideas

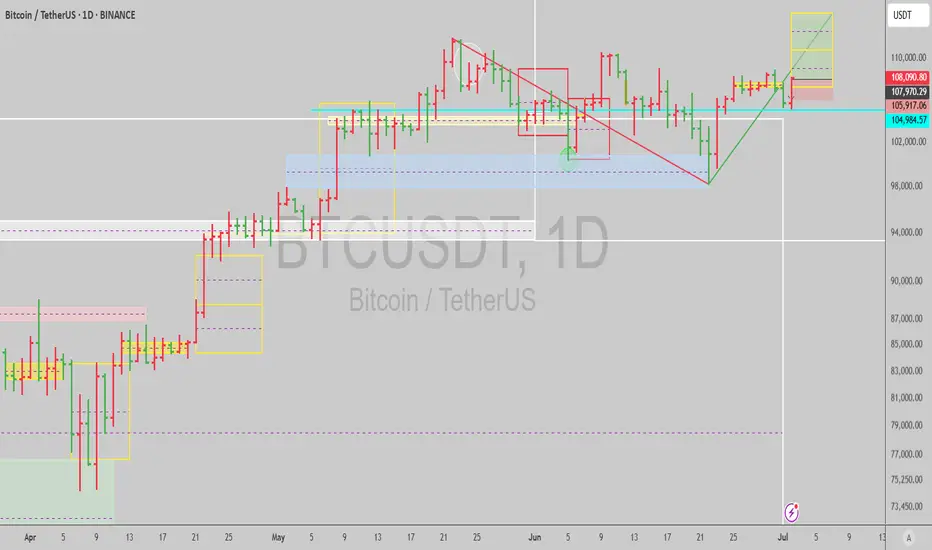
BTCUSDT daily analysisia have shared one hour timeframe analysis and this is daily timeframe and i am following priceaction candle and volume with SMC and more my own personal and private strategies

Bitcoin Just Broke Out! Is $117K Next? (MA50 + Fibo 161% Confirm🚨 MAJOR BTC MOVE!
After weeks of consolidation, Bitcoin has officially broken the downtrend and showed a strong bounce from the MA50, turning previous resistance into support.
📈 Setup Breakdown:
✅ Downtrend breakout confirmed
✅ Clean reaction from MA50
✅ Long entry triggered with upside targets
🎯 Target 1: $112,644 (161% Fibo)
🎯 Target 2: $117,351
📊 This could be the beginning of a new leg up. Watch price behavior at key levels and manage risk accordingly.
💬 What’s your take? Are we heading to $120K or is this a bull trap? Drop your thoughts below 👇
🔁 Like & Share if you caught this move!
📺 Follow for more real-time setups @ TradeWithMky 🧠📉
—
“TradeWithMky – where altcoins speak louder than Bitcoin!”

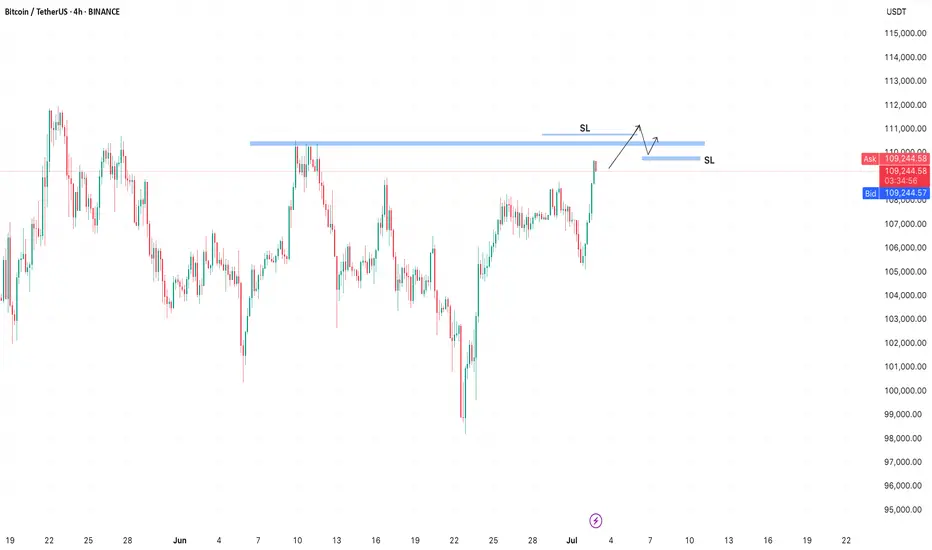
BTC inverted head n shoulder to 120kBTC inverted head n shoulder to 120k. I'm sure everybody has seen this set up but I just wanted to document it for myself.
A break and re-test of 109500 could get us to the measured move of 120k.
I'm laddering in.

BTCUSDT price predictionafter crossing up supply area and tuching the price given market is comming down again for long time

BTCUSDT Daily – Bullish Engulfing = Big Move?Whenever we've seen a bullish engulfing candle on the daily timeframe, it’s often followed by a strong upward move. This pattern has repeated consistently throughout the current cycle.
🔹 The recent daily close shows a clean bullish engulfing right off the 50 EMA support.
🔹 Previous purple zones also highlight areas where similar engulfing candles led to sharp rallies.
🔹 Price is once again reclaiming momentum after a liquidity sweep — a classic accumulation signal.
📈 If history repeats, we could be eyeing another leg higher toward the $112K–$115K zone.
Pattern Psychology:
"This bullish engulfing isn’t just a candle — it's a sentiment shift, where buyers overpower sellers completely in one session."
🔹EMA Bounce Strategy:
"Price is using the 50 EMA as a trampoline — a typical smart money support zone."
🔹 Rejection of Breakdown Narrative:
"The fakeout below 100,582 support could be a classic bear trap, setting up for a liquidity-driven rally."
🔹 Pivot Zone Reaction:
"Immediate pivot zone (102,292) reclaimed — price now in a favorable position to target next R1 around 110,000."
🔹 Historical Context:
"This setup mirrors the March bounce, where similar structure and RSI/MACD confluence led to a 12% surge."
⚠️ Disclaimer:
This is not financial advice or a buy/sell recommendation. Analysis is for educational purposes only.
All chart markings and interpretations are original.

Bitcoin Prepares for Upward MoveBitcoin has formed a flag pattern, indicating consolidation at a structural base. A confirmed breakout on the daily chart would strengthen the case for a continued upward trend.

BTC - will it touch ATH @ 112K ?Well the move of BTC was moved just touching the 4H or 1H ob acted as a well cushion and moved up, Looks like this is going to happen for once and then can be seen!

Check support at 108316.90-111696.21
Hello, traders.
If you "Follow", you can always get new information quickly.
Have a nice day today.
-------------------------------------
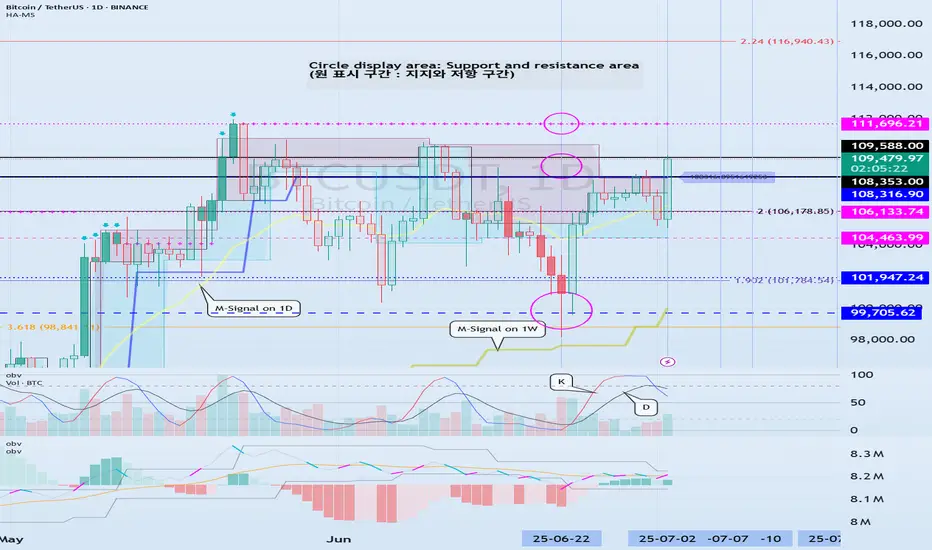
(BTCUSDT 1D chart)
Among the many trend lines, the one marked 1W is the important one.
Therefore, we need to look at whether it can rise above the 1W trend line or rise along the trend line.
If not, and it falls below 108316.90, it may lead to further decline, so we need to think about a countermeasure for this.
This volatility period is expected to continue until July 3, but it is expected to last until July 11, so caution is required when trading.
-
Indicators that indicate high points are DOM(60), HA-High, and StochRSI 80.
HA-High and StochRSI 80 are formed around 108316.90, and DOM(60) is formed at 111696.21.
Therefore, the 108316.90-111696.21 section is a high point boundary section, and if it is supported and rises in this section, it is highly likely that a stepwise uptrend will begin.
The conditions for a stepwise uptrend to begin are:
- The K of the StochRSI indicator must show an upward trend below 80,
- The PVT-MACD oscillator indicator must show an upward trend above the 0 point,
- The OBV of the Low Line ~ High Line channel must show an upward trend. If possible, it is better for the Low Line ~ High Line channel to form an upward channel.
When the above conditions are met, I think that if it is supported and rises in the 108316.90-111696.21 section, it is highly likely that a stepwise uptrend will continue.
If the above conditions are not met, it is likely that it will show a downward trend again while pretending to rise.
-
Thank you for reading to the end.
I wish you successful trading.
--------------------------------------------------
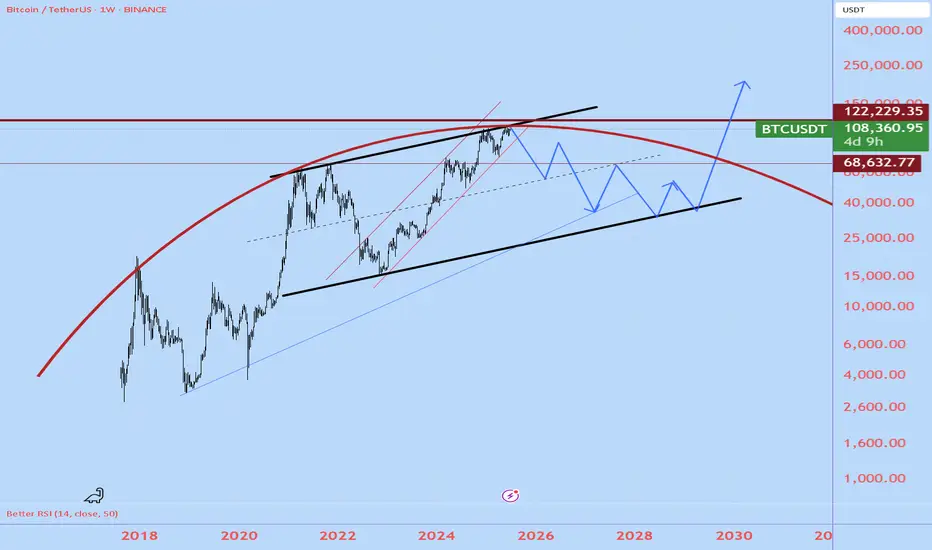
- This is an explanation of the big picture.
(3-year bull market, 1-year bear market pattern)
I will explain more details when the bear market starts.
------------------------------------------------------
BTC is approaching a strong zone!BTC has a strong zone around 110,500 where a large number of orders are stacked.
In crypto, it’s common for stop losses to be taken on both sides.
After a breakout above the zone, short sellers get liquidated, while buyers enter the market — only to be stopped out by a false breakout when the price drops below the zone to trigger their stops.
Btcusd techinical analysis.Btcusd technical analysis next move posibale at h1 time frame.not finchinal advice.

BTC massive sell BTC massive sell is about to begin
Wait for confirmation
Buyers are active in the supply zone
Watch out for potential turning points
To the down or upside.
Proper risk management is advised
Happy trading.

BTC Just Breakout! Are we ready for new ATH? BTC just breakout from 4h trendline and anticipate for any retracement soon before sky rocket into new ATH, historically saying my target will be on $148k.
NFA!!
DYOR!!

BTC short squeeze in the makingMany people believe that BTC is running "too hot," and we're seeing what appears to be a short squeeze. We all know what's next. No one in their right mind will buy at the top, esp. given it's volatility. Some economic events are right around the corner over the next 1-2 weeks which could impact BTC and S&P. Typically, market rallies are short lived, esp. when the fundamentals are out of whack. Unemployment is cooling (remember is a lagging indicator), high # of bankruptcies, housing unaffordability highest in decades, high interest rates, student loans will start making a dent soon...the list goes on. Don't let the Champagne effect fool you! Berkshire stocking up on cash for a reason.
Best of luck and always do your own DD! Staying positive, with a healthy dose of keeping things real.

Bitcoin - Flag pattern is brokenBitcoin had been consolidating within a flag pattern for the past three months. That pattern has now officially broken to the upside, with the price surging to $109K — a strong bullish signal fueled by encouraging news around institutional adoption.
Based on both the technical flag breakout and ongoing fundamental momentum, the next target for Bitcoin is $145K. Any move beyond that would be considered a bonus in this current bull cycle.
Stay tuned for more updates.
Cheers,
GreenCrypto

BTC Weekly Analysis : Rise or Fall ? Let's SeeBy analyzing the #Bitcoin chart on the weekly timeframe, we can see that last week’s candle closed at $108,350, and BTC is currently trading around $107,500. If the price manages to hold above $105,700, we could expect further upside momentum. The next potential bullish targets are $111,700, $124,000, and $131,800.
So far, this analysis has yielded over 9% return, and we’ll be sharing more updates soon from lower timeframes!
🎥 If you enjoyed this video analysis and found it helpful, please show your support with a LIKE and COMMENT below!
These video-style breakdowns take time and effort, and I’ll only continue them with your support 🙌
Your engagement is my biggest motivation to keep going 💛
Thanks for being part of the journey!

BTCusdtWill BTC go for another 4-year cycle? Everything is possible..
I think the next weeks will be conclusive to see if we can stay in the red channel or will go down.
I believe BTC will reach about 35K, but in a zigzaggy way, giving push to altcoins seasonally.
It is just speculation
BTC SCALP TradeWait for the entry then take with small amount no high risk must use SL. If BTC don't retrace towards 106.5k in coming hours then don't take risk on shorting it will breakout towards 113k

HUGE SHORT ON BTC - SIMPLE AS THATas per title. Don't need to mention, it very easy to know that it will drop.
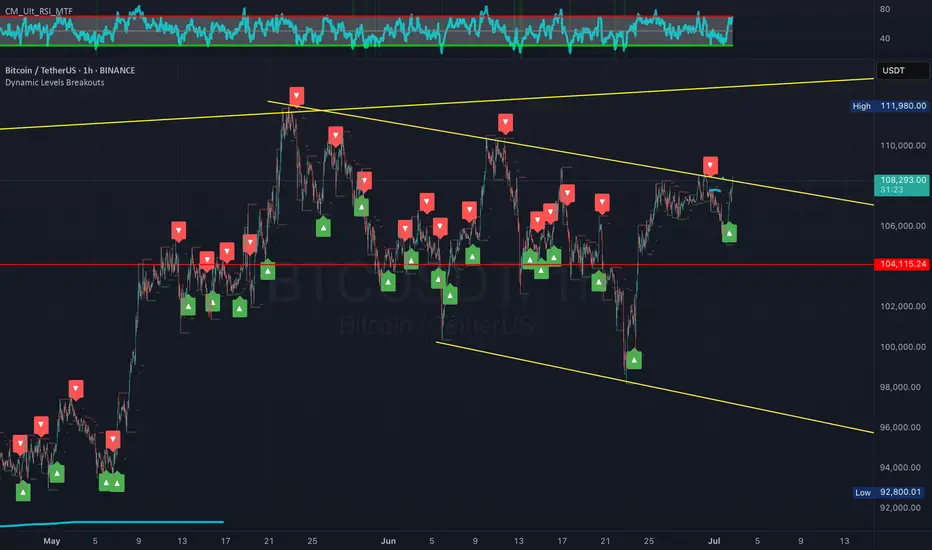
Bitcoin Breakdown? Support Zone & CME Gap in FocusBitcoin ( BINANCE:BTCUSDT ), as anticipated in my previous analysis , attacked the Resistance lines and then resumed its decline. In previous analysis, both Long and Short positions could have been profitable .
Bitcoin is approaching a Support zone($106,800-$105,820) and the CME gap($106,645-$106,295) .
From an Elliott Wave theory perspective , it appears that Bitcoin has finally completed a five-wave impulsive move with the help of an Expanding Ending Diagonal .
I expect Bitcoin to attack the Support zone($106,800-$105,820) after breaking the lower line of the Expanding Ending Diagonal .
Note: To break through the Support zone($106,800-$105,820), Bitcoin may potentially use either a Head and Shoulders pattern or a Bearish Quasimodo formation.
Note: If Bitcoin breaks the Resistance lines, we can expect more pumps.
Cumulative Long Liquidation Leverage: $106,249-$105,094
Cumulative Short Liquidation Leverage: $109,483-$108,790
Please respect each other's ideas and express them politely if you agree or disagree.
Bitcoin Analyze (BTCUSDT), 1-hour time frame.
Be sure to follow the updated ideas.
Do not forget to put a Stop loss for your positions (For every position you want to open).
Please follow your strategy and updates; this is just my Idea, and I will gladly see your ideas in this post.
Please do not forget the ✅' like '✅ button 🙏😊 & Share it with your friends; thanks, and Trade safe.

BTC - Perfect Trendline TestOur previous post can be found here: www.tradingview.com
From what we were pointing out yesterday how BTC was testing our trendline of support - today we have seen the fulfillment of this move as we saw two more touchpoints of support on the trendline and are now making our way back towards the red trendline as stated in our last post.

$BTCUSDT: Bullish trend resumingBitcoin turning bullish in the daily confirming the correction is likely over and longer term timeframe trends will resume next if it gets follow through.
See monthly, it fired a trend on close during June, bullish till EOY easily as per this forecast:
Best of luck!
Cheers,
Ivan Labrie.
How I Use Bybit Referral Code BY500 for BTC Scalping –Live TradeBTC/USDT – 4H Scalping Setup with Real Price Action Zones & Channel Analysis (Bybit Referral code BY500 Chart) Over the past few weeks, Bitcoin has been moving within a clear ascending channel with multiple pullbacks creating scalp-worthy entries on the 4H timeframe. In this analysis, I’m sharing my current BTC/USDT scalping strategy built around support/resistance, channel breakouts, and confluence zones—all visualized on the chart above.
Current BTC Setup:
BTC is currently trading near $107,800, having bounced from the $100,769 red support line
A potential retest of the descending wedge is underway
The price remains above a critical long-term support zone marked in blue channels, suggesting a bullish mid-term outlook
Why I Use This Strategy
My scalping technique is based on identifying high-probability zones within channel ranges, especially in confluence with long-term trendlines. This strategy is particularly effective when using exchanges with low fees and fast execution.
I personally trade this setup using a platform that offers deep liquidity and competitive trading fees (hint: chart is from that platform). Lower fees = better ROI per scalp, especially in volatile conditions.
Scalping Tools Used:
Channels: To identify swing zones and trend continuation
Volume zones: (Not shown here, but used on execution layer)
Multi-timeframe confluence
Support/Resistance flips
Pro Tip:
If you're an active scalper, always watch for:
Wick rejections at trendlines
Volume surge near breakout
Failing rallies as signs of retracement
usE bYBIT referral Code - BY500
These are all visible in this BTC structure.
