Bitcoin (BTCUSDT) Market Update – DailyBitcoin remains in a tight range between $110,221.73 (resistance) and $101,546.27 (support). These two levels are the main reference points for initiating high-probability trades.
🔸 Market Context:
The primary trend is bullish, so the priority remains on long setups.
Short positions should only be considered below $101,546.27 with confirmation.
With the prevailing bullish structure, early entries can be taken with a low-risk trigger at $108,746.08.
🔸 Moving Averages & Momentum:
The SMA 7 has caught up with the daily candles, but we haven’t seen a strong reaction yet.
If today's candle wicks above the SMA 7, we can more confidently pursue long setups starting tomorrow.
Otherwise, we may see a pullback toward the SMA 25, especially given the decreasing volume typical of ranging phases.
🔸 Lower Timeframe Setup (1H/4H):
A micro range box can be observed between $108,746 and $106,649.78.
If price approaches $108,746 with increasing volume, that can serve as a valid long trigger on intraday timeframes.
⏳ Final Note: Patience is key while BTC trades inside this range. The bullish structure remains intact, and opportunities for long trades are more favorable for now. Wait for clean breakouts or volume-based confirmations before entering new trades.
#BTCUSDT #BitcoinAnalysis #CryptoUpdate #BTCPrice #CryptoStrategy #BitcoinRange #LongSetup #TechnicalAnalysis #TradingView
BTCDOWNUSDT trade ideas

BTC - New month, new monthly Power Of ThreeNew monthly Power Of Three:
4 weekly candles to form a monthly candle.
So there will be 4 weekly PO3 within 1 monthly PO3.
Accumulation => Manipulation => Expansion
I anticipate the first week there should be a accumulation phase.
Determine the previous dealing range to find out the premium and discount range.
Short term trades back into the discount range and long term continues higher.

Bitcoin Faces Resistance Rejection — Bearish Divergence Signals Bitcoin is showing signs of exhaustion as it stalls near a high-timeframe resistance level aligned with the value area high (VAH). Recent price action has formed multiple lower timeframe bearish divergences while testing dynamic resistance. This level has now capped further upside attempts and could trigger a market rotation lower if rejected again.
With price consolidating directly beneath this barrier, the probability of a pullback grows stronger, especially if no bullish confirmation breaks the current ceiling.
Key Technical Points:
- Bearish Divergence Developing: Price is holding below the VAH with a weakening momentum signature
- Converging Resistance Zone: Dynamic SR and VAH are aligned at $108,350, now acting as a ceiling
- Range-Based Rotation Setup: If rejected, price could rotate down to the point of control and value area low
Bitcoin’s current structure is classic range behavior, with price gravitating from low to high and back. At the moment, it’s stalled at the value area high, which represents the upper boundary of the most recent range. This level — around $108,350 — has been tested several times, and now a bearish divergence is forming across key momentum indicators like RSI and MACD.
In addition, price is showing multiple rejections against dynamic resistance, forming a pattern of lower highs on lower timeframes. The longer this resistance zone holds, the more likely price will revert to the point of control (POC) — the area with the highest traded volume in the range. If that level doesn’t hold either, a full rotation to the value area low becomes the next probable scenario based on market auction theory.
This rotation would represent a complete cycle from value area high acceptance back to value area low rejection, which is common when buying pressure fades and sellers regain control. For now, Bitcoin remains technically vulnerable as long as price stays capped beneath the $108,350 level.
Bitcoin’s next move hinges on whether it can reclaim the $108,350 resistance zone with volume. If not, expect a corrective phase that targets the POC first, followed by potential continuation down to the value area low. This bearish setup remains valid until price closes decisively above current resistance.

BTC on Close Compression -110k?Not now, but looks like will test 107,800 again from the point, what say?

BTC Short Swing Ideaswill be shot on bearish mode to btc with simple indicator, sign on major rejection trend within hourly timeframe and will targeting the next possible retracement at nearest support box. DYOR.
BTC — ATH or Lower High? Patience for the Next SwingBINANCE:BTCUSDT | 4h
Patience here — waiting for the next high-probability swing.
Major levels to watch: $111,990 (range high), $108,950 (weekly), $100,300–103,000 (demand).
Next move: ATH attempt or another lower high? Will act when the reaction sets up.

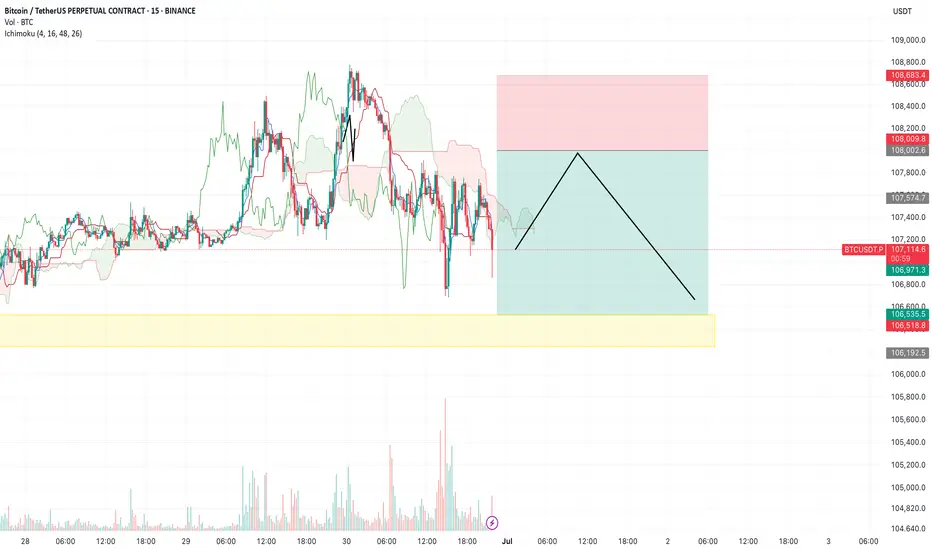
BTC/USDT – Trade Review & New Plan (15m, Ichimoku) by RiscoraYesterday’s short setup didn’t work out as planned — stop-loss was hit as bulls showed strong momentum. However, I still believe that a move to the yellow block (downside liquidity zone) is possible, and the idea remains valid.
The main mistake was with the stop placement, not the scenario itself. After taking a loss, I’m more cautious: reducing risk, lowering position size, and entering with less conviction. Bulls were dominant yesterday, so I’m keeping my risk tight on this trade.
I’ll take the setup again, but with a more conservative approach. If price breaks and holds above my stop-loss level, it will confirm a shift in sentiment to bullish, and I’ll look to flip my bias accordingly.
Key points:
Previous short was stopped out — reviewing risk
Still see potential for a move to the yellow block
Lower risk, smaller size after a loss
If price holds above stop, trend flips bullish
Let’s see how this plays out.
#BTC #Crypto #Trading #Ichimoku #Riscora
Bitcoin Short-Term Outlook – Coming Week📈 Bitcoin Short-Term Outlook – Coming Week
Currently, Bitcoin is expected to gather liquidity around the $106,000 zone, potentially initiating a move toward the $110,000 resistance level.
This area will be crucial in determining the next directional move.
🔍 The market's reaction around $110,000 will be closely monitored, and the analysis will be updated once that level is reached.
📌 Note: This outlook is based on current market conditions and may require adjustments if sentiment or price structure changes.

BTC - Still StrugglingPlease refer to the last post:
We have been monitoring BTC at this red trendline for a potential breakout. In this post we are examining a lower timeframe (6H) to see how this structure is developing.
Price tried to rally to the red line, but sellers came in and swiftly pushed price back down. This is looking to be a third rejection at this red trendline so far.
Buyers are also fighting on the LTF. We have seen the low/mid $106k levels acting a support.
A break below $106k could lead to a drop back to our white trendline. This white trendline was recently established with 2 points of resistance (red arrows) followed by it being flipped into new support with 2 touchpoints (green arrows). Depending on when/if this trendline is tested it could bring BTC anywhere between $103-105k. Will update this post if that does happen.
In the meantime our three areas to watch on the lower timeframes.
-A break above the red trendline
-The midline around $106k continuing to hold
-The white trendline being tested

BTC/USD Multi-Timeframe Analysis – 1H & 5m🕐 1-Hour Overview:
BTC is currently consolidating inside a range-bound structure, showing signs of indecision.
Resistance Zone: $105,000 – $106,000
Support Zone: $100,000 – $101,000
The price must break out of this box to define the next major direction.
➡️ A bullish breakout above 106K could lead to $108K+
⬅️ A breakdown below 100K may trigger downside momentum.
⏱ 5-Minute Execution Zone:
The 5m chart shows a rebound from an oversold move, forming higher lows and approaching key resistance.
Minor Resistance: $107,000
Key Breakout Level: $107,400
🎯 Trading Scenario:
If we get a strong bullish candle closing above $107,400
Then: Entry Long with target near $108,000
Stop Loss: Below recent 5m low – around $106,800
✅ Strategy Context:
Timeframe alignment between HTF and LTF
Scalp entry with confirmation
Risk managed around structural zones
🔗 Powered by ALIP FX
📌 Follow for more ideas, and smart scalping setups
#Bitcoin #BTCUSD #Scalping #PriceAction #ALIPFX

The only plays you need this week! 🚀 Join us as we dive into the highs and lows of Bitcoin this week! 🔥
Opportunities like this don’t show up every day — and we’ve got a strong feeling there’s a 10X trade hiding somewhere in this video! 👀💰
We’re locked in on the charts like eagles 🦅, watching closely to see if any of our setups come to life. You won’t want to miss what’s coming next! 📈📊
✨ Stay tuned for daily updates, smart setups, and sharp moves! ✨
📅 Weekly Schedule:
🛠️ Daily Setups: Monday to Friday
🎓 Class: Every Tuesday (if stars align 🌟 – subject to confirmation)
Let’s make it a big week! 💪🚀

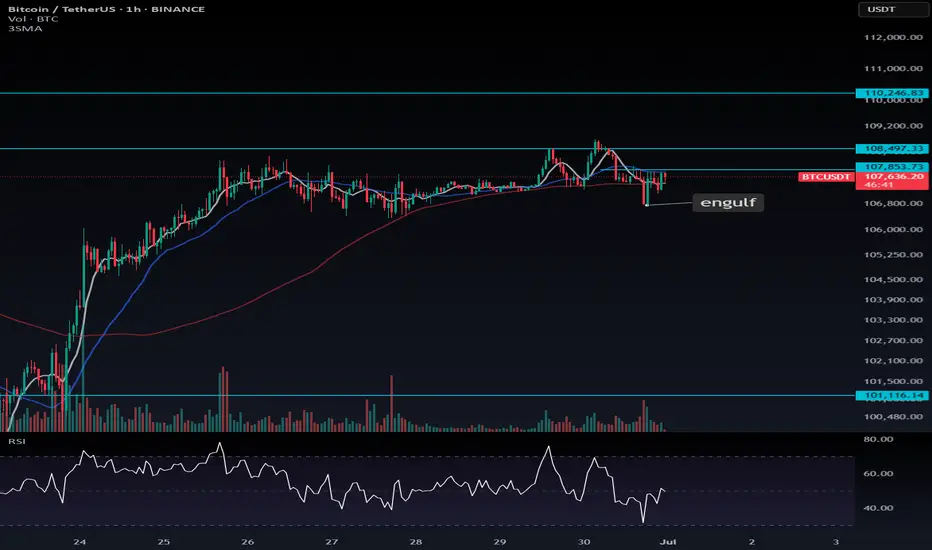
BTC Bullish Engulfing – Multiple Long Opportunities🚀 BTC Bullish Engulfing – Multiple Long Opportunities
Following the bullish engulfing candle, there are two potential long entries for Bitcoin:
🎯 Aggressive Entry: at $107,853.7 (higher risk)
✅ Conservative Entry: at $108,497.3
🔐 Stop-loss advice:
Place your stop either:
At a level that won’t be easily hit by short-term noise, or
At a level that confirms a short-term trend reversal if breached.
📈 If neither trigger plays out, set a stop-buy order at $110,246. A strong breakout is likely above this level, so don't miss it if momentum kicks in.
🧠 The choice is yours:
Enter early and accept the risk of getting stopped out
Or wait for confirmation and risk missing the trade
📌 If you’re already in a BTC long based on earlier signals, consider opening a position in high market cap altcoins to diversify exposure.
---
💬 Which entry level are you going for — early risk or breakout confirmation? Let me know in the comments! Always curious to see your strategies.
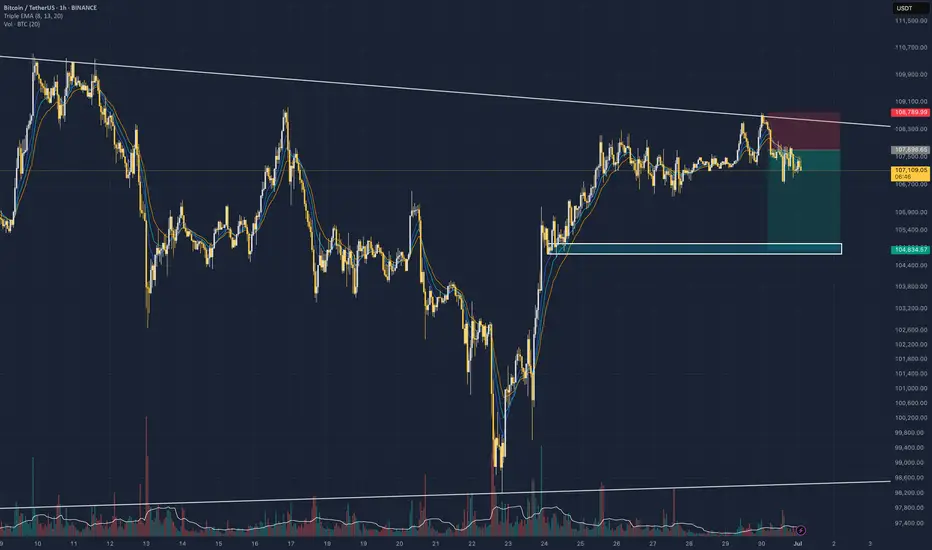
Short BTC, it is about to retrace and test 100000 again!As BTC gradually fell back, the rebound did not stand above 110,000 in the short term, proving that there is strong selling pressure above, and the trend line formed by the technical high point 111,000 and the second high point 110,000 formed an important resistance area, which limited the rebound space of BTC and strengthened the demand for BTC's short-term retracement.
According to the current trend, the short-term oscillation bottom area of 106,000 may be broken at any time. Once it falls below the oscillation area, it may arouse a certain degree of profit-taking chips and stimulate BTC to accelerate its decline. I think BTC will at least test the 105,000-104,000 area again during the retracement, and may even test the 100,000 integer mark again.
Therefore, shorting BTC is still the preferred option for current short-term trading.
Consider shorting BTC in the 108,000-109,000 area, and the target area in the short term is 104,500-103,500. After breaking this area, the target can be extended to 101,000-100,000.
BINANCE:BTCUSDT BINANCE:BTCUSDT BITSTAMP:BTCUSD

BTC limit BIDPlacing bids at the Key S/R level and targeting buy side liquidity and stops at the bearish structure
reason for the limit setup is liquidity wicks around the 106500-106400 and market makers will try to take that liquidity after monthly open or daily open

BTC - Bullish SOON!Hello TradingView Family / Fellow Traders. This is Richard, also known as theSignalyst.
BTC has been in a correction phase, and it feels like it's taking forever! ⏳
As long as the blue trendline holds, the overall bias remains bullish. 📈
As BTC approaches the blue trendline—perfectly aligning with a demand zone and support—we'll be watching for trend-following longs to catch the next big impulse move upward. 🚀
For now, we wait! ⏳
📚 Always follow your trading plan regarding entry, risk management, and trade management.
Good luck!
All Strategies Are Good; If Managed Properly!
~Rich

BTC needs to hold up here. BTC is at a very important level. A role over is expected, but without market structure confirmation, it's important to consider the possibility of a move up. The bearish thesis on lower timeframes is the easy one. Ensure your bullish thesis is also considered. A confirmed lower low or a lower high would confirm a CHOCH reversal.
Full TA: Link in the BIO

BTC TIME TO HEAD SOUTH BTC has given a CHOCH
Proper risk management
Sit tight as we ride to 102634.59 region.

BTCUSDT| Bounce from Channel SupportBTC just bounced cleanly off mid-channel support (~106.8K) within the descending structure.
Held above EMAs and reclaimed key short-term support.
If price holds above 107.2K → likely retest of 108.4K channel resistance.
Break and close above 108.5K = trendline breakout → 110K+ possible.
Break below 106.8K = failed bounce → 105.5K next demand.
Bias: Bullish while holding above 107.2K.

Bitcoin will no longer update ATH, and here's why⚡️ Hello, everyone! I decided to update my idea about Bitcoin. Let's see what awaits us!
Bitcoin rebounded strongly over the weekend and is now trying to consolidate at the $107,000 level. This is a key level, which is the MSB level for the entire current momentum since May, and as long as the price remains below it, it is a bearish movement.
Last week, we also closed the GAP to the $98,000 level from the previous movement, but on the way up, we formed a new one at $105,250 - 101,360. And as we know, 99% of GAPs close sooner or later.
📉 Bitcoin also continues to move in a descending flag, which, although it is a bullish pattern in an upward impulse and more often breaks through upwards, has not been working that way for a long time. Trading based on technical analysis is the basis of crypto and has become very widespread, which is actively used by many whales and counterplayers. As a result, many pattern signals have long lost their relevance and now often give false signals.
⚙️ Metrics and indicators:
Volume - divergence with price since the end of April. Throughout this upward momentum, purchase volumes continued to decline. This indicates a lack of liquidity and demand for Bitcoin at present.
Money Flow - also divergence with price. Also, since the end of April, positions have continued to close and liquidity has continued to decline. This indicates a lack of interest in the asset.
Liquidity Depth - we know that the price moves from liquidity to liquidity, which serves as its fuel. And now there is much more liquidity at the bottom than at the top.
Support/Resistance - Based on the volume of interest, it is clear that the $106,000 level is a major zone, and if it is lost, the nearest support level will only be at $103,004, but with significantly lower volumes.
📌 Conclusion:
Despite all the huge inflows into ETFs, there is now even less liquidity in Bitcoin than in November 2024, when Trump became president.
This suggests that everyone is actively closing their positions and there is no new money coming in. Search queries for the tags “crypto” and “bitcoin” are not even close to last year's levels, let alone 2021 levels. This means that there is no new retail interest in crypto right now.
I don't see any catalysts right now that could keep the price at this level. And ETFs are not an indicator at all; we've already seen how these “smart money” buyers bought at 110k on ATH and sold even more at 70k.
🔥 So, right now, I recommend sitting back and watching. Let the market sort itself out and indicate the direction of movement going forward.

BTCUSDT Trade SetupBTC Still in sideways no major move, wait for the entries. While on weekly tf still expecting a final shakeout, 95-93k then a final leg up towards to 120k. For now wait for the entries to be filled first then must use sl.

30-Minute Chart – Rising Wedge BreakdownBreakdown from 30m rising wedge confirmed with volume. Retest at 107.5K failed. Price now under EMAs.
4H also broke rising channel → rejection from 108.4K.
Key support: 106.4K.
Break below = 105.2K target.
Reclaim 107.5K = upside risk to 108.8K+.
Bias: Bearish below 107.5K.
Volume confirms move.

Bitcoin is weakeningThere is a divergence in bitcoin chart. The bull is losing it power and we may got a long correction in six months.

MONDAY - TRADE OF THE DAYFew nice plays over the weekend shame I am not active on weekends.
I will be posting a video later today so see you in class!
