BTC next boom beginning I'm going to see boom in btc
Here’s the analysis of Bitcoin’s (BTC) next expected move in English, based on current market conditions and technical indicators:
---
### **1. Short-Term Outlook (Next 24-48 Hours)**
- Bitcoin is currently trading around **$107,400**, with **$108,000-$109,000** acting as a strong resistance zone.
- If BTC breaks above **$109,870** and closes above it, the next target could be **$114,950**.
- If the price fails to break resistance, a pullback to **$105,300** or **$103,900** (support levels) is possible.
- The **30-minute RSI is at 52.22** (neutral-bullish), and the MACD histogram is in positive territory.
---
### **2. Medium-Term Outlook (1 Week to 1 Month)**
- **Coincodex predicts**:
- **$116,914** (+8.98%) by July 2025.
- **$136,858** in the next 3 months.
- **DigitalCoinPrice forecasts**:
- Average price of **$221,961** by late 2025, with a potential high of **$235,354**.
---
### **3. Key Technical Indicators**
- **4-Hour Chart**:
- BTC is testing the **upper Bollinger Band ($108,672)**. A breakout could target **$114,956**.
- **Support Levels**:
- Immediate support: **$105,358** (EMA 100).
- Strong support: **$103,996**.
---
### **4. Market Sentiment**
- The **Fear & Greed Index** is currently at **74 (Greed)**, indicating bullish sentiment but also potential overbought conditions.
- **Volume**: Stable buying volume suggests sustained interest, but a drop could signal consolidation.
---
### **5. Potential Scenarios**
- **Bullish Case**: Break above **$109,870** → Rally toward **$114,950-$116,000**.
- **Bearish Case**: Rejection at resistance → Drop to **$105,300-$103,900**.
BTCDOWNUSDT trade ideas

BTC - LONG SET-UPBINANCE:BTCUSDT
Bitcoin is currently testing its critical resistance level
If the price gets rejected here, the key support to watch is the $𝟏𝟎𝟏,𝟐𝟎𝟎 - $𝟏𝟎𝟐,𝟖𝟎𝟎 zone. This area represents a strong demand level where a potential buying opportunity could emerge.
For a trade setup based on this support, a strategic Stop Loss (SL) should be placed below the $𝟗𝟖,𝟎𝟎𝟎 mark to manage risk.
For now, patience is crucial. Keep a close eye on the price action

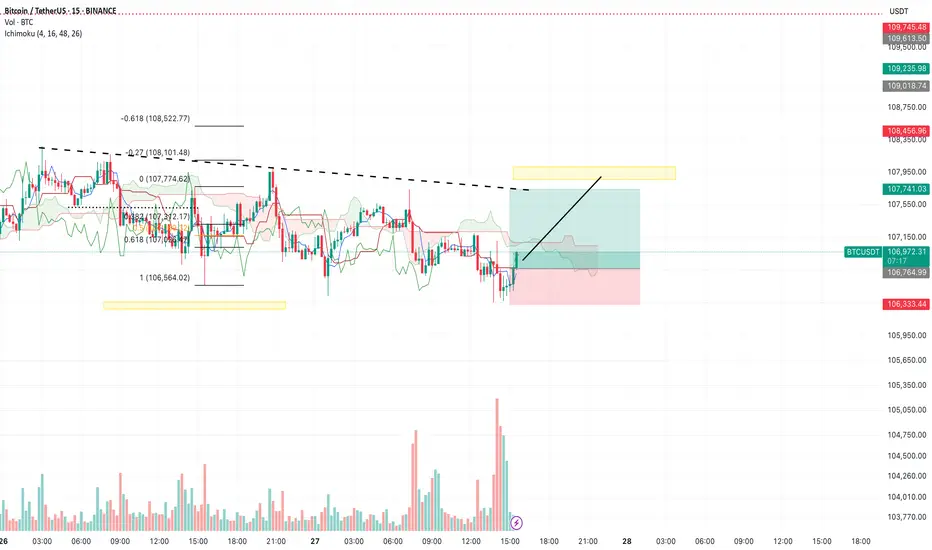
BTC/USDT.P – Intraday Plan (15m, Ichimoku) by RiscoraPrevious idea played out. The last candle showed strong volume and a wick to the upside, signaling some liquidity has been taken.
From here, I expect either a minor high above that wick or a correction down to the 0.618 area, then continuation of the bullish move towards the yellow liquidity block.
If price breaks below recent lows, the 106,300 level has proven itself as solid support—buyers have stepped in there twice with strong volume, so I’m not expecting it to give way easily.
Overall, I anticipate another push up to collect liquidity above and will reassess once price reaches the upper range.
Watching price action closely for confirmation.
#BTC #Crypto #Trading #Ichimoku #Riscora

BTC/USDT – Intraday Plan (15m, Ichimoku) by RiscoraToday’s idea:
We’ve seen strong volume at the current support zone. My expectation is for a move upward towards the yellow block at 107,900, targeting liquidity that has accumulated above the dotted trendline.
This is my main scenario for today: a range-bound session with a liquidity sweep to the upside. Watching for reaction as price approaches the yellow zone.
#BTC #Crypto #Trading #Ichimoku #Riscora
BITCOIN - SHORT OPPORTUNITY AND LACK OF MOMENTUMBINANCE:BTCUSDT has been lacking momentum in the last few days. It looks to me that "Good News" is almost "No News" in regards to the Iran war or any crypto legislation. Summer is looking a lot like sideways movement, and due to the previous explosion in momentum and volume, I think the lack of it will bring the price down in the following days or weeks.

BTCUSDT 1D📈 #BTC Plan for July – Bullish Setup in Play
Bitcoin is forming a bull flag pattern on the daily chart — a classic setup that often leads to strong upward continuation when confirmed.
🔹 Key Indicators
• MACD is building positive momentum
• RSI is holding above 50
• Price is trading above the MA50 and the Ichimoku Cloud, indicating strong underlying support
📍 Strategy
We're buying here and will consider adding more near the key support zone:
$98,200 – $99,613
📈 Potential breakout targets (on confirmation):
🎯 $112,471
🎯 $116,880
🎯 $121,288
⚠️ Reminder
Always use a tight stop-loss and apply proper risk management.
Breakout confirmation with volume is crucial.

Waiting for the Liquidity Flush – Will We Get That Drop or a StoCurrently holding a short position and have been waiting for a decent liquidity flush towards my TP zone for almost a day now. The thing that bothers me is how slow the price action is—it's grinding lower, but at the same time, building up a new liquidity shelf just above my entry.
This makes me concerned that we might see a quick liquidity sweep to the upside (taking out stops, possibly including mine) before any real move down happens. The area around my TP is loaded with liquidity, but the market seems hesitant to make that push.
What’s your opinion—are we likely to get that clean drop soon, or should we brace for a fake-out and stop hunt first?

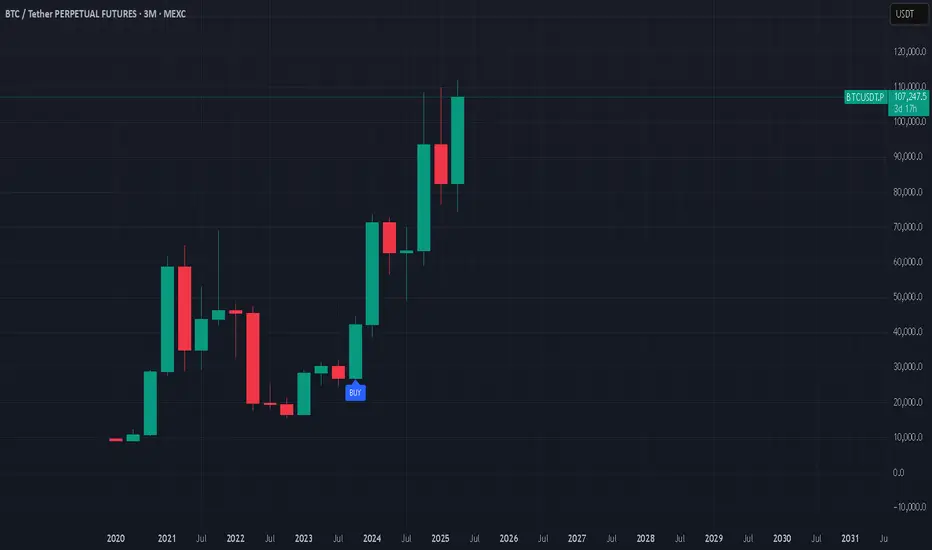
BTC 1W ideaLooks like Bitcoin is in the middle of the distribution which targets at $160k. Flag pattern.

HolderStat┆BTCUSD aiming for 112kBINANCE:BTCUSDT is forming a bullish continuation structure after bouncing from the mid-range. With support holding and consolidation patterns completing, price action suggests a rally toward the 115,000 resistance line. Triangle and consolidation behavior confirms a strong uptrend continuation setup.

#BTC/UST#BTC
The price is moving within a descending channel on the 1-hour frame, adhering well to it, and is on its way to breaking it strongly upwards and retesting it.
We are seeing a rebound from the lower boundary of the descending channel, which is support at 106,000.
We have a downtrend on the RSI indicator that is about to break and retest, supporting the upward trend.
We are looking for stability above the 100 moving average.
Entry price: 106,600
First target: 106,750
Second target: 107,000
Third target: 107,291

Bitcoin Controlled consolidation above 106,480 Technical Overview – Summary Points
➤ BTC trades in the 1st quartile of its yearly range (100k – 111k).
➤ Stacked resistance zone: 108,239 to 110,603 USDT → potential seller exhaustion.
➤ Key support at 106,480; defensive cluster 102,626–99,581.
➤ Risk On / Risk Off Indicator = Strong Buy; ISPD Divergence = Neutral.
➤ Normal volume, but lack of fresh capital → sustainability of rally questionable.
__________________________________________________________________________________
Strategic Summary
➤ HTF trend bullish above 106,480; breakout > 108,239 targets 109,950 / 110,600.
➤ Buy swing pullbacks on 106,480 or 104,600. Invalidation < 102,626 = drop to 99k.
➤ Tactical short scalps around 108,250–109,000.
➤ Core PCE = major catalyst (June 27).
➤ Watch spot volumes, funding, and Risk On / Risk Off signals.
__________________________________________________________________________________
Multi-Timeframe Analysis
➤ 1D : bullish bias > 106,480; danger < 102,626.
➤ 12H : bullish consolidation; confirmed breakout > 108,239.
➤ 6H : compression; buy dips 106,480 / 104,600.
➤ 4H : lateral-bullish; key support = 104,600.
➤ 2H : neutral-bullish; triggers = 107,800 / 106,000.
➤ 1H : bull flag; micro-divergence, prefer long > 106,950.
➤ 30 min : tight triangle; breakout at 107,200 / 106,650 = signal.
➤ 15 min : bearish < 106,950, expected bounce on 106,480.
__________________________________________________________________________________
Macro, News & On-Chain Analysis
➤ Macro backdrop: “Higher for longer” stance continues, no FOMC imminent.
➤ Core PCE June 27: upside surprise (2.7% YoY vs 2.6% expected) – USD supported, potential headwind for risk assets.
➤ Pacific Region: ongoing tensions in Taiwan Strait and South China Sea:
- Increased military activity: air incursions, naval maneuvers.
- High risk of escalation flagged by defense analysts & social feeds.
- Risk sentiment: volatile – sudden events could trigger risk-off.
➤ On-chain: Range 100–110k; weak spot volume; cautious leverage; no major sell-side imbalance.
__________________________________________________________________________________
Conclusion
➤ BTC maintains a controlled bullish bias > 106,480.
➤ Swing buy zones = 106,480 & 104,600; targets 109,950 / 110,600.
➤ Main risk: break < 102,626 = sell-off toward 99k.
➤ Monitor Core PCE and geopolitical risk in the Pacific region.
__________________________________________________________________________________

Why BTC hasn’t moved up recentlyBTC has been bobbing above and below this bearish triple crossover the past few months. What we see as consolidation is rather price getting stuck around these resistance levels.
The only reason why this would be occurring in my view, is due to the market makers having intention to allow this drop to play out.
The resistance is located at around 107,000 to 107,400 - watch this zone closely for a hold below / rejection and fast drop.
Scenario 1 marked with solid red line.
Scenario 2 marked with dotted red line.
Little update for y’all. Happy weekend trading.

Bitcoin may reach resistance level and then start to declineHello traders, I want share with you my opinion about Bitcoin. Previously, the price was trading inside a well-defined downward channel, repeatedly rebounding from both the support and resistance lines. Each upward move got rejected within the seller zone, especially around the 108500 - 109200 range, which acted as a strong barrier multiple times. Later, BTC dropped to the buyer zone near 102700 - 102000, and from there, we saw a strong impulse up. This impulse broke through the channel resistance line and the support area, indicating a short-term bullish breakout. At the moment, the price is approaching the resistance level at 108500, which previously served as a turning point. Given that this area also aligns with the upper boundary of the seller zone, I believe we may see another reversal from this level. In my opinion, after reaching resistance, BTC may start a new downward wave, targeting the 102700 support level. This is where I’ve set my TP 1. Considering the recent breakout, the historical significance of the resistance, and the strong reaction from seller zones, I remain bearish in the short term and expect a potential decline toward support. Please share this idea with your friends and click Boost 🚀
Disclaimer: As part of ThinkMarkets’ Influencer Program, I am sponsored to share and publish their charts in my analysis.

BTCUSDTHi snipers. On the one-day timeframe, we are witnessing the formation of a harmonic pattern called a flag. This pattern usually forms in the middle of a trend and then the previous trend continues. The flag consists of two parts: a bar and a flag. In the flag, the price is moving in a channel between two parallel lines. If the price breaks through and crosses the upper ceiling of the channel, we will probably reach new prices. I am practicing and learning. This is not a buy or sell offer.

BTC 120K READY ???BTC 4H Chart Update 📉📈
Bitcoin is still trading inside a descending channel, but bulls are now testing the upper trendline for a potential breakout.
Price is consolidating just below $107K, showing strength after the recent bounce from the bottom of the channel.
🔹 Structure: Descending Channel
🔹 Current Resistance: $107K–$110K zone
🔹 Break & close above = bullish breakout confirmation
🔹 If breakout and close above 110k than this target possible
🔹 Target after breakout: $112K-120K+
⚠️ Rejection = pullback likely toward $103K–$104K support
📊 Breakout or breakdown — decision time is near!
#BTC #Bitcoin #Crypto #TechnicalAnalysis #BreakoutSetup

BTC - Continuation of Bull Trap 21.06.2025Hello Friday! Never, ever, ever trade crypto on weekend, but let's hop in!
🔻 What I expect more? Continuation of Bull Trap! (Probability 70/30)
Few Reasons:
Price broke 20 EMA(daily) and is sliding just above the 50 EMA with "dead-cat" bounce attempts.
RSI is going down below 50 — momeentuum is faaadiing.
No signs of some big demand at this level (low volume on small green candles + Iran uncertainty).
Notable, that we are far from any bounce move (which would support re-accumulation).
Scenario 1: Bearish Continuation (Most likely)
Expecting BTC to test the 99.5k zone — this is the key support level becasue of several arguments:
1) 0.886 Fib
2) Confluence with previous horizontal range support
3) 100 EMA
4) Under psychological level 100k
5) RSI needs to cool off before taking higher targets.
If 99.5k broken, next stop is near 88.5k (0.786 Fib)
I wouldn't like to analyse further possible downslide of BTC, so lets stay so far in already negative scenario within 88.5k, but let's keep in mind, that maximum pain we will see near 75k zone.
🟡 Alternative: Short-term Bounce (Probability 30/70)
BTC could attempt bounce towards 105–106.5k (retest of broken structure + 20 EMA resistance)
If this bounce has low volume and rejection near EMAs or RSI stays below 50 , it's a sell opportunity — not a bullish reversal.
✅ Final thoughts for short term: stay away from the market.
From 103.5k I would expect downward continuation toward 99.5k with possible minor bounce attempts along the way.
Wait for strong reversal signal near 100k and enter LONG with tight SL.
Don't trade during the weekend, unless there's a once in a lifetime opportunity.
Have fun!

Trade of the day!These are the areas I have my eyes on. We are in a range and can get a long or short play here. If we break bullishly, I will be wary of the supply above, if we break down here there's a lot of liquidity to sweep. Lets see what happens
Confirmation: MS change on secondary TF or Divergences

Called The Bottom GuysThem: "How did you call the start of the Rally?"
Me: ...
#crypto #bitcoin #trading #portfolio

BTC - Double Top after Liquidity Sweep?Price has recently executed a Buy Side Liquidity Sweep just above the previous high. This type of move often signals a potential shift in market direction, especially when followed by signs of exhaustion or failure to push higher. In this case, price has formed a double top near the 106,600 level, a classic sign of weakening bullish momentum and hesitation at a key resistance area.
Following the Sweep, the projection suggests a possible rejection from this region, leading to a corrective move to rebalance the inefficiencies left behind by the sharp upward impulse. These inefficiencies are marked as Fair Value Gaps —areas where price moved too quickly, leaving imbalanced zones between buyers and sellers. The market tends to return to these areas over time as it seeks equilibrium.
The first Gap lies just below the 0.28 Fibonacci retracement and may serve as an initial area for a reaction. If price slices through this level without meaningful support, attention shifts to the second Gap, which aligns closely with the 0.50 to 0.618 retracement zone. This region is historically significant for pullbacks and could offer a temporary pause or bounce.
Should the move extend further, the third and deepest Gap, located between the 0.618 and 0.65 levels , becomes a key area of interest. It marks a critical rebalancing zone that could attract stronger buying interest. If this area fails to hold, the 0.786 retracement level sits just below and may act as a final point for support before any broader directional change.
For refined entries, traders can watch lower timeframes like the 5-minute chart. Look for signs of weakness, such as an inverted Gap or a lower-timeframe break in structure, to time positions with tighter risk. This allows participation in the broader move while maintaining tactical precision.
The confluence of a Buy Side Liquidity Sweep, a double top , and multiple Gaps below provides a clear framework for a potential downside play. As always, let the price action lead.
Patience, confirmation, and context are key to executing with confidence.

Bitcoin possible sell idea Bitcoin appears to be losing momentum, with buying pressure easing. This could signal a short-term selling opportunity as the market enters a correction phase.

BTC - 108k?BTC looks it has power to go more up, remember the more it goes up the more shorts are active, but 108,500 good look for shorts as well!

Forecast for BTC. New ATH on July ? In my opinion , BTC have 2 scenario .
1. Price will retest area 104-106k and retest previous ATH and then go up
2. Price will retest area 98-104k and retest previous ATH and then go up
3. In my opinion , BTC will not go down below 100k .
Now BTC can make a bullish flag pattern , but not valid yet
But anything can happen , so DYOR
