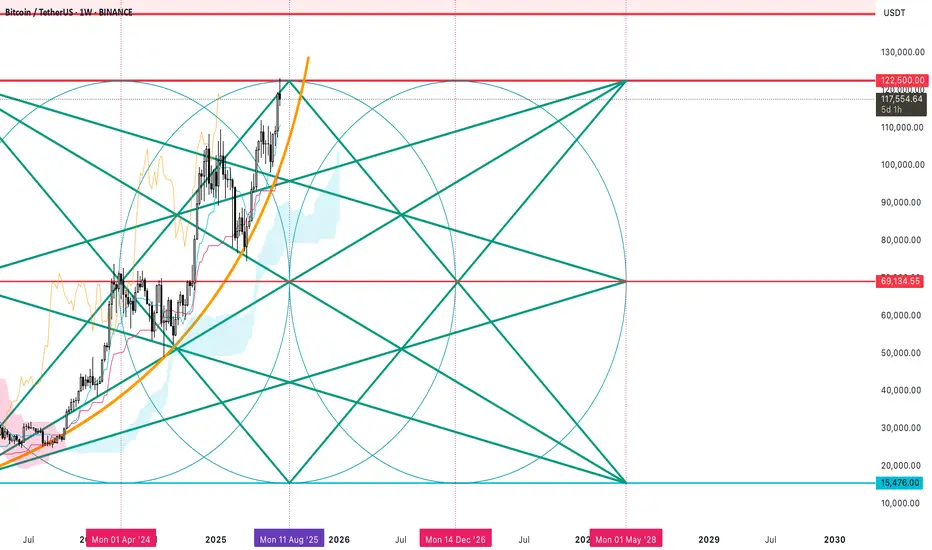
Bitcoin Geometry x IKAGI 2025 - 2028 (Solar Peak)Harmonic angles, and geometry in price and time for Bitcoin.
$122K (Major Level for the system). Potential top
BTCDOWNUSDT trade ideas
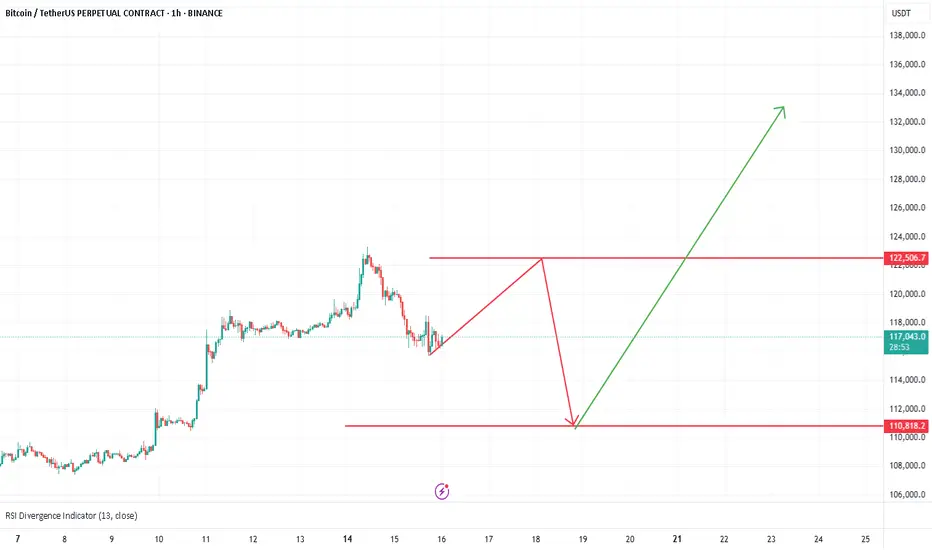
#Bitcoin LTF update #Bitcoin LTF update
After making a high of $123,300, it dropped a bit and made short-term support at $117,000, and currently it is holding at this level.
But it is not strong enough to hold, we will retest the lower level.
IMO, we can see a retest up to $113,000 level approximately.
Where we have 0.382 golden fibre level, which is also aligning with some more important indicators, and most importantly, we have good numbers of liquidation at that level.
If you find my updates helpful, don’t forget to like and follow for more!
DYOR, NFA

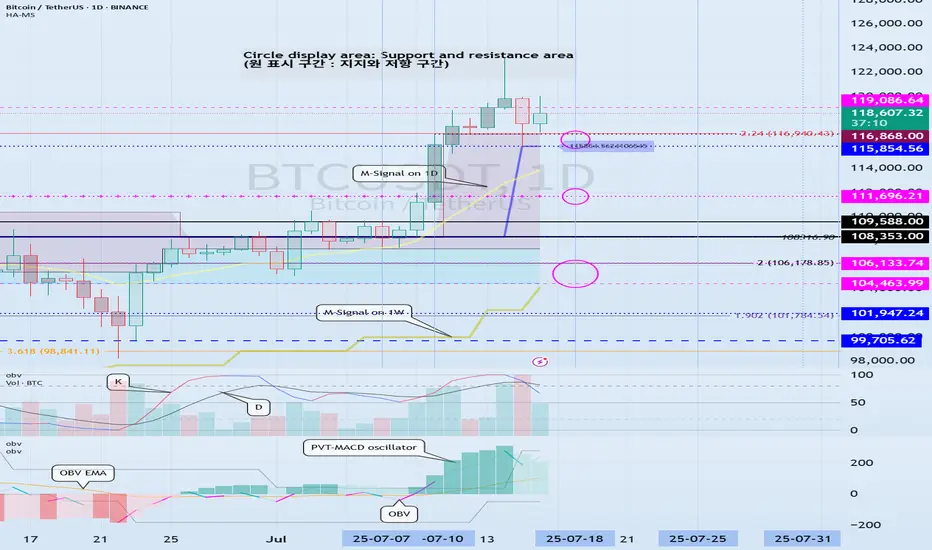
Support and resistance zones: 115854.56-116868.0
Hello, traders.
Please "Follow" to get the latest information quickly.
Have a nice day today.
-------------------------------------
(BTCUSDT 1D chart)
This decline created a new trend line.
This added a period of volatility around July 31st.
If the HA-High indicator is generated at the 115854.56 point, the key is whether it can be supported and rise around that point.
If it falls below the HA-High indicator, there is a possibility of a downward trend.
Therefore, it is necessary to look at which support and resistance points the price is maintained at as it passes the volatility period around July 18 (July 17-19).
-
Since the StochRSI 80 indicator is formed at the 116868.0 point, it is important to be able to maintain the price above 116868.0 if possible.
Therefore, assuming that the HA-High indicator will be generated at the 115854.56 point, the key is whether there is support around 115854.56-116868.0.
Next, since the M-Signal indicator on the 1D chart is rising above 116696.20, we need to check if it is supported by the M-Signal indicator on the 1D chart or around 116696.21.
-
So far, we have talked about how to maintain an upward trend by breaking through a certain point or section.
That is,
- The K of the StochRSI indicator should be below the overbought section and should show an upward trend with K > D.
- The PVT-MACD oscillator indicator should show an upward trend. (If possible, it should be above the 0 point.)
- The OBV indicator of the Low Line ~ High Line channel should show an upward trend. (If possible, it should be maintained by rising above the High Line.)
I said that when the above conditions are met, there is a high possibility that the upward trend will continue.
On the other hand, in order to change to a downward trend,
- The DOM (60) indicator should be created and show resistance near the DOM (60) indicator.
- When the HA-High indicator is generated, it should show resistance near the HA-High indicator.
- When the K of the StochRSI indicator falls from the overbought zone, it should switch to a state where K < D and show a downward trend. (However, caution is required as volatility may occur when K reaches around the 50 point.)
- The PVT-MACD oscillator indicator should show a downward trend. (If possible, it is better if it is located below the 0 point.)
- The OBV indicator of the Low Line ~ High Line channel should show a downward trend. (However, it should show a downward trend in the state where OBV < OBV EMA is present.)
When the above conditions are satisfied, there is a high possibility of a downward trend.
Among these, the most intuitive thing to know is whether the DOM (60) indicator and the HA-High indicator are generated.
This is because, in order to first switch to a downward trend, a signal that the current price position is a high point must appear.
The DOM(60) indicator is an indicator that indicates the end of the high point.
Therefore, if the DOM(60) indicator is generated, it is likely to be a high point.
However, since it can be supported and rise near the HA-High indicator, you should check whether there is support in the HA-High ~ DOM(60) section and respond accordingly.
The HA-High indicator is an indicator created for trading on the Heikin-Ashi chart, and if it falls below the HA-High indicator, it is likely to be a point where a downtrend will begin.
-
Since the same principle applies to any time frame chart you trade, it is easier to understand the chart and determine the timing of the start and end of the transaction.
However, the basic trading method must be a split trading method.
The reason is that if it rises in the HA-High ~ DOM(60) section, it is likely to show a stepwise upward trend, and if it falls in the DOM(-60) ~ HA-Low section, it is likely to show a stepwise downward trend.
This basic trading method, that is, buying near the HA-Low indicator and selling near the HA-High indicator, will eventually make you familiar with day trading, which will have an effective influence on finding a buying point when making mid- to long-term investments.
It is wrong to say that you are good at mid- to long-term investments when you are not good at day trading.
You were just lucky.
Unfortunately, this kind of luck cannot last.
-
Thank you for reading to the end.
I hope you have a successful transaction.
--------------------------------------------------
- This is an explanation of the big picture.
(3-year bull market, 1-year bear market pattern)
I will explain more details when the bear market starts.
------------------------------------------------------

BITCOIN PREDICTION: INSIDER DATA THAT WILL HIT YOU HARD(warning)I am sharing with you my personal insider data of what I know about Bitcoin right now!

Btc chartBtc harmonics chart.
Price should go up to hit 122k to form a bearish pattern, if the pattern will not get invalidated the target area is around 100k - 98k, and that will form a bullish harmonics pattern that will push the price to 132 - 137k and above, if 100k will hold support.
Can Bitcoin reach new highs?Bitcoin reached around 121722, close to the expected target of 130,000. There are two current expectations:
1. Black line: 5-wave rising structure, currently in the 3rd wave rising, and there will be a 5th wave rising after the correction.
2. Purple line: abc rising structure, currently in the last wave c rising, will end the rise ahead of time.
The rise is not yet complete. If it falls below the lower track of the channel, the rise will end.

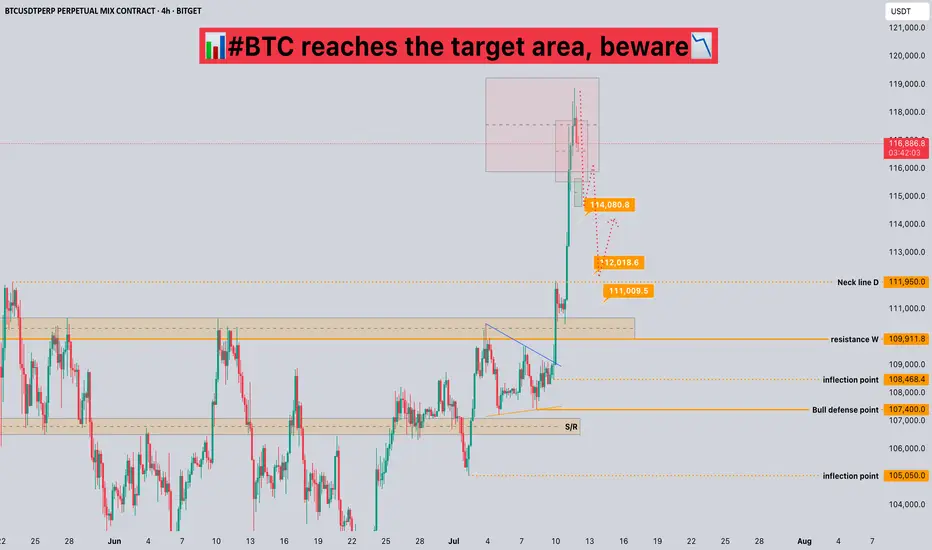
#BTC reaches the target area, beware📊#BTC reaches the target area, beware📉
🧠From a structural point of view, we have reached the target area of the bullish structure, so we need to be alert to the risk of callbacks and do not chase the rise in the target area!
➡️From a graphical point of view, the appearance of the ascending triangle means that the daily level of the upward trend is about to come to an end, so we need to be alert to the correction of the daily level. However, it is worth noting that the bullish trend at the weekly and monthly levels is still intact.
➡️Therefore, if we want to participate in long transactions, we must wait for the callback to occur. The aggressive support level is around 114000, and the stable support area is 110000-112000.
⚠️No matter how the market develops, it is reasonable, so please do a good job of risk management, keep yourself alive first, and then seek profits!
🤜If you like my analysis, please like 💖 and share 💬
BITGET:BTCUSDT.P
Check support at 115854.56-119086.64
Hello, traders.
If you "Follow", you can always get new information quickly.
Have a nice day today.
-------------------------------------
(BTCUSDT 1D chart)
On the 1W chart, the DOM(60) indicator was created at the 119086.64 point.
Accordingly, the key is whether it can be supported near 119086.64.
The meaning of the DOM(60) indicator is to show the end of the high point.
In other words, if it rises above HA-High ~ DOM(60), it means that there is a high possibility of a stepwise upward trend.
On the other hand, if it fails to rise above DOM(60), it is likely to turn into a downtrend.
The basic chart for chart analysis is the 1D chart.
Therefore, if possible, check the trend of the 1D chart first.
The DOM(60) indicator of the 1D chart is currently formed at the 111696.21 point.
And, the HA-High indicator was created at the 115854.56 point.
Therefore, since it cannot be said that the DOM(60) indicator of the 1D chart has been created yet, if the price is maintained near the HA-High indicator, it seems likely to rise until the DOM(60) indicator is created.
We need to look at whether the DOM(60) indicator will be created while moving sideways at the current price position or if the DOM(60) indicator will be created when the price rises.
If the price falls and falls below 111696.21, and the HA-High indicator is generated, the HA-High ~ DOM(60) section is formed, so whether there is support in that section is the key.
-
Since the DOM(60) indicator on the 1W chart was generated, if it fails to rise above the DOM(60) indicator, it is highly likely that the HA-High indicator will be newly generated as it eventually falls.
Therefore, you should also look at where the HA-High indicator on the 1W chart is generated when the price falls.
-
The next volatility period is around July 18 (July 17-19).
Therefore, you should look at which direction it deviates from the 115854.56-119086.64 section after this volatility period.
Since the K of the StochRSI indicator fell from the overbought section and changed to a state where K < D, it seems likely that the rise will be limited.
However, since the PVT-MACD oscillator indicator is above 0 and the OBV indicator is OBV > OBV EMA, it is expected that the support around 115845.56 will be important.
-
Thank you for reading to the end.
I hope you have a successful trade.
--------------------------------------------------
- Here is an explanation of the big picture.
(3-year bull market, 1-year bear market pattern)
I will explain the details again when the bear market starts.
------------------------------------------------------
Where Can Bitcoin Go? Part 8 –(Major Chart Update')First of all guys – I made the video! 🎥🔥 Watch the full breakdown before diving into the details below.
It explains everything visually, level by level. Don't miss it.
Now let’s get into the core of the analysis...
🚀📊 Where Can Bitcoin Go? Part 8 – The Final Test is Near! 🔥🔍
Welcome to Part 8 of “Where Can Bitcoin Go?” – the update of this long-running series. Since mid-2023, not much has changed in the structure. That’s the power of solid technical analysis – levels don’t lie.
🟨 The Setup
Bitcoin is now approaching a third test of a major structural resistance. If you’ve followed my 1-2-3 strategy, you know this is where decisions are made:
✅ Test 1: Rejection
✅ Test 2: Rejection
⏳ Test 3: Now pending… the TERMINAL and DECISIVE 'Breakout or Rejection', and this will change everything.
But here’s the deeper layer:
We’re not just testing one sequence. We now have two separate sets of 1-2 rejections —
🔹 One set from 2021 (the Red 1 and 2)
🔹 And a recent one in 2025 (the white 1 and 2)
This upcoming test is the third rejection attempt on both timeframes, making it a rare and extremely significant technical moment.
📐 Price is now near a critical ascending trendline around $115K–$116K, which has been the gatekeeper to parabolic moves in previous cycles.
🔄 Based on historical halving cycles:
548 days post-halving in 2016 → ATH 2017
565 days post-halving in 2020 → ATH 2021
Halving #4 was in April 2024 → 👀 Could this point to a new ATH by end of 2025?
📊 Probabilities
🔹 83% chance we see the third test before year-end
🔹 57% chance of breakout
🔻 43% chance of rejection
⚠️ And here’s the reality check:
If we see that breakout — the market unleashes itself. We’re talking major pumps, potential follow-through moves, and price discovery into untouched zones like $188K, $197K, and beyond.
But... if we get rejected, it won’t be pretty. We could retest major levels like $66K or worse, and lose momentum that took years to build.
And unfortunately — this isn’t like 18K, or 40K, or even the 79K retest.
Things are much more complicated now.
The sentiment, the structure, the risk profile — they’ve all evolved. We cannot afford to have the same blind bullishness we had in those earlier phases. This is a mature part of the cycle, and it demands discipline over emotion.
💬 What’s your take?
Will Bitcoin finally break through?
Is this just another fakeout in disguise?
Are you feeling this same tension in the market?
Let’s talk structure. Let’s talk price. Let’s talk reality.
One Love,
The FXPROFESSOR 💙
Disclosure: I am happy to be part of the Trade Nation's Influencer program and receive a monthly fee for using their TradingView charts in my analysis. Awesome broker, where the trader really comes first! 🌟🤝📈

BTC 4 HR TIME FRAME ANALYSIS 4H Technical Analysis – BTCUSDT.P (Bitcoin Perpetual on Bitget)
✅ 1. Trend Overview:
Current Market Phase: Strong uptrend.
Price has broken multiple H4 BOS (Break of Structure) levels with strong bullish momentum.
The last impulse candle shows a vertical breakout, often a sign of aggressive buyers or FOMO.
🔄 2. Key Structure Zones:
🔵 Demand Zones (Highlighted in Green):
Around 113,700–114,000 → fresh demand zone after last breakout.
Around 108,000–110,000 → mid-level zone from earlier accumulation.
Deeper zone at ~96,000–98,000 → higher timeframe demand (may hold if larger correction happens).
🔴 Supply Zones (No immediate supply shown, but...)
Watch for reaction zones around 118,000–120,000 as psychological resistance.
📍 3. Price Action & Structure:
The current move is parabolic, indicating momentum exhaustion may soon follow.
However, the last CHoCH and BOS signals are clearly bullish, and pullbacks are being aggressively bought.
Short-Term Expectation:
A correction or sideways consolidation may happen near 118,000–119,000.
Best scenario: price pulls back into the 113,700 zone, forming a bullish continuation setup.
🔍 4. Candlestick Patterns:
At the top, the last 2 candles are showing wicks, indicating possible early rejection or take-profit activity.
No confirmed reversal pattern yet (e.g., no bearish engulfing, pin bar, or evening star).
Wait for confirmation if considering a reversal trade.
📉 5. Risk Zones:
If price breaks below 113,700, then correction may deepen toward 110,000 or even 108,000.
Below 108,000 would invalidate the current short-term bullish structure and signal trend weakening.
📌 6. Key Levels to Watch:
Type Price Zone Notes
Resistance 118,500–120,000 Current high zone, psychological barrier
Demand Zone 1 113,700–114,000 Nearest fresh demand
Demand Zone 2 108,000–110,000 Mid support
HTF Demand ~96,000–98,000 Deep liquidity + structural demand
✅ Conclusion:
Market is in a strong bullish trend on the 4H chart.
Wait for a healthy pullback to demand zones before considering new longs.
Watch for bearish candlestick confirmation (like engulfing or M-structure) near highs for possible short-term reversals.
⚠️ Disclaimer:
This is not financial advice or a trading signal.
It's purely educational analysis.
Always trade based on your personal strategy and risk management. BITGET:BTCUSDT.P

BTC Short Bitcoin needs a little correction from here for a healthy pump , I am in short postion now

BTC/USDT Technical Analysis Market Overview
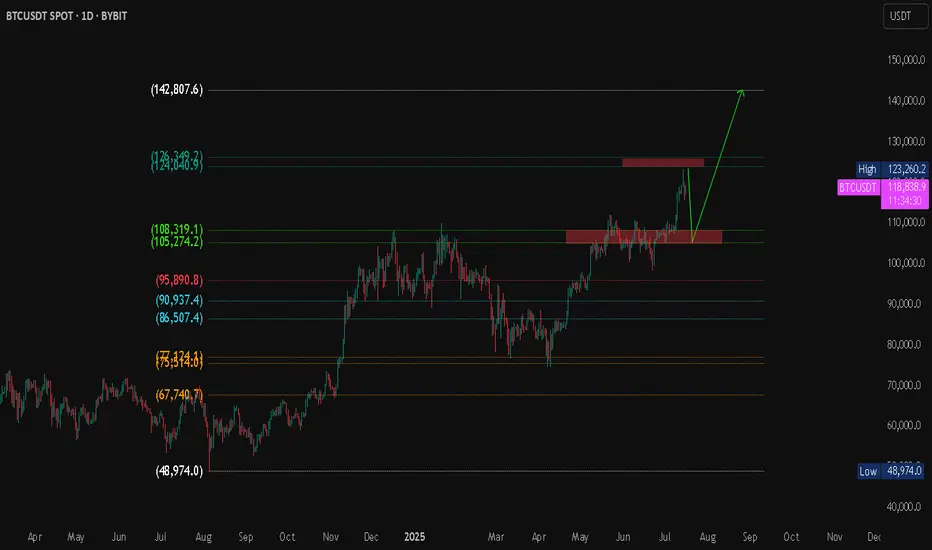
Bitcoin is currently trading at $118,788, with an intraday high of $119,311. The market has recently tested a major resistance zone and is showing signs of a potential pullback toward a key demand zone before a possible continuation to higher levels.
Projected Scenario (Bullish Bias)
Expected pullback to the support zone around $105K – $108K.
If price holds and shows a bullish reversal, a breakout above $124K is expected.
Primary upside target: $142,807 (Fibonacci projection / potential new high).
Bitcoin Rejected at Resistance – Sideways Trap Now Likely⚠️🚫 Bitcoin Rejected at $111,592 – Smart Money Took Profits, Not FOMO 💰📉
We called it yesterday. I urgently posted about the $111,592 level — one of the most important resistance zones in this structure. And right on schedule… Bitcoin tagged it and got rejected.
📍 This isn’t just luck. It’s structure + timing + discipline.
🔄 While many were eyeing a breakout, we were preparing for the expected rejection — and we took profits after long entries from just under $100K (as shown). This wasn’t the time to FOMO. This was the time to cash in.
🔎 Key Points from Today’s Market View:
We’re still inside the ascending channel, but testing the upper end
Multiple divergences on the 2-day chart are still active (8 counted). Many more across big timeframes.
The third macro resistance test is inbound — watch the 'where can Bitcoin go post below'
Current outlook favors a sideways chop — the classic liquidation zone where longs and shorts alike get punished
We might still get the breakout to $114,900 — but if that happens, it’ll come after more pain, not from clean momentum.
🧠 Bigger Picture:
If you missed the major chart update, watch:
👉 Where Can Bitcoin Go? Part 8
And if you want today’s broader outlook (including ETH, BTC.D, NASDAQ), catch the July 10th video:
👉 July 10th Market Outlook – Uncharted Waters
🗣️ Final Word:
What we’re seeing is not a breakout. Not yet.
This is a trap zone.
Discipline > Emotion.
Structure > Hope.
Profits > FOMO.
Welcome to day trading.
💬 Peanut butter Street Talk:
Presidents are out here launching meme coins. The insiders already made their billions — and they’re calling it “peanuts.”
But we don’t want to be their peanut butter.
That’s what happens when we become the exit liquidity.
They dump while we FOMO. They wait while we panic.
So don’t feed the trap. Keep your edge sharp, your charts tighter, and your emotions in check.
I prefer to buy over 115k, over resistance or lower at support.
Not today,
The FXPROFESSOR 💙
Disclosure: I am happy to be part of the Trade Nation's Influencer program and receive a monthly fee for using their TradingView charts in my analysis. Awesome broker, where the trader really comes first! 🌟🤝📈

DeGRAM | BTCUSD got out from the triangle📊 Technical Analysis
● Price reclaimed the purple 2-month trend cap and has “fixed” above the 107 k former supply, turning it into support; this validates the grey ascending triangle whose base lies on the channel mid-line.
● Triangle height and prior swing grid point to 112 k first, then the 114.9 k May high just beneath the channel ceiling. Invalid if candles sink back below 107 k.
💡 Fundamental Analysis
● Spot-ETF desks added >9 800 BTC since Friday while on-chain miner reserves stabilised, suggesting dwindling sell pressure just as U.S. CPI relief is lifting real-yield headwinds.
✨ Summary
Long 107–108 k; breakout >112 k opens 114.9 k. Bull view void on 4 h close <107 k.
-------------------
Share your opinion in the comments and support the idea with a like. Thanks for your support!

Bitcoin Breaks Out – Ultimate FOMO Unleashed Above $114,921🟢🚀 BREAKOUT POST
🚀🔥 Bitcoin Breaks Out – Ultimate FOMO Unleashed Above $114,921 🚀🔥
It’s happening. The breakout is real.
Bitcoin has just broken through the “HUGE-est Level EVER” — the infamous $114,921, marking the third macro test and final resistance in this structure.
This is not a small move. This is the unleashing of a new wave — the Ultimate FOMO zone is now LIVE.
📈 What Just Happened:
Third test confirmed ✅
Breakout through massive historical resistance
We are now in uncharted territory
🌪️ This Breakout Is Different:
Previous rejections (1 and 2) led to multi-week corrections
This time, price exploded through the level with force
Watch the parabola — we could be headed to the next ATH zone by end of 2025
🧠 Context:
The 2D divergences? Ignored. Structure wins.
This breakout invalidates the idea of sideways chop for now
It confirms strong bullish momentum across timeframes
⚠️ Caution Still Needed:
This move might trigger euphoric leverage — don’t be late, don’t chase blindly. Watch for a retest of the breakout zone for high-RR trades.
🧭 What To Watch Next:
Retest of 114.9K (support flip?)
New targets near 124K–128K
Long-term ATH projection still in play for late 2025
Full context in these breakdowns:
👉 Where Can Bitcoin Go? Part 8
👉 July 10th Market Outlook – Uncharted Waters
History is being written today.
One Love,
The FXPROFESSOR 💙
Disclosure: I am happy to be part of the Trade Nation's Influencer program and receive a monthly fee for using their TradingView charts in my analysis. Awesome broker, where the trader really comes first! 🌟🤝📈

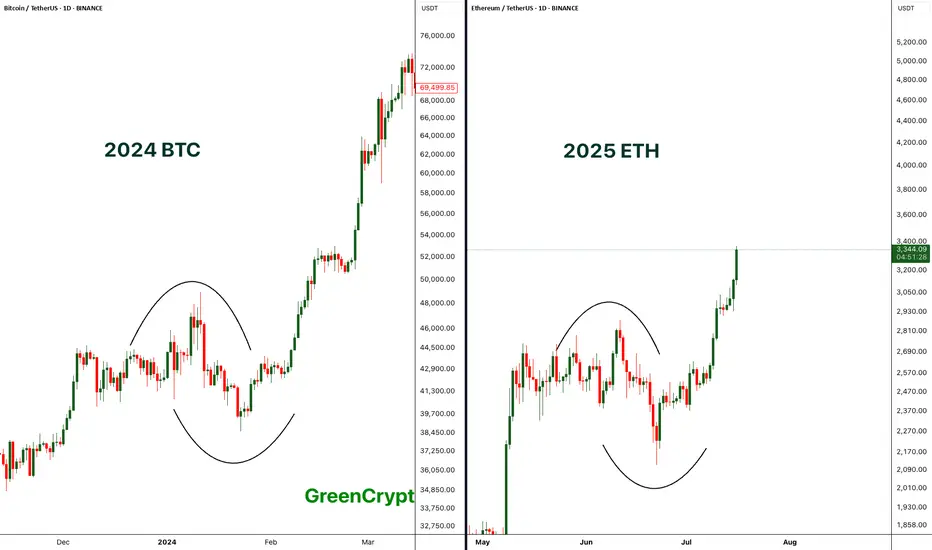
Comparing BTC 2024 with ETH 2025 - Perfect Match- If compare the chart pattern of BTC from 2024 with the current 2025 ETH pattern, wee see exactly similar chart patterns being formed here.
- Price started consolidating then it had fake breakout towards both the sides and finally the real breakout.
- BTC breakout push the price towards the new all time high above 69K, if we ETH follows similar trend then we can expect new all time high on ETH.
Let's see how it plays out.
Stay tuned for more updates.
Cheers
GreenCrypto
Bitcoin (BTC): New ATH Incoming | Aiming For $120KBitcoin is at ATH, where there is a high chance for a breakout and our next target of $120K to be reached from here.
People have euphoria for the new ATH; the money inflow is huge where whales are and have been stacking the BTC little by little.
Now with the new ATH, we have to remember there is no accurate way to predict potential resistance, so we have to base our bets on zones like $120K and $140K (round numbers).
Those 2 zones are our current targets!
Swallow Academy

TradeCityPro | Bitcoin Daily Analysis #121👋 Welcome to TradeCity Pro!
Let’s dive into the Bitcoin analysis and key crypto indicators. As usual, I’ll walk you through the triggers for the New York futures session.
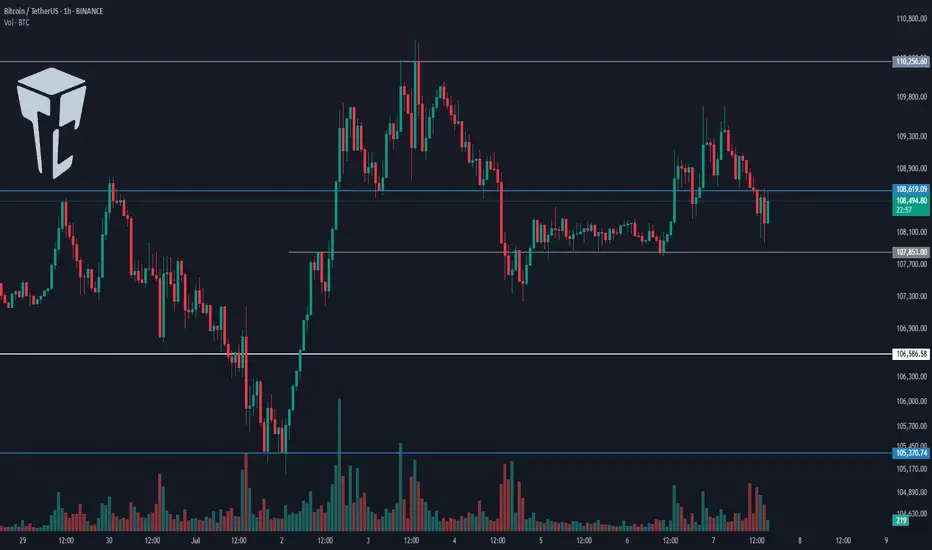
⏳ 1-Hour Timeframe
As you can see on the 1-hour timeframe, the upward move Bitcoin made yesterday turned out to be a fakeout, and the price is now heading downward.
⚡️ I’m not moving the 108619 line for now. I’ll wait to see if the price reacts to it again in the future, then decide whether to adjust it.
✅ Currently, if the 107853 level breaks, we can enter a short position. We already have volume confirmation, and if this increase in volume continues, we could see a sharp downward move.
📈 Next support levels for Bitcoin in this timeframe are 106586 and 105370, which can be used as targets.
✨ If Bitcoin starts moving upward again, the long trigger remains the 110256 level. A breakout here would mark the beginning of a true uptrend.
👑 BTC.D Analysis
Bitcoin dominance continued its downward move today, dropping close to the 65.04 level.
🔼 We’re currently seeing a reaction at this level, suggesting some support. A break below 65.04 could trigger a strong downtrend.
📅 Total2 Analysis
This index is still in an uptrend but showing significant weakness. It’s currently sitting on key support at 1.15.
⚡️ A break below this level could give us a short position. Additional support levels are 1.14 and 1.13. For a long position, the only trigger we have right now is 1.17.
📅 USDT.D Analysis
Looking at Tether dominance, it’s still hovering around the 4.78 level. After a brief fakeout below, it has returned above that zone.
📊 If this level breaks again, Tether dominance could move down toward 4.72.
❌ Disclaimer ❌
Trading futures is highly risky and dangerous. If you're not an expert, these triggers may not be suitable for you. You should first learn risk and capital management. You can also use the educational content from this channel.
Finally, these triggers reflect my personal opinions on price action, and the market may move completely against this analysis. So, do your own research before opening any position.
BITCOIN ABOUT TO CRASH HARD!!!!? (Be careful with your longs)I am sharing with you in this video the next CRYPTOCAP:BTC important resistances and support levels.
Together with the confirmations, it is said that if triggered, Bitcoin will start crashing hard, so be careful if you have overleveraged long positions opened right now!
Remember to always trade only with professional trading strategies and tactics, and make sure that your money management is tight!

Candlestick Patterns - How to read them like a ProOverview
Candlestick charts serve as a cornerstone in technical analysis, presenting price activity in a visually digestible format. By examining how prices move over a given timeframe, traders gain key insights into potential market direction, sentiment shifts, and trend strength.
Mastering candlestick interpretation is essential for identifying bullish or bearish sentiment, as well as for spotting possible trend reversals or continuations. Still, candlesticks alone don’t paint the full picture—using them without broader context increases the risk of false signals.
---
What You'll Learn
What are candlestick charts?
Common bearish candlestick patterns
Common bullish candlestick patterns
How to apply candlestick analysis in trading
---
What is a Candlestick Chart?
A candlestick provides a snapshot of an asset’s price behavior during a specific time interval, whether it's one minute, one hour, or one day. This format allows traders to quickly assess how the price has moved within that period.
Each candle reveals four price points:
* Open – the price at the beginning of the interval
* Close – the price at the end of the interval
* High – the highest price reached
* Low – the lowest price during that time
Anatomy of a Candlestick:
* Body: The thick section between the open and close. A green (or white) body means the close was higher than the open (bullish), while red (or black) means the opposite (bearish).
* Wicks (or Shadows): Thin lines extending from the body to indicate the high and low.
* Upper wick: Marks the highest traded price
* Lower wick: Marks the lowest traded price
---
Bearish Candlestick Patterns
Understanding bearish candlestick patterns helps traders identify moments when buying momentum might be running out—setting the stage for a potential downward shift.
Evening Star
A three-candle formation that signals a shift from buying pressure to selling dominance. It starts with a strong bullish candle, followed by a small-bodied candle of indecision, and concludes with a large bearish candle that cuts deep into the first. This pattern often appears at the end of an uptrend.
Bearish Engulfing
This setup includes a small bullish candle followed by a large bearish candle that completely swallows the previous one. It indicates that sellers have seized control, potentially marking the beginning of a downward trend.
Shooting Star
With a small real body near the low and a long upper wick, this pattern reflects strong early buying that is ultimately rejected by the close—suggesting fading bullish momentum.
Gravestone Doji
This candle opens, closes, and hits its low all around the same price, leaving a long upper wick. It suggests that bulls pushed higher during the session but were overpowered by bears by the close.
Three Crows
Three consecutive bearish candles, all approximately the same size. These indicate that a sell off is coming soon.
---
Bullish Candlestick Patterns
Bullish patterns can alert traders to possible reversals after a downtrend or strengthen conviction during an uptrend.
Morning Star
This three-candle formation marks a potential turning point from bearish to bullish. It begins with a strong bearish candle, followed by a smaller candle showing indecision, and ends with a large bullish candle breaking upward—signaling buying strength is returning.
Bullish Engulfing
This two-candle pattern begins with a bearish candle, then a larger bullish candle that completely envelops the previous body. It reflects a sharp transition in sentiment, suggesting renewed buying pressure.
Dragonfly Doji
A single candle where the open, close, and high are all very close, with a long lower wick. It shows sellers pushed prices lower but buyers stepped in and brought them back up—an early sign of possible reversal.
Hammer
A classic bullish reversal signal that features a small real body near the top and a long lower shadow. It indicates a battle where sellers initially dominated, but buyers managed to close near the open price.
Three soldiers
Three consecutive bullish candles, all approximately the same size. These indicate that a big buy is coming soon.
---
Trading with Candlestick Patterns
Candlestick patterns become more meaningful when they align with major chart areas—such as previous support or resistance, trendlines, or retracement zones. A bullish signal at a support level can hint that the downward pressure is fading, while a bearish pattern at resistance may warn of an upcoming decline.
To increase the reliability of your trades, combine candlestick patterns with other forms of technical analysis:
* Support & Resistance Zones: These are price levels where the market has historically reacted. Candlestick patterns forming near these zones have stronger potential implications.
* Fibonacci Levels : These help identify likely retracement areas. When a candlestick pattern forms near a key Fibonacci level like 61.8%, it adds strength to a potential reversal setup.
* Liquidity Areas: Clusters of orders (buy or sell) tend to create strong reactions. When patterns appear in these zones, they often precede more decisive moves.
* Technical Indicators : RSI, MACD, Moving Averages, and Stochastic RSI can provide confirmation. For instance, a bullish reversal pattern that appears when RSI is oversold strengthens the signal.
💡 Tip: Don’t rush into trades based on one candlestick alone. Always wait for the next candle or price confirmation (e.g., a break of a previous high/low) to validate your signal.
---
Thanks for Reading!
✨ If you found this helpful, show some love by liking or commenting!
🔔 Don’t forget to follow for more technical breakdowns and trading insights coming soon!

BTC Short Call!hort Call on BTC (Short-Term)
Entry: Sell 1 BTC Call @ $120,000 strike, August expiry (~4 weeks)
Premium Collected: ~$1.5K–$2K (~0.013 BTC)
Thesis: BTC is facing resistance in the $118.9K–$120K zone. While overall trend is bullish, short-term momentum may stall at new highs. A short call captures time decay, profiting if BTC consolidates or retraces.
Risks: Unlimited if BTC rallies strongly above $120K. Consider hedging with a long call at $125K strike.
Target: Keep the entire premium if BTC <= $120K at expiry.

Bitcoin ATHBINANCE:BTCUSDT This is amazing for crypto community because this level-up all of lover crypto currencies.
Next target: 120.000K
Best for pollback levels: 111.000K & 105.500K
👓We are this time keep calms emotional in buy or sell.

BITCOIN Bitcoin (BTC) has reached a new all-time high, trading around $111,000 to $112,000 per coin.
Key Highlights:
Bitcoin hit an intraday record high surpassing its previous peak of about $111,970 set in May 2025.
market capitalization exceeding $2 trillion.
The rally is attributed to a combination of factors including:
A weakening US dollar, which reduces opportunity cost for holding Bitcoin.
Increased demand from institutional investors, with nearly $1 billion net inflows into Bitcoin and Ethereum ETFs in early July.
Positive market sentiment following statements on monetary policy and expectations of potential Fed rate cuts.
Recent significant moves include the transfer of 20,000 BTC from wallets inactive for 14 years, highlighting long-term holder activity.
Price Data Snapshot:
Current Price: Around $111,000
Day’s High: Approximately $112,152
Market Cap: About $2.02 trillion
Volume (24h): Over $57 billion
Year High: $112,021 (intraday)
Summary:
Bitcoin continues its strong upward momentum in mid-2025, breaking new records amid supportive macroeconomic conditions such as a softer dollar and growing institutional adoption. The cryptocurrency remains volatile but shows robust demand as a digital asset and inflation hedge.
#BTC
