Analysis of the Latest Bitcoin Market。On July 14, Bitcoin's price surged sharply, with the highest level reaching $123,100. This breakthrough ended its eight-month-long consolidation phase within the $90,000 - $110,000 range.
The U.S. House of Representatives designated the week of July 14 as "Crypto Week" and plans to deliberate on a number of key bills. Among them, the Guiding and Establishing America's Stablecoin National Innovation Act aims to formulate federal regulations for stablecoins and is regarded as a "landmark legislation" in the cryptocurrency sector. The market expects the cryptocurrency industry to usher in policy dividends.
Market analysts are relatively optimistic about Bitcoin's prospects. The $125,000 level is seen as the next key psychological threshold, and a breakthrough above it would open up greater upside potential. Standard Chartered Bank predicts that Bitcoin will challenge $200,000 by the end of the year. Although the Relative Strength Index (RSI) is at a high level, there is no obvious overbought signal. The moving average system is clearly aligned, and the support level has moved up to $112,000. The market consensus holds that "any pullback represents a buying opportunity."
you are currently struggling with losses,or are unsure which of the numerous trading strategies to follow,You have the option to join our VIP program. I will assist you and provide you with accurate trading signals, enabling you to navigate the financial markets with greater confidence and potentially achieve optimal trading results.
BTCDOWNUSDT trade ideas
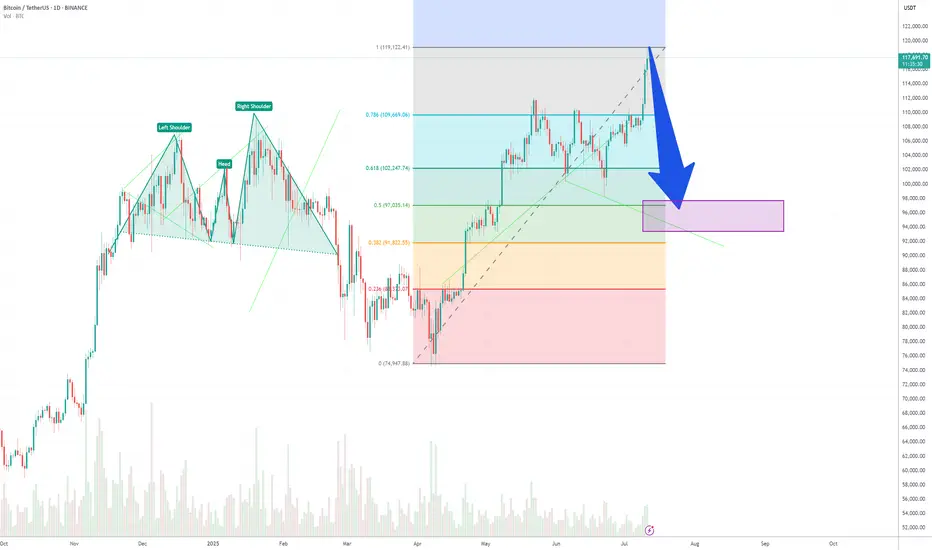
Bitcoin short from 121kLooking for shorts at these leveks.
Target aroind cme gap.
Also npoc level is down at that region.
Patiently waiting.

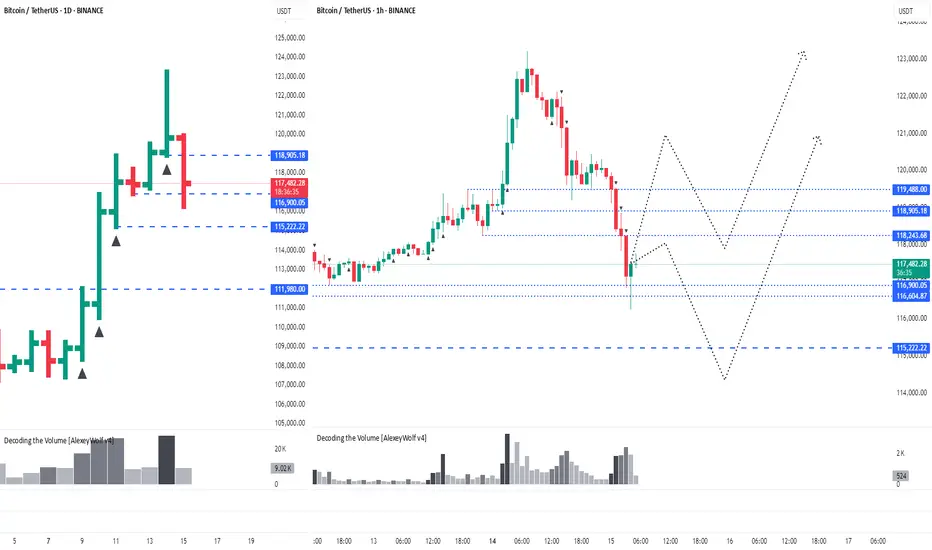
BTCUSDT. Current scenario range Current scenario range — can shift depending on how the market reacts next.
This analysis is based on the Initiative Analysis concept (IA).
Wishing you profitable trades!
BTC Era, continue to create new ATH💎 BTC WEEKLY PLAN UPDATE (14 July )
NOTABLE NEWS ABOUT BTC
Bitcoin (BTC) broke above a key milestone on Friday, setting a new all-time high of $119,999 with no signs of slowing down. The technical outlook supports further gains as momentum indicators remain strong and price action is solidly in price discovery mode, with the next potential target at $135.000
Bitcoin’s Next Stop: $135.000
Bitcoin entered price discovery on July 9, and since then, the king of cryptocurrencies has surged toward the $120,000 target—a key psychological level for traders. Early Monday during the Asian session, BTC climbed to a peak of $119,999, marking a new all-time high and the closest the asset has come to this milestone.
TECHNICAL ANALYSIS PERSPECTIVE
Two key momentum indicators on the daily timeframe signal underlying bullish momentum in Bitcoin, suggesting a potential for further upside. The Relative Strength Index (RSI) reads 76, and the Moving Average Convergence Divergence (MACD) is flashing green histogram bars above the neutral line.
However, if BTC undergoes a correction, it may extend its pullback to find support near the lower boundary of the Fair Value Gap (FVG) around $115,222.
Derivatives market data shows that $76 million was liquidated over the past 24 hours as BTC surged toward its new high. The long/short ratio, which is considered an indicator of bullish or bearish trader sentiment, is above 1—indicating that more derivative traders are optimistic about Bitcoin and are expecting further gains in the king of cryptocurrencies.
Stay tuned to the channel for updates.
BTC Roadmap Still Intact Bullish Momentum Building Toward 120KBitcoin Price action continues to validate the bullish roadmap shared in our last BTC post. The market respected the Immediate Buy Back Zone, springing from a demand backed structure into a fresh impulsive leg.
Notably, price has carved a clean 5-wave structure supported by recurring bullish pennants and continuation patterns each breakout driving momentum higher. Our target at 120,151 remains firmly intact, with price action showing healthy structure and controlled pullbacks.
The current setup remains valid as long as price holds above 106,655 and especially 100,941, which now act as structural pivot zones. Any deeper correction into the Demand Area would only serve as a re-accumulation window before the next leg.
Let’s see how price behaves into June. Momentum is aligning with structure.
Share your thoughts, like the post, and drop your setup confirmations on the comment section.

Bitcon Crash Time!!Currently, the price of Bitcoin is at its peak, and it's the best time to exit the market because a major drop is imminent...

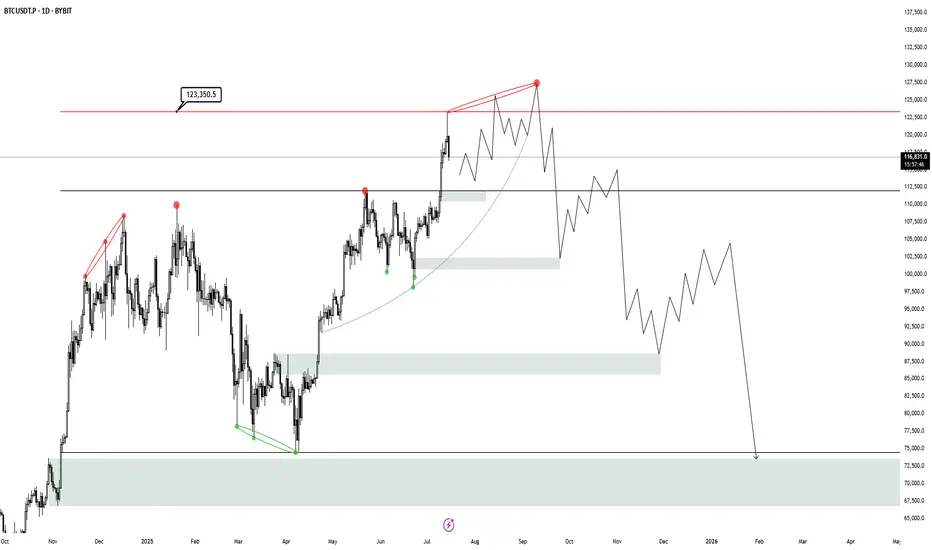
BTC HTF Distribution V3This is my new outlook for BTC if this 250 day old range is intended to be a HTF Distribution Model 1, which has neither been confirmed nor invalidated. A weekly close above 123.350$ will invalidate this model and likely lead to higher prices. Yesterday we had a perfect rejection from the deviation limit, which now probably creates a new range, that then will either reaccumulate or distribute.
BTC - Falling Correction = Continuation?BTC has been playing by the rules lately!
Every time Bitcoin forms a falling correction, it turns out to be a bullish continuation pattern — and history might be repeating itself 👀
As shown on the chart:
Previous falling channels (flag/wedge structures) have consistently led to strong bullish impulses.
The current correction also appears to be a falling channel, hinting at another potential bullish leg soon.
As long as the structure holds and no major support is broken, the next target could be a new all-time high.
Let’s see if BTC continues to respect this textbook behavior.
📌 Remember: Falling corrections in an uptrend = healthy continuation!
📚 Always follow your trading plan regarding entry, risk management, and trade management.
Good luck!
All Strategies Are Good; If Managed Properly!
~Rich

Bitcoin & new rallyBitcoin surpassed its previous all-time high of $112,000 and is now approaching $124,700, the third resistance level for July's pivot.

"Bitcoin, after breaking the resistance at $110,000"Bitcoin, after breaking the resistance at $110,000, could target $115,000 and $120,000 in the next steps."

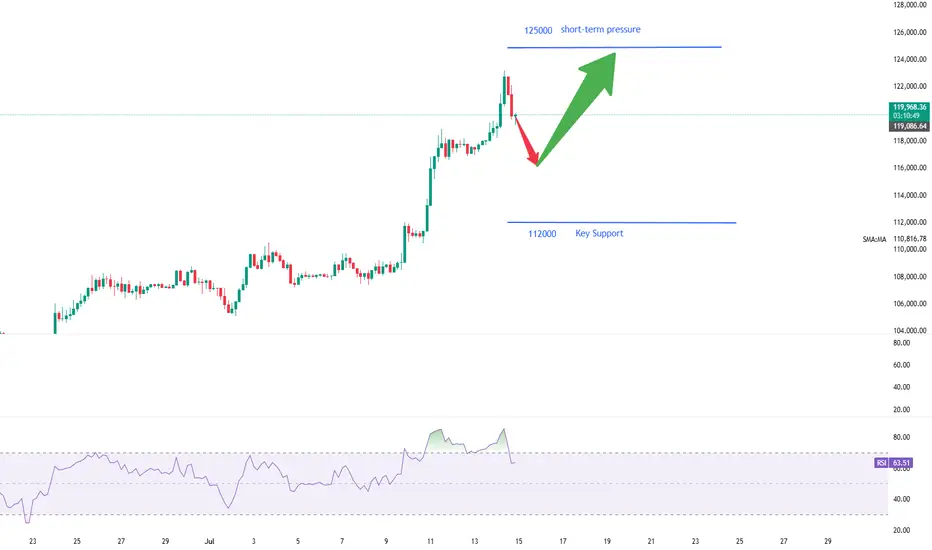
Analysis no 74 1hWelcome to king btc 3 Bitcoin is expected to decline from the range of 119,000 to 120,000 slowly to 113,500 and then rise to 125,000 in the cycle. The larger range is expected to be in the range of 115,500 to 125,000 which could be an opportunity for altcoins to rise. This is just a possibility.

BITCOIN PULLBACK 110.000🔹 The uptrend remains intact
After setting a new high, the price may enter a mild correction toward the $110K zone.
Key support levels in this uptrend are:
✅ $115K
✅ $110K
✅ $105K
As long as the price holds above $105K, any pullback is considered healthy and the uptrend is likely to continue.
📊 A shallow correction is part of a healthy market structure.

Bitcoin (BTC): Current Neckline Zone is Crucial | Bounce Coming?After a recent push to a new ATH area, the price has cooled down, which led the price back to the local neckline zone, which is our next important zone.
This correction cooled down the Bollinger Bands Channel and RSI, which would mean we are just one MSB (on smaller timeframes) away from another rally towards the upper zones.
Now if for any reason we fall more, then this might turn into a nasty movement, as our target would be then around $110K, where we would be looking for another buy entry (if we fail to get that MSB we are currently looking for).
Swallow Academy

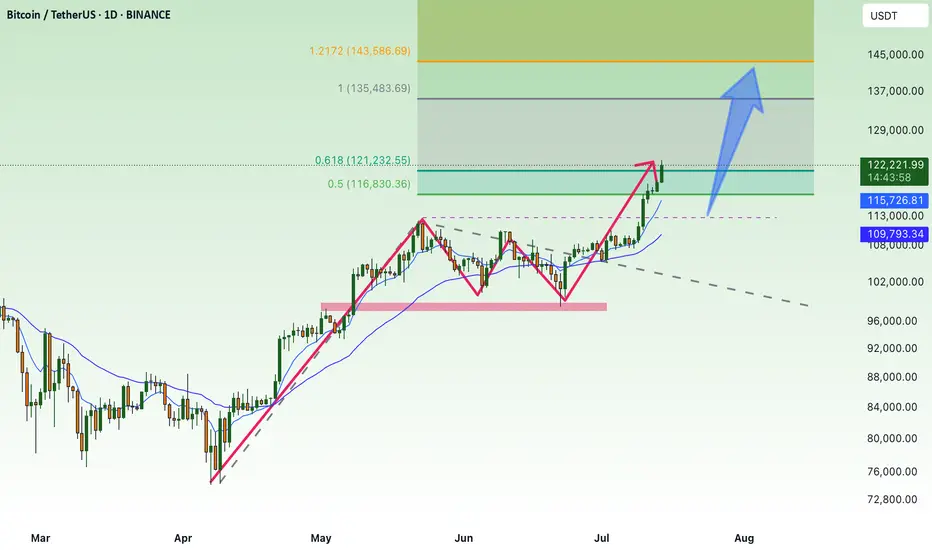
BITCOIN =140-150kThe X-wave has formed in the form of a neutral triangle pattern, and eventually Bitcoin could once again touch $106,000 and move towards $140,000-150,000 with the completion of wave-e.
Good luck
NEoWave Chart

Bitcoin (BTC): Markets on Fire | Almost at $120K (140K Next?)Markets are going crazy, people are in fear of missing out (FOMO) and we are just chilling; the price moved exactly like we needed it to move.
We are very close to our target of $120K,, where we might see some kind of strong rejection or even stronger bullish volume (we will have to reach this areaa before deciding our next gameplay).
What we see or aim at is $140K to be a local to for this bull run. After that we are expecting more of sideways movement and then a bigger correction to happen.
Swallow Academy

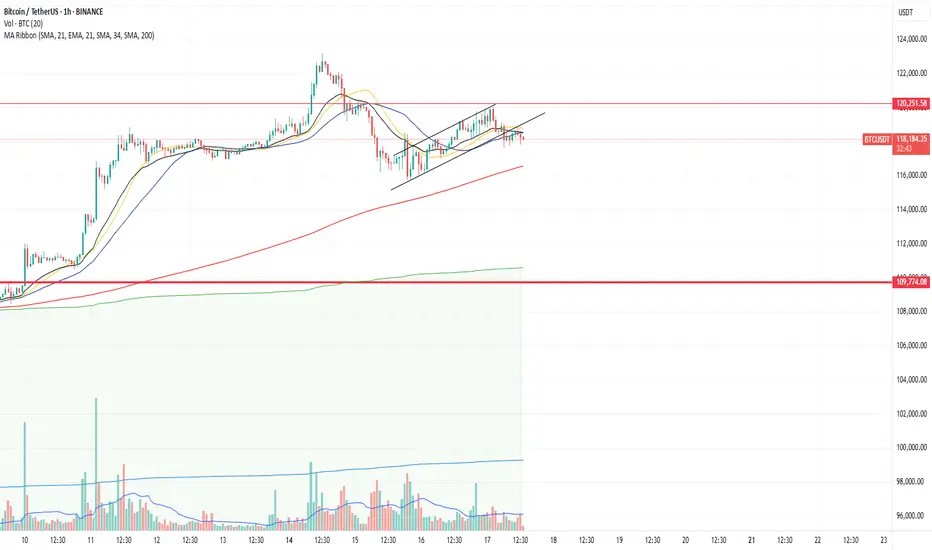
We are going downBitcoin clearly broken below this bear flag and retested lower line. Invalidation is close above 120k.
BTC SHORT Price found resistance after exhaustive uptrend to 120K area.
Trend reversal taking place. Looks like more downside for now.

$BTC FLY TOWARDS 141K$ NEXT?CRYPTOCAP:BTC Bull Flag Target Hit – Eyes on 129K & 134.5K Next! 🔥
Bitcoin has overachieved its bull flag target and is now setting up a textbook Break & Retest of the previous All Time High (~$123K).
📌 Key Levels to Watch:
🔄 Retest Zone: $111K–$113K (previous ATH)
🎯 Next Targets:
$129K (0.12 Fib Extension)
$134.5K (Golden Extension Zone)
📉 Invalidation: Below $104K
Volume remains solid, and structure is bullish — expect a healthy dip & bounce before continuation.
This retest could be the final springboard toward $141K.

Bitcoin’s Wild Ride to New ATHs: What’s Next for Traders?Hello, TradingView warriors! 👋
Have you caught Bitcoin (BTC) smashing through a new all-time high (ATH) this Monday? 🎉 If you blinked, you might’ve missed it! But don’t worry, the crypto king isn’t done with its rollercoaster ride just yet. After soaring to new heights, BTC has pulled back for a retracement—not a full-on reversal, so hold your horses! 🐎 Whales are playing their usual games, setting traps for unsuspecting traders. Don’t fall prey to their tricks! 🦈 Let’s break down the key levels to watch and stay one step ahead. 💡
🔍 Key Levels to Watch on the Chart
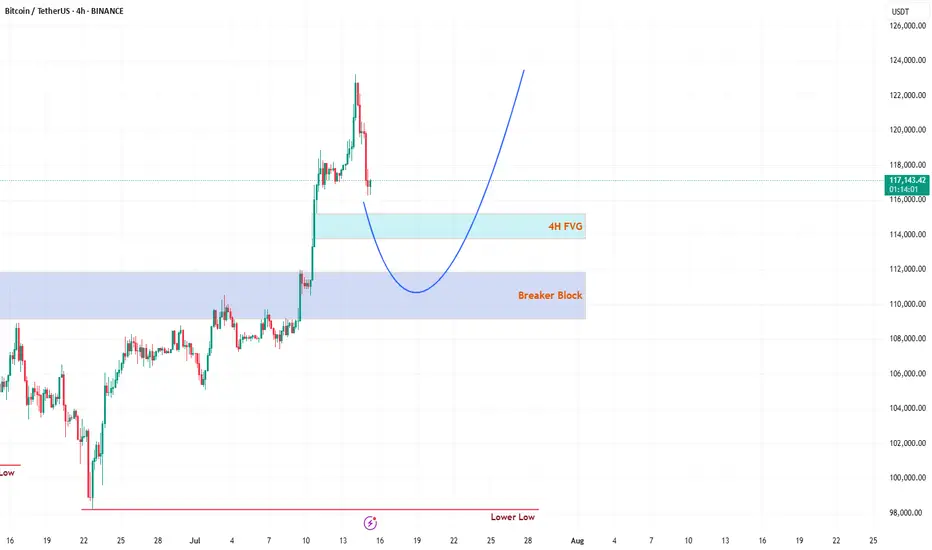
1️⃣ 4H Fair Value Gap (FVG)
This 4H FVG is a thing of beauty—my personal favorite! 😍 But let’s be real, Bitcoin doesn’t care about aesthetics. This FVG is likely to act as the first resistance level. Here’s the plan:
If respected, expect BTC to use this level as a springboard to catapult back toward the ATH. 🚀
If broken, BTC might slide toward the stronger resistance below. Keep your eyes peeled for how price reacts here! 👀
2️⃣ Daily Breaker Block (PD Array)
This is the big one—a rock-solid resistance zone on the daily timeframe. I’m leaning toward BTC dipping into this Breaker Block to clear out liquidity before making its next big move to retest the ATH. 🏦 This level is a magnet for price action, so don’t sleep on it! 😴
🛠️ Trading Strategy: Stay Sharp!
Patience is your best friend right now, traders. 🙏 Don’t rush into trades without confirmation. Watch how BTC interacts with these two levels:
4H FVG: Look for rejection or a breakout to gauge short-term direction.
Daily Breaker Block: If price dips here, it’s likely hunting liquidity before the next leg up.
Wait for clear price action before jumping in—let the market show its hand! 🃏 Stay disciplined, avoid the whale traps, and let’s ride this BTC wave together. 🌊
📚 Want More? Follow Me!
If you’re hungry for more technical analysis insights and market updates, hit that follow button! 📈 I share tips, tricks, and breakdowns to help you navigate the markets like a pro. Let’s level up your trading game together! 💪
What’s your take on BTC’s next move? Drop your thoughts below, and let’s discuss! 💬 Happy trading, and may the profits be with you! 📈

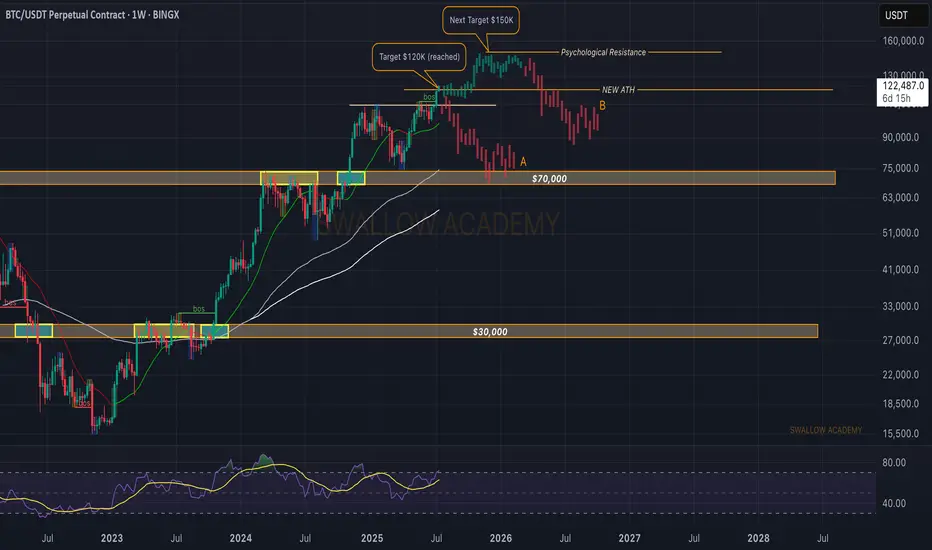
Bitcoin (BTC): Our Target Got Reached, Not Time To Just Watch!Buyers keep on pushing. As a new week starts, we are seeing a strong buy-side dominance and a new ATH to be formed, which broke our major target area of $120K.
Now to give a quick answer, our target is sitting at $140-150K, which we think will be the local top for this bull cycle, and as we recently reached major psychological resistance, we might see some sideways movement from here on, so there are a few things we are going to look for in order to get a potential trade from here.
1) Look for proper BOS (which should give us a good entry for long position)
2) if we see sideways channel, wait out for it to properly form on 30M timeframe, then try to trade inside the channel
3) If we see any kind of MSB (market structure break), we are going to look for a short position, as we might have a quick liquidity hunt there.
Swallow Academy
from 118k $, I expect a correction to the area of 100k$Somewhere from the current levels of 118k $, I expect a correction to the area of 100k$
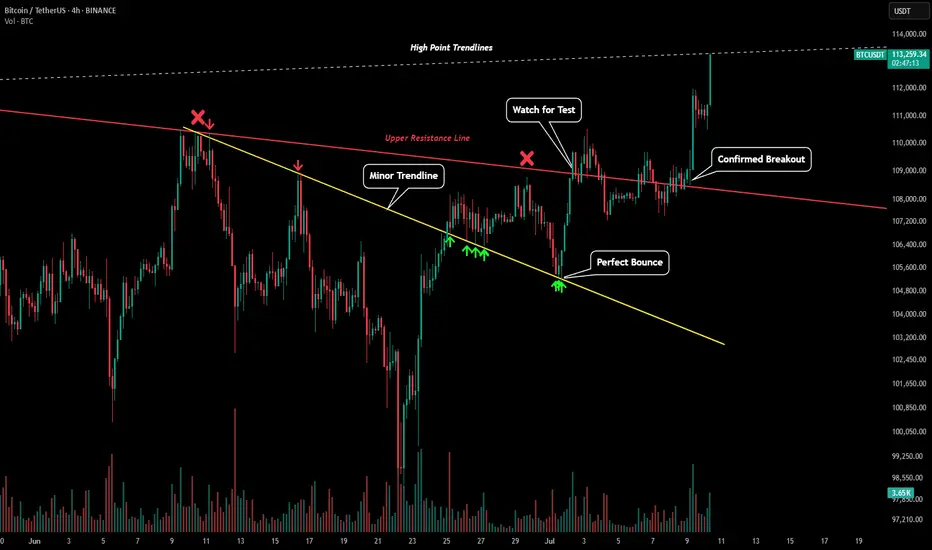
BTC - ATH After Perfect PredictionPlease refer to our previous post:
After a picture perfect test of our lower trendline of support price rallied back to our red trendline.
Price chopped back and forth around this trendline for a few days before finally confirming the breakout. Now BTC has hit a new all time high and is currently at our white upper high point trendline. Looking for confirmation closes above to continue the rally.