TradeCityPro | Bitcoin Daily Analysis #122👋 Welcome to TradeCity Pro!
Let’s dive into the latest analysis of Bitcoin and major crypto indicators. As usual, this update will focus on potential triggers for the New York futures session.
⌛️ 1-Hour Timeframe
On the 1-hour chart, Bitcoin is once again ranging between the 107,853 and 108,619 levels.
✔️ Last night, Bitcoin briefly faked out below the bottom of this range, so we now need to wait and see how the price reacts upon revisiting this area.
💫 I believe it’s best to hold off on entering a short position until we identify the precise location of the support line. As price retests this area, we can pinpoint the true support level.
✨ Once that level is confirmed, and if it breaks, a short position could be considered. The next support zones would be at 106,586 and 105,370.
📊 Make sure to watch the volume closely for this trade, and I strongly recommend waiting for a volume confirmation before entering.
📈 As for a long position, if 108,619 breaks to the upside, we could consider going long. The buying volume in the current upward leg is increasing, and if this trend continues, a breakout above 108,619 would make a long position reasonable.
👑 BTC.D Analysis
Moving on to Bitcoin dominance — it has once again reached its trendline and is currently being rejected from it. If this rejection continues, BTC.D could decline toward 65.04.
🔍 However, if the trendline breaks, the 65.31 level will be the bullish confirmation trigger.
📅 Total2 Analysis
Now on to the Total2 index (altcoin market cap excluding BTC), it has bounced from the 1.14 support and is moving toward 1.16.
🔑 A breakout above 1.16 would serve as a bullish confirmation for long positions, with 1.17 acting as the main breakout trigger.
📅 USDT.D Analysis
USDT dominance is also moving downward and has reached the 4.78 support zone.
💥 A breakdown below this level would confirm a bearish continuation toward the 4.72 level..
❌ Disclaimer ❌
Trading futures is highly risky and dangerous. If you're not an expert, these triggers may not be suitable for you. You should first learn risk and capital management. You can also use the educational content from this channel.
Finally, these triggers reflect my personal opinions on price action, and the market may move completely against this analysis. So, do your own research before opening any position.
BTCDOWNUSDT trade ideas

Bitcoin's Consolidation Almost Over —200-220 DaysBitcoin's consolidation period before a bullish breakout tends to last some 200-220 days on average. We have four instances of this pattern since the 2022 bear market counting 2025. Let's look at those. This proves that Bitcoin is set to grow in a matter of days. Continue reading below and make sure to boost. When you reach the end of the article leave a comment with your opinion about this issue. Do you agree? Do you disagree? Can you see what I mean?
» Back in 2022 Bitcoin consolidated for 203 days before a bullish breakout.
» Back in 2023 Bitcoin consolidated for 203 days before a bullish breakout.
» Back in 2024, last year, Bitcoin consolidated for 217 days before a bullish breakout.
It really depends on where you start counting for the total days but it all adds up to 200-220 days. With 220 being the maximum.
» Currently, in 2025, Bitcoin has been consolidating for 210 days. Looking at previous patterns, this means that only a few days are left before Bitcoin produces a bullish continuation.
We also saw that once Bitcoin breaks out of a this long-term consolidation range/period/phase, it never moves back to the lows of the consolidation range. That is, Bitcoin will never trade below 80K nor 90K once it resumes growing.
I am estimating that the next jump can start as early as next week. The entire move can take months to develop. After a peak is reached, Bitcoin will then start a new consolidation phase with a bearish bias first. This bearish bias produces a low after several months yet a strong higher low compared to the previous consolidation period which is current prices. After this low, more consolidation and then a new bullish jump.
If we take into consideration a bear market, then the dynamics can be different. Bear markets only happen once every four years. Seeing how different market conditions are now, the next bear market will be interesting because it won't be anything like the bear markets of the past. Bitcoin will remain much stronger but that is an analysis for another time.
Summary
Bitcoin is going up. It is very close now. When Bitcoin breaks up and hits a new all-time high, just to continue growing, the altcoins market will explode. You've been warned.
Now you can leave your comment.
Share your opinion on the comments section below. I know you have something to say. You've been trading Cryptocurrencies for years, buying and selling, making profits so... Are you ready for the 2025 bull market?
Thank you for reading.
Namaste.

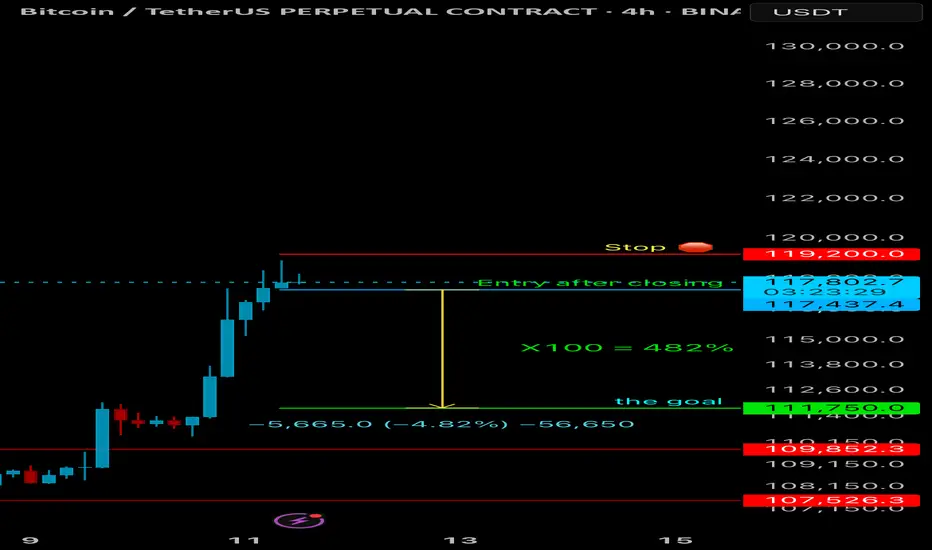
BTCQuick trade. I hope everyone manages their risk and enters after the close. 4-hour time frame. Leverage from 10 to 100.
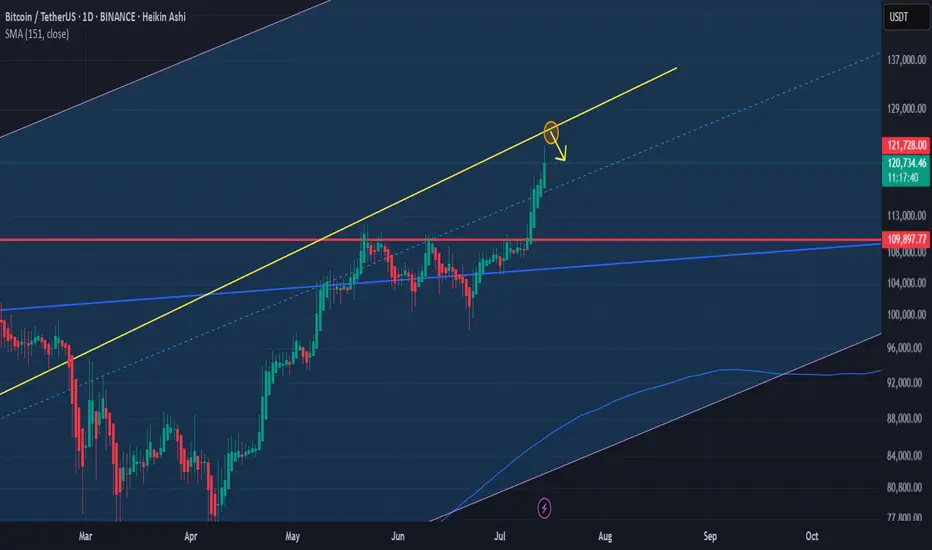
$BTC All Eyes on the FVG Zone. CRYPTOCAP:BTC broke out above key resistance and is now retesting the FVG zone near $112K–$115K.
Holding this level could trigger a fresh rally toward $127K–$132K.
DYRO, NFA

BTC/USDT – Weekly Outlook & Reflection (15m, Ichimoku) by RiscorA new trading week begins after an exceptionally strong bullish close last week. Given the strength of that rally — and seeing how long/short ratios are now heavily skewed to the long side — I expect this week to open with a pullback.
To me, the bullish impulse feels exhausted, so I’m watching for a short-term retracement. My initial target is a move toward 117,500, but if the correction accelerates, we could even see a deeper dip, possibly down to the 113,000 area.
That said, the uptrend is still strong — any shorts here are high-risk, countertrend trades. I’ll treat all short setups as tactical reversals only, not as a full trend change. Caution is key in this environment!
Let’s see how the structure develops as the week unfolds.

BITCOINAs of July 11, 2025, Bitcoin (BTC) is experiencing a strong bullish surge, reaching new all-time highs:
Current Price: Around $117,786 per BTC, up about 1.55% on the day, with an intraday high near $118,780.
Market Cap: Approximately $2.33 trillion, reflecting significant institutional and retail interest.
Trading Volume: High, with 24-hour volume exceeding $124 billion, indicating robust market activity.
Key Drivers Behind Today’s Bitcoin Rally:
New All-Time High: Bitcoin recently surpassed its previous record, hitting nearly $118,800, fueling bullish momentum.
Massive Short Squeeze: Over $1 billion in short positions were liquidated within 24 hours, including around $570 million in Bitcoin shorts, accelerating the price rally.
ETF Inflows: US spot Bitcoin ETFs have seen substantial inflows (around $50 billion this week), signaling strong institutional demand.
Technical Breakout: Technical indicators show a strong bullish trend, with Bitcoin targeting levels above $126-130K,
Macro Environment: The US dollar is weakening sharply (its worst performance since 1973), boosting risk assets like Bitcoin.
Growing Adoption: Corporate treasury purchases and positive regulatory developments in the US are enhancing investor confidence.
Market Sentiment and Outlook:
The Relative Strength Index (RSI) is above 70, indicating strong bullish momentum but also suggesting caution for a possible short-term pullback.
The number of Bitcoin wallets holding BTC has increased significantly, showing renewed accumulation by investors.
Technical Outlook Bullish, target $120K+
Bitcoin’s rally today is driven by a powerful combination of technical breakout, institutional buying, short squeeze dynamics, and supportive macroeconomic factors, making it one of the strongest moves in crypto markets this year.
#BTC #BITCOIN

Idea that BTC will retrace before bullish continuationI might be wrong tonight, i see some clowns (cme gaps, fibs, OB) lurking need to be eliminated soon, i wish i'm wrong this idea, going to retrace at 113 before bullish continuation. Anyway DYOR and stay safe!

BTC - Can it reach 100k?FOR SUREEEEE it can! Just let it close above 120k for it to form in a formed manner or way


Overlaying AI forecast directly onto chart. Judge for yourself On the 27th of June I put through a prediction into my AI forecasting machine and this is what it said (image on screen)
I am SO impressed with the forecast so far, so I've overlayed the image onto the price action and will check in on it daily
This will give You the dominant trend direction for Bitcoin, and perhaps some extra capital in your accounts #you'reWelcome

BTCUSDT - going to 113866.19$My analysis is based on numerology, all the numbers you see on the chart are from the same place. There is a certain numerological symbolism, which tells me that the price has already put the bottom 49(13) and will make a reversal from the zone 52260+- and then will fly strongly upwards with the target first 89k bucks, and after 113k. It's time to look for a good entry point.

BTC & USDT.D => Bullish Correction Incoming?Hello TradingView Family / Fellow Traders. This is Richard, also known as theSignalyst.
Both BTC and USDT.D are sitting around key rejection zones.
💰 BTC is hovering near the $100,000 level — a major previous low and a psychological round number.
📊 Meanwhile, USDT.D is testing the 5% resistance — a supply zone and another critical round number.
As long as $100,000 holds as support on BTC and 5.1% holds as resistance on USDT.D, we could expect a bullish correction across the crypto market.
What do you think? Will these levels hold or break? 🤔
📚 Always follow your trading plan regarding entry, risk management, and trade management.
Good luck!
All Strategies Are Good; If Managed Properly!
~Rich

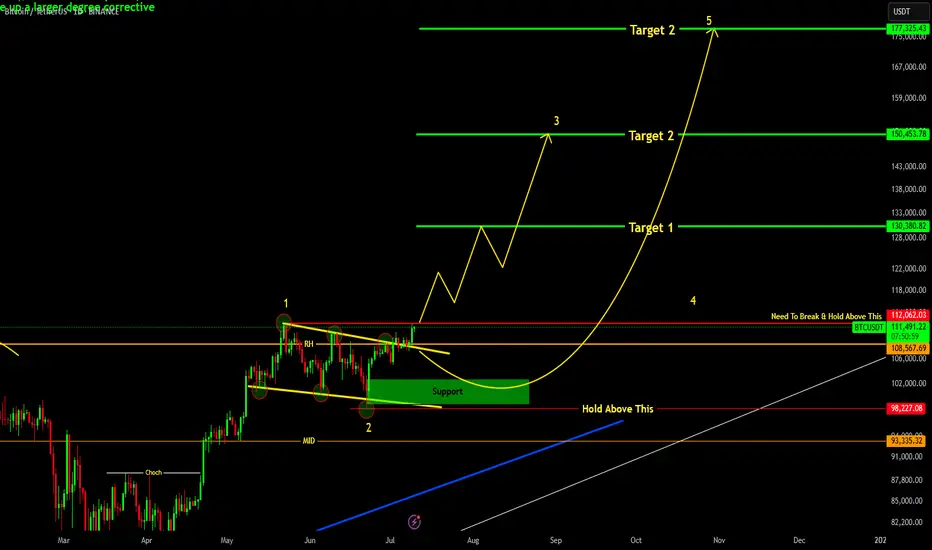
ARE YOU READY FOR 150K+ BTC RALLY !!!BTC has successfully broken out it's bull flag resistance and currently testing above it.
Major resistance resides above is 112K level , if we successfully break and hold above it then easy targets would be 130-150k levels.
Elliott Wave Count final targets 180k level.
If we goes below 106k level then we may see BTC getting into support region of 102-100K region.
For all of this, BTC should remain above 98K level.
HolderStat┆BTCUSD above $120BINANCE:BTCUSDT has surged past $129,000 following a breakout from long-term consolidation. The chart shows a clean continuation structure with the next resistance between $135,000–$137,000. Momentum remains on the side of bulls.

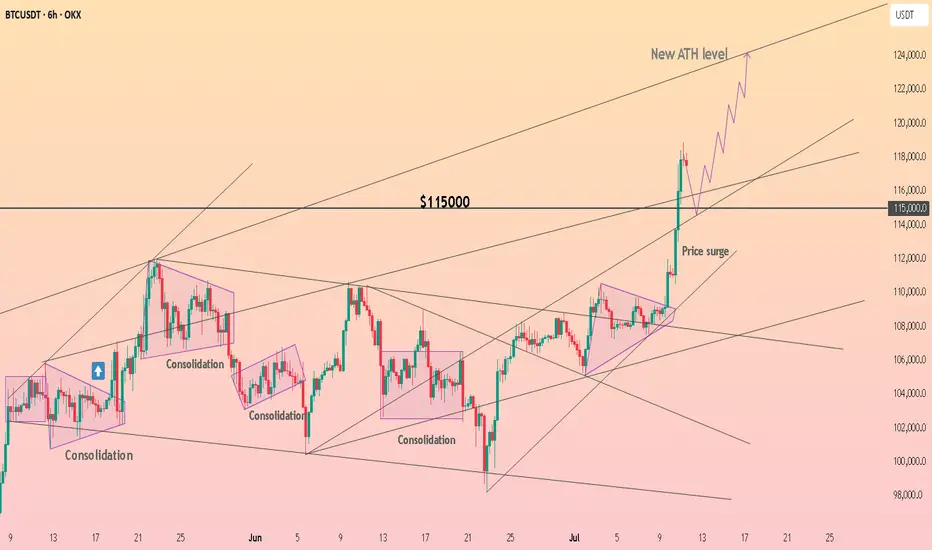
HolderStat┆BTCUSD above the $115kOKX:BTCUSDT broke out of its consolidation structure and surged past $115,000 resistance. The price is showing parabolic behavior as it targets the ATH level near $125,000. Structure remains bullish as long as the support base near $113,000 holds.
Bitcoin Trading Update:From the current market position at 102,663.96, Bitcoin is poised within a key price range. As per your outlined strategy, you're targeting a potential 4.71% drop to the mitigation block at 97,911. This level serves as a critical zone for price action, which could offer an opportunity for a potential reversal or continuation.
Key Levels:
Dealing Range High: 117,900
Mitigation Block: 97,911
Current Price: 102,663.96
Potential Drop: 4.71% to the mitigation block
Price Target (TP):
From the mitigation block at 97,911, the target suggests a 20% potential gain as the price moves toward the upper boundary of the dealing range at 117,900.
Key Observations:
Risk/Reward Ratio: The setup shows a favorable Risk/Reward ratio of 4.75, which aligns with a solid risk management strategy, especially considering the potential for a 20% gain from the mitigation block to the dealing range high.
Stop Loss: The stop loss is set around 93,456.00 as per the chart, ensuring proper risk management in case the market moves against the expected setup.
Suggested Strategy:
Entry: Watch for price action near the mitigation block (97,911) for a potential entry.
Take Profit: Aim for the 117,900 level, targeting a 20% gain.
Stop Loss: Keep stop loss orders at 94,960 to protect against larger downside movement.
This setup offers an attractive risk/reward proposition, but always ensure you are actively managing the trade, especially if price approaches the mitigation block.


BITCOIN WE shared for free the strcuture of bitcoin and it came back 100% complete. On break and retest and 116k is target and 126-128k will be watched.
trading is probability and any key level can fail.

BTC trading planBINANCE:BTCUSDT A full day has passed since my last update. We’re now witnessing a clear bull-to-bear reversal in market sentiment. The hourly RSI is deeply oversold, but the 4-hour RSI still has room to drop further. Price is aggressively targeting the weekly pivot at $115,334. With the local trendline and the $119K level broken, the orange scenario is now in motion. A short pullback is possible before the next leg down toward $110K. For details, see yesterday’s video
Trade safe and stay adaptive

Don't take a short position BTCUSDT"Don't take a short position, but be prepared for a temporary drop before the market goes back to ranging. Right now, we're in one of the most exciting moments in the BTC market. "
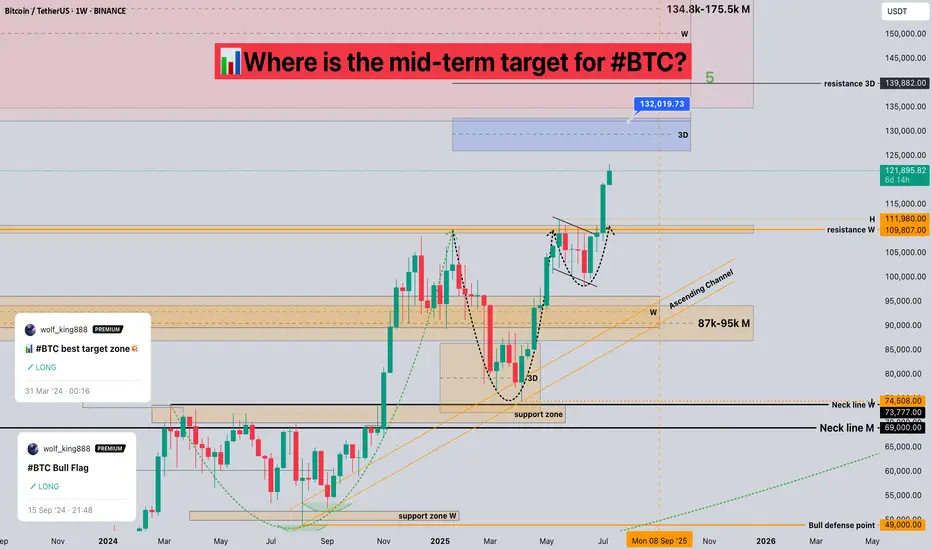
Where is the mid-term target for #BTC?📊Where is the mid-term target for #BTC?
🧠From a structural perspective, the bullish structure at the weekly and monthly levels is intact, so any increase is reasonable. We are approaching the target area of 132k-175.5k at the weekly and monthly levels. Please remember to lock in profits for spot trading.
➡️The weekly closing price is higher than the weekly resistance line, so the resistance line turns into a support line. If the price can return here again, you can look for bullish signals to participate in some long trades.
⚠️Short trading is a counter-trend trade, so we need to be cautious enough, and risk management is a must.
🤜If you like my analysis, please like 💖 and share 💬
BINANCE:BTCUSDT
Bitcoin (BTCUSDT) Potential Move from $43,600 to $120,000Description:
Based on the current weekly chart analysis for Bitcoin / Tether Standard Futures (BTCUSDT), there is a significant potential for Bitcoin to move from $43,600 to $120,000. Below are the key points observed:
Current Price: Bitcoin is currently trading at approximately $54,806.45, down by 5.75%.
Elliott Wave Analysis:
The chart indicates a potential ABC correction pattern.
Wave A has completed, and Bitcoin is currently in Wave B, which suggests an upcoming bullish Wave C.
Support and Resistance Levels:
The primary support level is at $39,987.31.
The significant resistance level and target is the area around $120,000.
Fibonacci Retracement Levels:
38.2% Retracement: $31,145.00
50.0% Retracement: $23,356.00
61.8% Retracement: $15,568.00
Indicators:
RSI shows potential bullish divergence indicating a possible upward move.
Volume profile indicates strong accumulation in the lower price ranges.
Extrem Buy Alert: The chart highlights an "EXTREM BUY ALERT," suggesting that the current levels could be a significant buying opportunity before the expected upward move.
Chart Details:
Timeframe: Weekly (1W)
Ticker: BTCUSDT.PS
Exchange: Binance
Disclaimer: This analysis is based on historical data and technical indicators. It is not financial advice. Please conduct your own research before making any trading decisions.

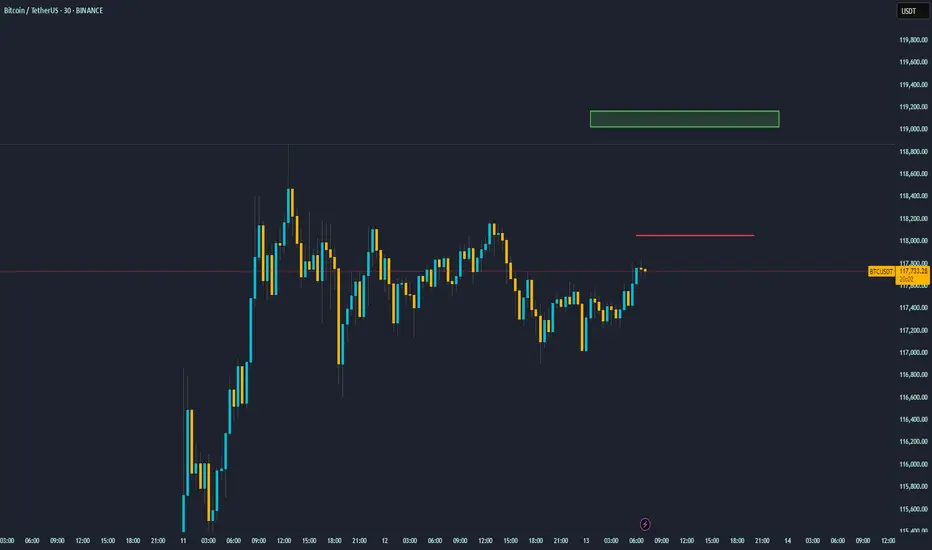
Bitcoin at a Crossroads: Key Levels to WatchThis 30-minute chart for Bitcoin (BTC/USDT) shows the price consolidating within a range after a strong upward rally. The key levels drawn on the chart outline a potential trading plan for the next short-term move.
Asset: Bitcoin / TetherUS (BTC/USDT)
Timeframe: 30-Minute (Short-term outlook)
Current Situation: After a significant price surge on July 11th, Bitcoin has entered a sideways consolidation phase. The price is currently making a move towards the top of this range, approaching a critical resistance level.
Key Levels Explained
Immediate Resistance (~$118,000): The red horizontal line marks the immediate resistance. This is a crucial level that has previously rejected the price. For the current upward momentum to continue, Bitcoin must decisively break and hold above this price ceiling.
Primary Target / Supply Zone (~$118,900 - $119,100): The green box above represents the next major resistance area or "supply zone." This is the logical target for bulls if they can successfully break through the immediate $118,000 resistance.
Potential Scenarios
Bullish Scenario: If Bitcoin breaks through the $118,000 red line with strong volume, it would signal a potential continuation of the uptrend. Traders would then look towards the green box around $119,000 as the next take-profit area.
Bearish Scenario: If Bitcoin fails to break the $118,000 resistance and gets rejected, it is likely to fall back towards the lower end of its current range. The recent lows around $117,000 - $117,200 would act as the first line of support.