Bitcoin (BTCUSDT) Potential Move from $43,600 to $120,000Description:
Based on the current weekly chart analysis for Bitcoin / Tether Standard Futures (BTCUSDT), there is a significant potential for Bitcoin to move from $43,600 to $120,000. Below are the key points observed:
Current Price: Bitcoin is currently trading at approximately $54,806.45, down by 5.75%.
Elliott Wave Analysis:
The chart indicates a potential ABC correction pattern.
Wave A has completed, and Bitcoin is currently in Wave B, which suggests an upcoming bullish Wave C.
Support and Resistance Levels:
The primary support level is at $39,987.31.
The significant resistance level and target is the area around $120,000.
Fibonacci Retracement Levels:
38.2% Retracement: $31,145.00
50.0% Retracement: $23,356.00
61.8% Retracement: $15,568.00
Indicators:
RSI shows potential bullish divergence indicating a possible upward move.
Volume profile indicates strong accumulation in the lower price ranges.
Extrem Buy Alert: The chart highlights an "EXTREM BUY ALERT," suggesting that the current levels could be a significant buying opportunity before the expected upward move.
Chart Details:
Timeframe: Weekly (1W)
Ticker: BTCUSDT.PS
Exchange: Binance
Disclaimer: This analysis is based on historical data and technical indicators. It is not financial advice. Please conduct your own research before making any trading decisions.
BTCDOWNUSDT trade ideas

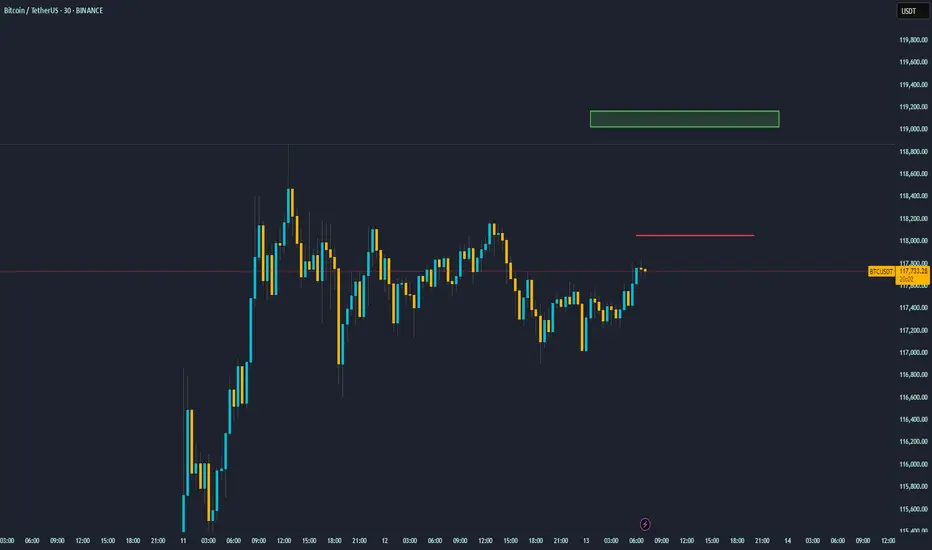
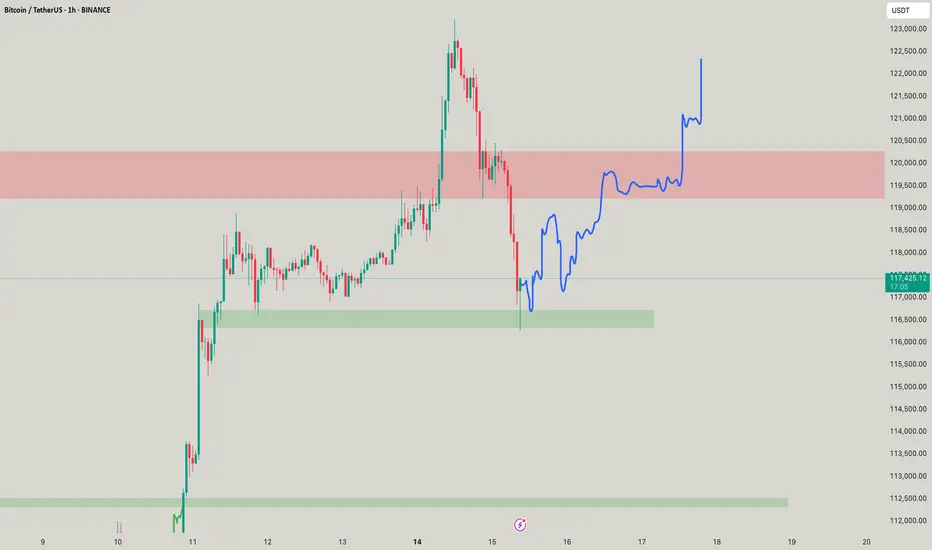
Bitcoin at a Crossroads: Key Levels to WatchThis 30-minute chart for Bitcoin (BTC/USDT) shows the price consolidating within a range after a strong upward rally. The key levels drawn on the chart outline a potential trading plan for the next short-term move.
Asset: Bitcoin / TetherUS (BTC/USDT)
Timeframe: 30-Minute (Short-term outlook)
Current Situation: After a significant price surge on July 11th, Bitcoin has entered a sideways consolidation phase. The price is currently making a move towards the top of this range, approaching a critical resistance level.
Key Levels Explained
Immediate Resistance (~$118,000): The red horizontal line marks the immediate resistance. This is a crucial level that has previously rejected the price. For the current upward momentum to continue, Bitcoin must decisively break and hold above this price ceiling.
Primary Target / Supply Zone (~$118,900 - $119,100): The green box above represents the next major resistance area or "supply zone." This is the logical target for bulls if they can successfully break through the immediate $118,000 resistance.
Potential Scenarios
Bullish Scenario: If Bitcoin breaks through the $118,000 red line with strong volume, it would signal a potential continuation of the uptrend. Traders would then look towards the green box around $119,000 as the next take-profit area.
Bearish Scenario: If Bitcoin fails to break the $118,000 resistance and gets rejected, it is likely to fall back towards the lower end of its current range. The recent lows around $117,000 - $117,200 would act as the first line of support.
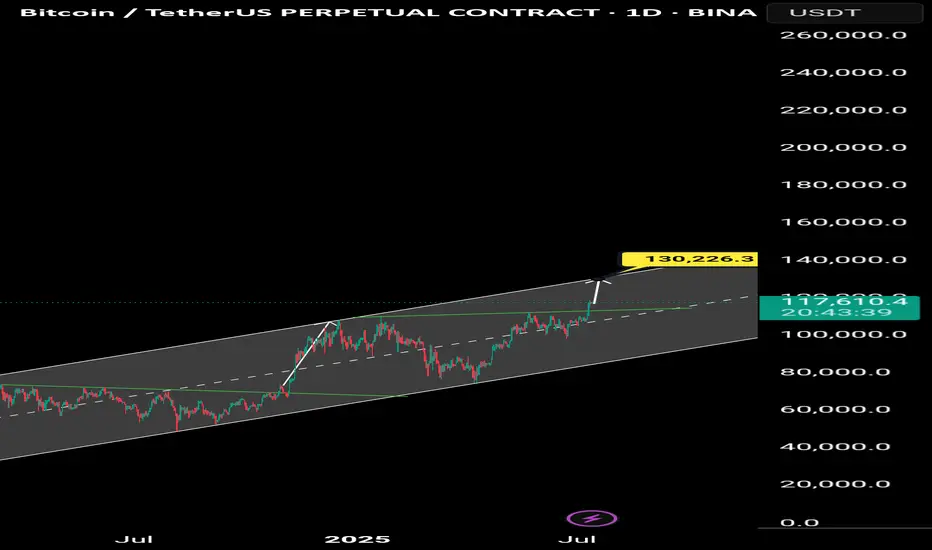
Bitcoin Go 130kBitcoin is heading towards 130,000 tomorrow
The alt season has begun and the market is sharply bullish.
I see that you are in profit, but your voice is not heard.Hello friends...
I see that you are in profit, but you are not making any sound.
As we mentioned in previous analyses, the upward trend has started, now the scenario ahead must be considered.
Like previous analyses, I still consider the area of $134,000 to $137,000 to save profit in this upward trend.
After the price of Bitcoin reaches the said area, you can save profit or think about selling Bitcoin.
But Bitcoin targets are higher than this desired number, but for some reasons (such as US tariffs and war), we cannot give high targets. In future analyses, I will say what our team thinks is the ceiling of this Bitcoin upward cycle.
So follow the page so that you don't miss the analyses.

More upside for BitcoinHi traders,
Last week Bitcoin made a small move down before it shot up again.
It looks like this is wave 3 so we could see a small correction down and more upside for this pair.
Let's see what the market does and react.
Trade idea: Wait for a small correction down on a lower timeframe and a change in orderflow to bullish to trade longs.
If you want to learn more about trading FVG's with wave analysis, please make sure to follow me.
This shared post is only my point of view on what could be the next move in this pair based on my analysis.
Don't be emotional, just trade your plan!
Eduwave

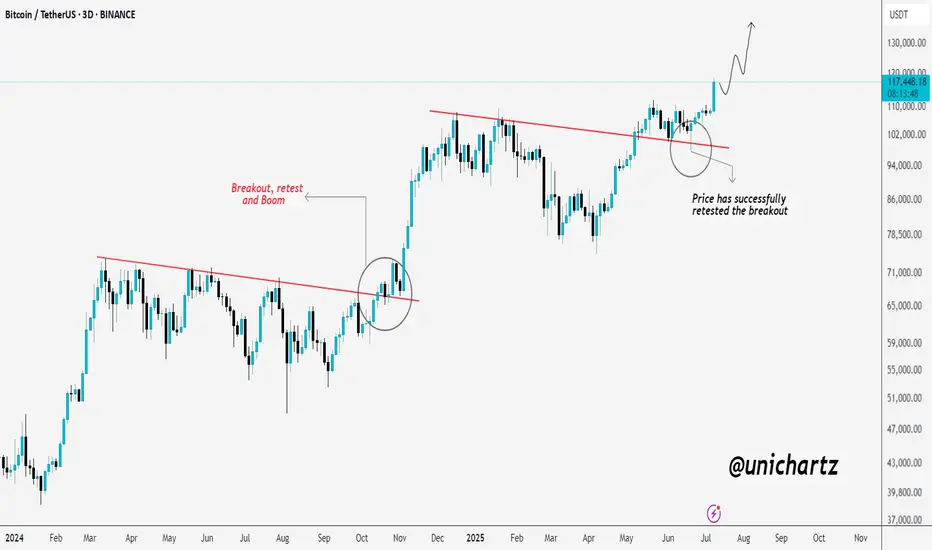
Bitcoin Looks Ready for LiftoffBitcoin is showing a textbook bullish continuation.
After breaking out of a long-term downtrend line, CRYPTOCAP:BTC came back for a clean retest — just like it did during the last breakout phase. That previous breakout led to a massive rally, and now we're seeing a very similar setup again.
The retest around $94K held perfectly, confirming strong demand and validating the breakout. Since then, price has pushed higher with momentum, now trading above $117K.
If this pattern continues to play out like before, Bitcoin could be eyeing $130K and beyond in the coming weeks.
The structure is strong, the trend is intact, and bulls are clearly in control.
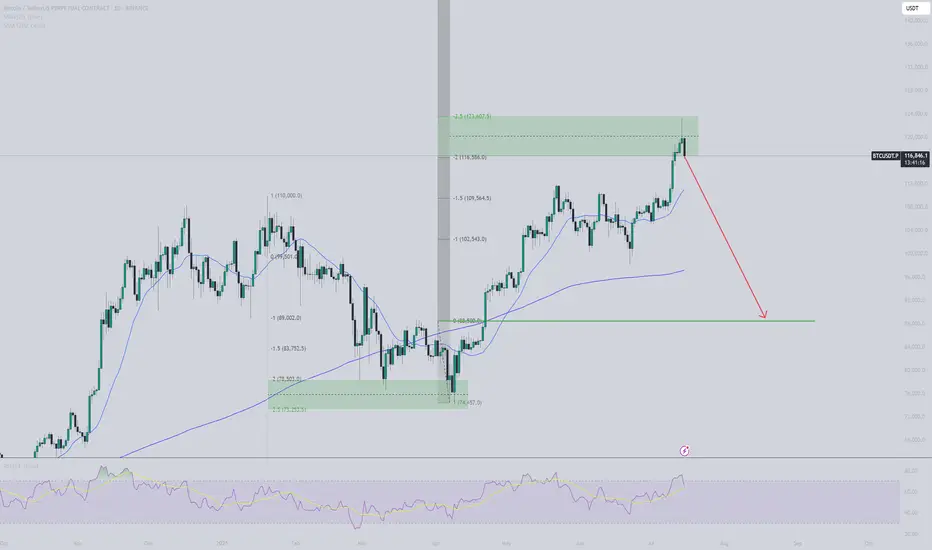
BTC retracement comingBTC seems to follow the 2-2,5 stdv price structure. Based on simply stdv from last manipulation leg down it suggests we are now at reversal zone, and I expect price to retrace down. First reaction seems to support this plan. Aiming at $88,5K.
Bitcoin Btc usdt Daily analysis
Time frame daily
If btc can't break the green uptrend line strongly I guess it drops to 87$
But if btc can continue it's sharp way , my target is 170 $

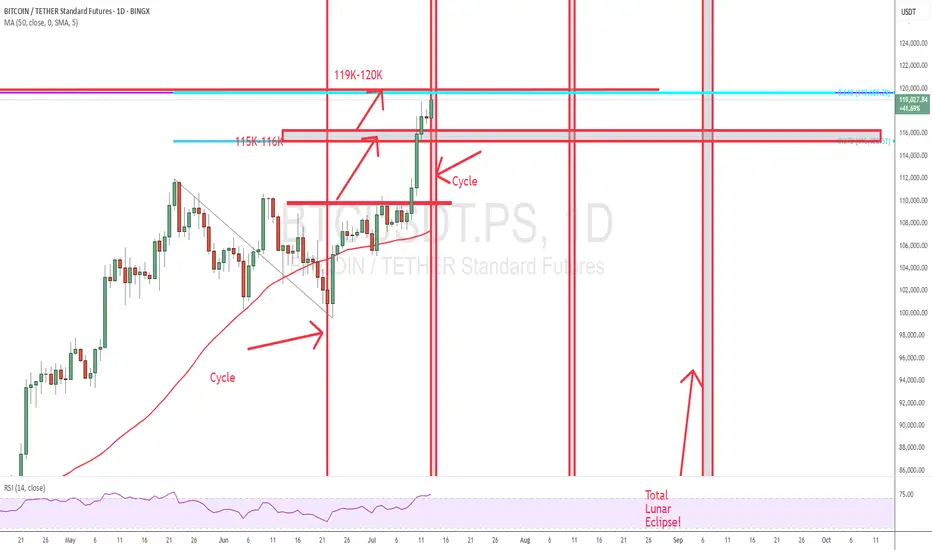
BTC updateFinally, BTC got to my price.
It came exactly to the price and Time (Cycle). Let's see if we clear that.
Good Luck
BTC - Last Chance to be Mindful of Potential Flash CrashBTC is at the top of the zone of this bearish retest.
DXY is currently retesting a major breakdown on the monthly time frame - which projects out a 2-4 year bull run for BTC.
Due to this major macro turning point, it’s possible we see an extreme liquidity grab crash on Bitcoin - recovering liquidity as shown on this chart.
Projected movements marked here.
Be prepared for anything - volatility expected

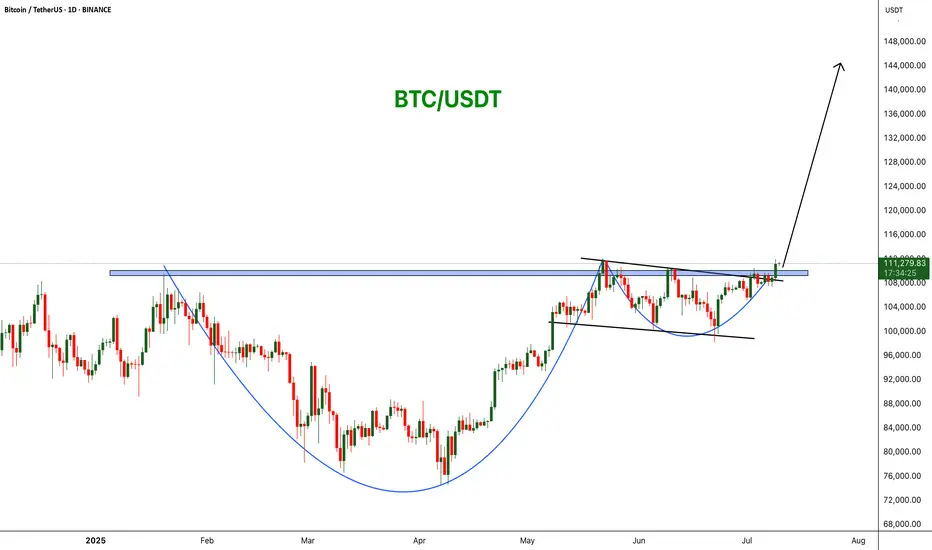
BTCUSDT: Cup and Handle Breakout! BINANCE:BTCUSDT is forming a powerful bullish breakout from a cup and handle pattern on the daily chart. Price has cleared key horizontal resistance around $110,000, signaling strength and the potential for a continuation move toward $144,444.
Stop Loss: $98K
Target : $144k
CRYPTOCAP:BTC
BTC ALL SET FOR MAJOR HIGHS The price has tested the resistance line multiple times showing strong supply/resistance. Buyers are gradually pushing price higher (higher lows), but momentum is weakening near resistance.
This is a sign of consolidation under resistance pattern before breakout .Rising wedge typically breaks down signaling a potential drop, it confirms weakening momentum.
Area to Watch for Entry
103000-104000 (recent demand zone) for Bullish
After daily candle closes above 113000 instant bullish Entry.

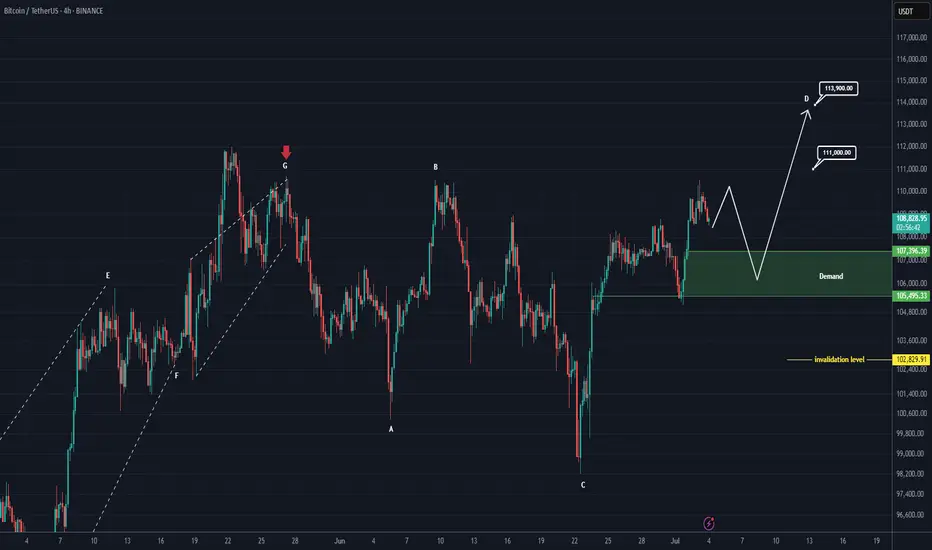
Bitcoin New Update (4H)This analysis is an update of the analysis you see in the "Related publications" section
If we were to publish an update for Bitcoin, wave D could move toward higher levels.
After hitting the green zone and gaining momentum, it could once again move upward to liquidate short positions.
In this update, we've naturally raised and revised the invalidation level.
The new targets have been marked on the chart.
A daily candle closing below the invalidation level would invalidate this analysis.
For risk management, please don't forget stop loss and capital management
Comment if you have any questions
Thank You
BTC is sitting on a volcanoStrong resistance at 110k and things couldn't get hotter for BTC esp. with the President pumping it and profiting from all of this (ethics 101). Let's recap: yields going up, economy is cooling (S&P going up for a week is not a reflection of things getting better), high interest rates, ultra high historical multiples, tariffs and higher debt, which are inflationary are all in front of us. This is not sustainable, a correction will happen very soon and people could get wiped out.
Always do your own due diligence and best of luck! Profit takers and crypto bros will start selling real soon, just like every other time before.

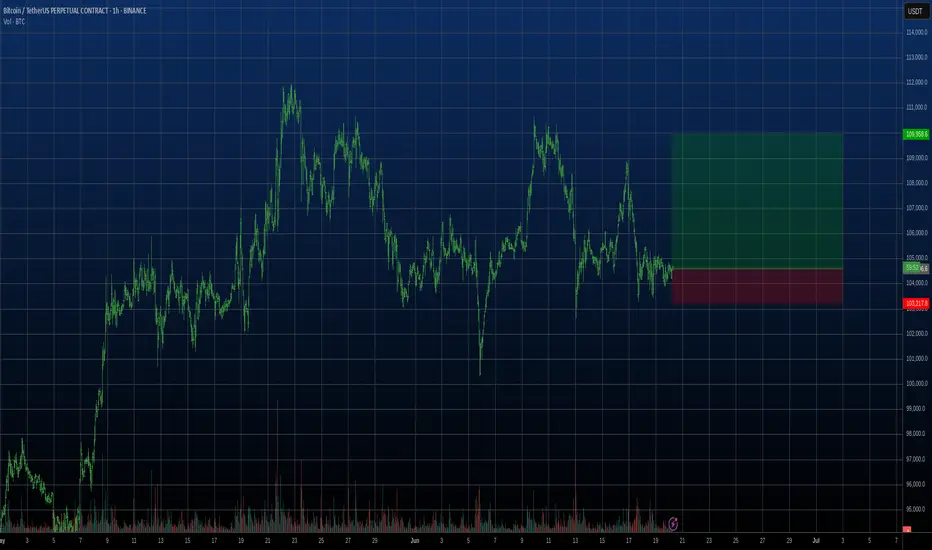
Good moment for try to Buy BTCGood moment for try to Buy BTC. A good triangle has formed. There are prerequisites for its upward breakout. Very good risk/reward ratio. Stop below the triangle. Let's see...
Bitcoin(BTC): Buyers Took Control | $120K is More Than RealisticBitcoin is getting ready to form a new all-time high (ATH), where after a slight rejection near the $110K area, buyers are back.
As we had recently broken the major resistance zone, and now we are seeing signs of a successful retest to occur as well, we are looking for proper volume to come in, which would then give us a possible BOS here; that's what we are looking for.
As soon as we form that BOS near $110K, we will be looking for another healthy bullish movement.
Swallow Academy

Golden Bitcoin Signal: A Great Investment Opportunity🔔 Our Bitcoin Investment Bot has issued an exclusive signal! This signal, backed by 15 years of historical data analysis, marks the perfect time to enter the market. 🎯 Take Profit Target: $120,975 (equivalent to a potential 50.5% profit)
⚖️ Professional Risk Management: This signal comes with a Stop Loss at $66,835 (16.8% risk), offering an ideal balance of profit and risk. Our bot, with its advanced and data-driven strategies, identifies the most valuable investment opportunities.
⏳ Opportunities don’t last forever! This signal could be the start of a significant move. Now is the best time to act and take advantage of this precise analysis. With our bot, you’re one step closer to sustainable profitability. 🌟

$BTC CRYPTOCAP:BTC 💰
CRYPTOCAP:BTC Update 💰
If we look at the current situation, there's a potential for a correction first...
I think reaching the demand area around $116K would be really solid, bro...

BTC/USDT, 1H chart, Futures - Bearish projection.the price looking for high areas without time in the SQZ minitor or strength, I hope that during the morning today it will fall and begin its journey to low areas between $115,500 and $114,500.

BTC - Can It go back to 123k - 124k?Yeaah IT CAN! Provided you know where it moves out, it have little imbalances at 115k as well so eye on it as well!
Bitcoin : Missed $100K? Don’t Miss What’s Coming Next!!MARKETSCOM:BITCOIN BINANCE:BTCUSDT continues to show exceptional strength and strong bullish momentum. When we look back at the charts from 2023 and 2024, a clear and reliable pattern stands out. Each time Bitcoin touched the 50 EMA on the weekly chart, it triggered a significant rally that led to new all-time highs. That same setup appears to be forming once again.
MARKETSCOM:BITCOIN tested the 50-week EMA around the $75,000 level and has since bounced with conviction. The price has reclaimed the $100,000 mark and is now challenging previous all-time high resistance. Historically, a successful bounce from this key moving average has not only signaled recovery but also sparked explosive upside moves.
Following this repeating pattern, the current cycle target is positioned at $150,000. A clean breakout above the current resistance zone could act as the trigger that launches Bitcoin into uncharted territory. The technical structure remains bullish, momentum is clearly accelerating, and the overall trend continues to favor the upside.
This moment represents a textbook Buy and HODL opportunity. Technical indicators are aligning, market sentiment is turning increasingly optimistic, and all signs suggest that Bitcoin could be preparing for another historic rally. Stay ready for what could be the next big move.
Follow Our Tradingview Account for More Technical Analysis Updates, | Like, Share and Comment Your thoughts

BITCOIN LONG TRADEBTC had a large flush after its ATH of 123.1k causing most late longs to get wiped out. It seems fear has been overestimated and we should see a reversal soon. We're also near major support on the 4h and have an oversold StochRSI. CPI numbers are coming out today so make sure you're managing risk accordingly and only invest what you can afford to lose.

BTC in a Bearish 60 min movementBTC in a 60-minute bearish move
It appears that BTC has already completed the C leg of a 60-minute harmonic pattern near 109680
BTC is forming a larger corrective pattern rather than taking a true direction, thus increasing the chances of completing this pattern before moving up again.
Currently, the price is positioned to complete the D leg of the pattern near 105700
I am looking for short-term targets near 107240; 106275 and 105715
You may find more details in the chart!
Thank you and Good Luck!
PS: Please support with a like or comment if you find this analysis useful for your trading day
