ETH/BTC iC&HPlenty of positivity for ETH/BTC at the moment that this is the time for it to make up some ground on big brother.
I can want to give an alternative scenario.
I followed Garmin on a tradition Cup & Handle just recently, so there is some recency bias here.
***This is the ETH/BTC chart inverted to show a traditional C & H...please don't be mistaken.
BTCETH trade ideas

ETHBTC Opportunity Buy: Major 2025 AltcoinSeason & Bull MarketThis is the big one and the good one. ETHBTC was bearish since December 2021 but this cycle finally came to an end in April this year. After the initial bullish breakout and higher low we can clearly see some bullish action developing; three consecutive weeks green. The bullish bias is now confirmed. It is still early.
We are looking at 200% potential. The "back to baseline" target. This is a price range where ETHBTC traded sideways as part of a distribution phase for more than two years. This is a must-to-be-tested resistance zone and thus opens up a sure 200% profits potential for this newly developing bullish wave.
Ethereum's ETFs are coming, Bitcoin already has its ETFs. This can mean Ethereum outperforming Bitcoin, and many altcoins, in so many ways. This also opens up the potential for a new all-time high on this pair.
The same sequence of 'low-higher low' happened in the last bull market. ETHBTC hit bottom in September 2019 then produced a higher low and this signaled the start of a major, long-term 447% rise. The conditions are similar now but the rise will be faster.
We have two main targets for the all-time high in late 2025 or early 2026.
1) 0.13207. With 442% profits potential from current price.
2) 0.20278. With 733% profits potential.
The entire bullish cycle for this pair can unravel within 4-6 months. If it becomes extended, it can last one year or longer. Both scenarios are possible.
It is 100% certain that ETHBTC will go on a major bullish cycle together with the rest of the altcoins market. Bitcoin will also grow.
Thanks a lot for your continued support.
If you are bullish on Crypto, comment below.
Namaste.

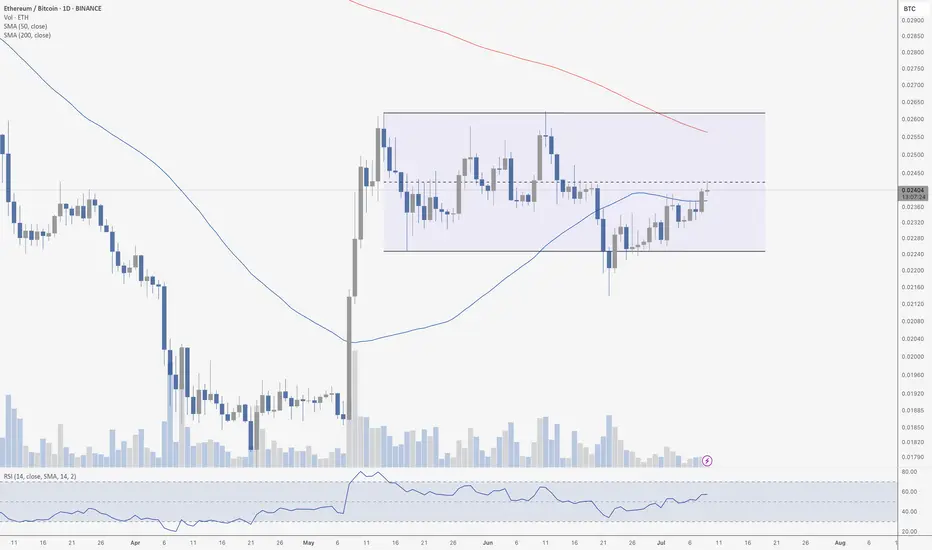
ETH Flips 50 MA Against BTCThe ETH/BTC daily chart shows a prolonged consolidation phase following the explosive breakout in early May. Since then, price has been range-bound between approximately 0.022 and 0.026. We're currently sitting near the EQ (equilibrium) of the range – around 0.0240 – which often acts as a temporary magnet for price and a decision point for direction.
Importantly, ETH/BTC closed back above the 50-day moving average yesterday for the first time in weeks. This is a notable shift in short-term momentum and could be an early sign of bullish continuation, especially if the pair can push above the EQ and flip it into support. RSI is trending upward without being overbought, adding to the momentum argument.
However, until we get a breakout from this range – particularly a close above the 0.026 resistance – it’s still a game of chop. The return above the 50 MA is promising, but bulls need to defend it and push higher to regain control.
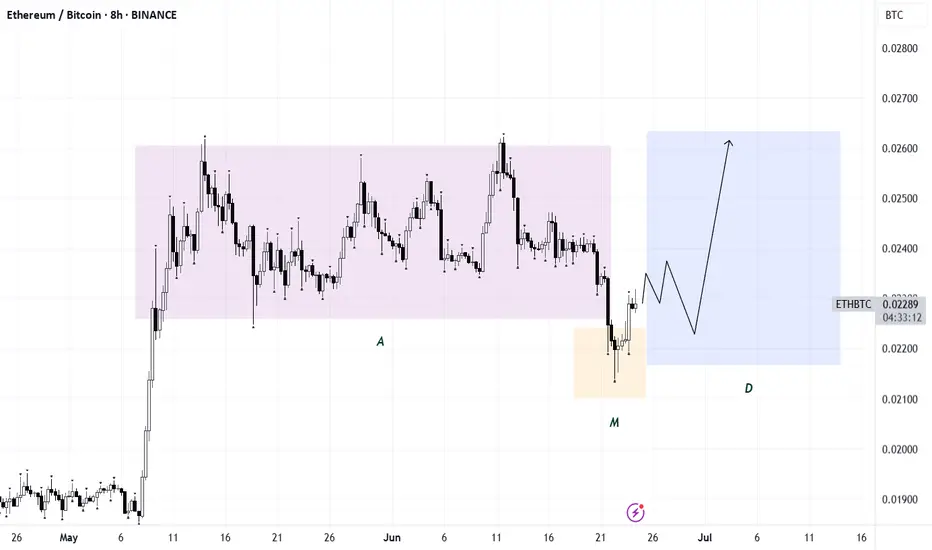
ETH/BTCPrice is following an AMD structure with a liquidity sweep to the downside. For full confirmation of the setup, a daily FVG inversion is required.
Watching closely — confirmation will unlock further directional bias.

Ethereum vs BitcoinI will be buying Ethereum once we hit the level of interest
The 2021/22 lower high on macro scale is scary, that needs it's own algorithmic target to level it off
Actual bulls are waiting the opportunity
Algo target right into golden zone after we made lower high on monthly scale, is not that beautiful ?
Just wait
Wonka

ETH/BTC At 50 MA ResistanceEthereum is battling the daily 50 MA on the ETH/BTC chart, a key area of resistance. If it beaks above, we could see a nice altcoin rally and Ethereum outperforming. If it gets rejected… more of the same.

ETHBTCTick tock
This is the most unlooked at chart in crypto because there is nothing bullish about it but eths fundamentals are insanely bullish
I'm a huge eth bull and hate looking at this chart
It will run it back at some point but its clearly not in a rush and lesser understood on the institutional finance side of the market.

A major turning point
✅ Observations from the Chart
1. Long-Term Support Zones:
• Three key areas are circled (around 2016–2017, 2019, and 2024–2025).
• All three touch similar levels, around 0.022–0.024 BTC/ETH, indicating a strong historical support zone.
2. Previous Rebounds from This Level:
• Each time price hit this zone in the past (2016 and 2019), it triggered a strong upward movement, suggesting this level has historically served as a launch point for bullish trends.
3. Volume Observation:
• Trading volume has significantly declined from 2022 to 2025, which could indicate a period of accumulation.
4. Current Price Level (July 2025):
• ETHBTC is currently hovering near this long-term support area, which may suggest another potential rebound—if the support holds.
⸻
📈 Trend Outlook
Short to Medium Term:
• Still in a downtrend, as seen from the consistent decline since late 2021.
• However, the downtrend appears to be losing momentum, with price consolidating near support and lower volume.
Long Term:
• If the 0.022 BTC/ETH support level holds, there is potential for a trend reversal similar to previous cycles.
• Look for confirmation through bullish divergence on indicators like RSI or MACD.
⸻
🔍 Risks / Caution Points
• If ETHBTC breaks below this key support level (e.g., under 0.020), it could lead to further downside.
• Rising Bitcoin dominance may also weigh down ETH performance relative to BTC in the short term.
⸻
🧠 Summary
• ETHBTC is testing a critical long-term support zone.
• If the support holds, a bullish reversal could occur, presenting a potential accumulation opportunity.
• However, do not underestimate the risk of a breakdown below support—this could result in a continuation of the bearish trend.
⸻
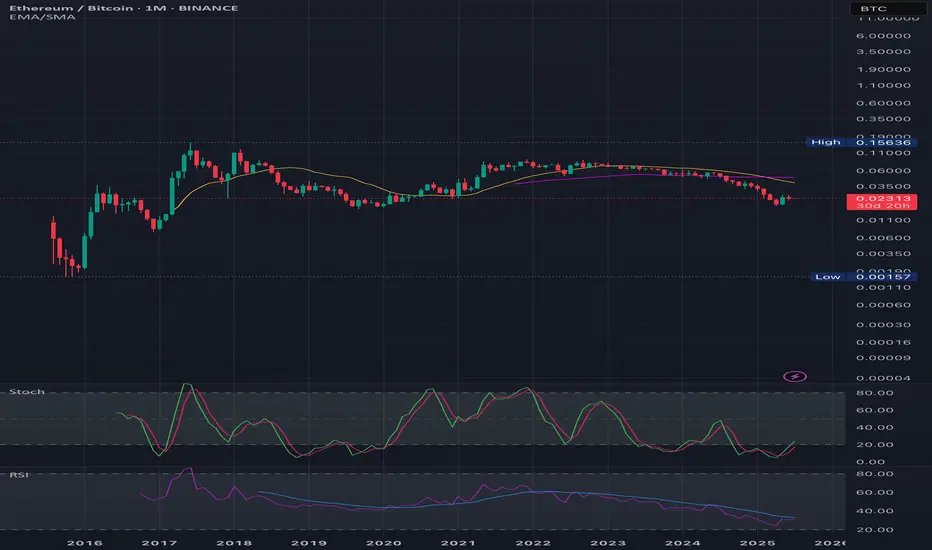
Ethereum’s quarterly returns have finally outpaced Bitcoin's !🥶 After a painfully long #altcoins winter, the #ETH/#BTC chart — having recently hit its lowest point in the past 5 years — has finally shown CRYPTOCAP:ETH outperforming CRYPTOCAP:BTC by the end of Q2 2025.
We saw a similar scenario in 2021, when that same bottom was reached a bit earlier, followed by a massive altcoin rally in the second half of the year. 🚀
Have our long-held expectations finally arrived? Are we about to witness what all the diamond hands have been patiently waiting for? Let’s hope so! 🤞
Will BTC pull one final trick to shake out the remaining weak hands? Most likely — yes. 😥
🐋 Just remember one thing:
Throwing in the towel in the final round is a sign of weak character. 🧻🙌

ETH 400% increase Potential Ethereum (ETH) vs. Bitcoin (BTC) Analysis: 400% Upside Potential
Ethereum is showing a massive bullish setup against Bitcoin (ETH/BTC pair), with a potential **400% growth** from current levels. This rally could unfold in **two phases**, each offering around **200% gains**, driven by strong fundamentals and technical triggers.
### **Key Drivers for ETH/BTC Rally:**
1. **Spot ETF Hype** – A potential Ethereum ETF approval could fuel a FOMO-driven breakout, similar to Bitcoin’s ETF-driven bull run.
2. **EIP-4844 (Proto-Danksharding)** – This upgrade will significantly reduce gas fees, boosting adoption and DeFi activity.
3. **Institutional Accumulation** – Big players are stacking ETH, anticipating a supply squeeze post-merge.
4. **BTC Dominance Top?** – If BTC dominance peaks break to down, altcoins (especially ETH) could see explosive moves.
### **Price Projections:**
- **ETH/BTC Pair:**
- **First Leg:** 200% surge (retesting ATH levels).
- **Second Leg:** Another 200% push (breaking into price discovery).
- **ETH/USD Pair:**
- In a full-blown altseason, ETH could reach **$7,000+**, especially if BTC hits $100K+.
### Final Verdict:
Ethereum is primed for a **mega rally** against Bitcoin, with a **minimum $7K USD target** in a bullish cycle. Keep an eye on BTC dominance and ETF news—these will be the major catalysts.

ETHBTC: Ethereum to outperform massively Bitcoin.ETHBTC turned neutral again on its 1D technical outlook (RSI = 41.566, MACD = -0.00033, ADX = 21.423) as in the past 4 weeks it failed to extend the rebound of the April 14th bottom. Ahead of a MACD Bullish Cross, a little further correction to make a Double Bottom (DB) would make the pattern more bullish, much like the December 9th 2019 DB. That was the start of Ethereum's bull season. Similarly, we expect it to start outperforming Bitcoin massively and approach the R1 level (TP = 0.0800).
## If you like our free content follow our profile to get more daily ideas. ##
## Comments and likes are greatly appreciated. ##

$ETH & $ETHBTCBINANCE:ETHBTC and CRYPTOCAP:ETH
BINANCE:ETHBTC is rejecting at the 0.382 fibs level.
Technically, any coin hitting 0.236 is showing weakness.
Another retest is fine, but we don't want to see 0.236 fib level break
For CRYPTOCAP:ETH , price needs to accept above POC and hold 2.5k. If not, a move back to 2k - 1.8k is likely

ETH/BTCPotential AMD setup forming. Ideally, a distribution phase unfolds before July 9th — which could trigger a rotation into altcoins.
As always, confirmation is key for any entry. No confirmation — no trade.
$ETHBTC failed multiyear breakout. To understand the investor positioning in the Crypto markets we must understand the CRYPTOCAP:BTC values of the Altcoins. In terms of USD the valuations might go up but if we look at the pair trade of the Altcoins relative to CRYPTOCAP:BTC we can relay understand the flow among the various Cryptocurrencies.
Let’s understand the relationship between CRYPTOCAP:BTC and CRYPTOCAP:ETH , the second largest Crypto and the largest one in the CRYPTOCAP:TOTAL2 index. Below we have plotted a multiple year BINANCE:ETHBTC chart for reference. IN the previous cycle the BINANCE:ETHBTC char bottomed @ 0.02 and then BINANCE:ETHBTC had a bull run where the chart topped out on 0.09. This was during the rush of Crypto Punks and the likes which were traded using $ETH. At the same time the RSI of BINANCE:ETHBTC also peaked at 90. Since then, it has been bleeding slowly.
The BINANCE:ETHBTC has suffered a series of lower lows and lower highs forming a bearish pattern. The RSI also never regained in strength and has also been forming lower highs and lower lows. This April the BINANCE:ETHBTC touched the last cycle low of 0.02. Since then, it has tried a bounce back but failed again at 0.025. My prediction is that the BINANCE:ETHBTC will struggle to break out of the 0.236 Fib retracement levels plotted on the previous cycles Highs to the Lows.
Verdict : BINANCE:ETHBTC looks bearish on medium to long term. Short term bounce back possible to 0.0375.

ETH/BTC Just broke major support.This could be the last shake out before the alt season starts. One final capitulation and alt coins might find their lows against BTC for the long run. I am looking for a double bottom here on ETH/BTC this could be the last nail in the coffin of the BTC dominance.

$ETH / $BTC - NOT YET ETH! Almost time!CRYPTOCAP:ETH / CRYPTOCAP:BTC - NOT YET ETH! Almost time!
ETHs narrative is heating up, but I make the case that we need to see a double bottom atleast.
Study 2019!

$ETH/BTC macro planth: bearish trendline
50 fib% = scalps & intraday
61.8 fib = swings & spot & intraday

eth outperform btc time? or will it stay being a just for fun $eth outperform btc time?
or will eth stay being a just for fun coin?
let us know!
free transparent no edit no delete
🐉We value full transparency. All wins and fails fully publicized, zero edit, zero delete, zero fakes.🐉
🐉Check out our socials for some nice insights.🐉
information created and published doesn't constitute investment advice!
NOT financial advice

ETHBTC - History Repeats?ETH is has been following the same steps as it did in 2016 cycles.
Which means ETH is in a final stage of acculation, it's highlited as square box with number 5.
Final Shakeout, Final Opportunity
The last time ETHBTC looked like this, it went vertical. This box represents peak boredom for maximum breakout. This may be the last cheap ETH in BTC terms before history repeats.

Ethereum vs Bitcoin 450% Growth Potential, Already ConfirmedEthereum is preparing a 155% rise vs Bitcoin, ETHBTC. The bottom is already in and this bullish wave confirmed. The 155% target is the minimum, "back to baseline," and it happens to match MA200 and the 0.618 Fib. extension level.
The main signal is a rounded bottom after a major multiple-years long downtrend. The same signal ETHBTC produced back in September 2019 but smaller in size.
The second signal is not specific to this pair only and relates to the cyclical nature of this market. Every four years, there is a bull market.
» ETHBTC produced a bull market in 2017.
» ETHBTC produced a bull market in 2021.
» ETHBTC will produce a bull market in 2025.
(Due to changing and evolving market conditions, the 2025 bull market can extend into early 2026. Just a possibility.)
This is true also for the small and medium cap. altcoins that are yet to grow. Strong projects such as Bitcoin and many big altcoins have been bullish for very long. These are on a league of their own. They cannot wait for the end of 2025 to produce a bull market because they have too much too strong demand and so they have been growing for years on end. The other part of the market, the neglected part, is about to go nuts. Extremely bullish in short.
This is a friendly reminder, load up and hold.
You will be happy with the results.
Prepare yourself to wait for months. On the safe side, 6-8 months. That would be minimum. The longer you are prepared to wait, the better it is for your mental state. There is no way to go wrong with Crypto unless you are doing leveraged trades. If you want to have certain profits, choose reputable projects through spot, and watch your money grow. Focused always on the long-term of course.
Namaste.

ETH/BTC - Last Drawdown Before Rally Upwards!After a long downward road, CRYPTOCAP:ETH / CRYPTOCAP:BTC chart seems to be finally ready to move upwards! The first signs of strength were already shown!
(1) The chart bottomed at the 0.019₿ point, made a big pump from there and now consolidating in the tight horizontal range between 0.023₿ - 0.025₿.
(1-2) I expect to see a one final shakeout down to 0.022₿ support to trigger high-leveraged positions on altcoins (possible -5% - 20% pullback, especially on weak altcoins that didn't show any strength during the past week) .
(2-3-4) Then CRYPTOCAP:ETH can safely ride up towards 0.032₿ zone, from where I expect a local ABC correction to start. More likely we will spend the rest of summer in the 0.028₿ - 0.033₿ range.
(4-5) After that, the final wave towards 0.038₿ should happen during Autumn Season (autumn is typically a bullish time for crypto, based on the previous couple of years) .
Position yourself accordingly. This year must provide a lot of opportunities to earn not only on Ethereum, but on Altcoins as well.

Ethereum is deciding where it wants to live.This is not a trade idea, this is a long term concept, most of my portfolio is swing when bull market comes (monthly/yearly) not trade (daily/weekly).
This is a solid question that will have to be played out in the upcoming years, Ethereum keeps changing its monetary policy and right now has less supply increase than BTC (due to burning mechanisms), will that stay forever? What will happen in the future to the policy? What it will mean for price?
Right now we can clearly see this is a bull case for future months.

ETHBTC Daily Looks Constructive
ETHBTC on the daily is about to close above the previous top (pink line).
The next major resistance is the 200MA, which is not far above.
Both the SMA and MLR are above the BB center—a constructive sign.
Watching ETH/BTC closely can help shape expectations for ETH/USDT.
Always take profits and manage risk.
Interaction is welcome.
