BTC/EUR Price Check – Is Bitcoin Just Drifting Sideways?Candles at a Glance – Classic Indecision
Over the past few days, BTC has been printing mostly small-bodied candles with long upper and lower wicks — spinning tops and borderline doji territory. That’s textbook indecision, especially considering it’s happening just under a known resistance around EUR92,000.
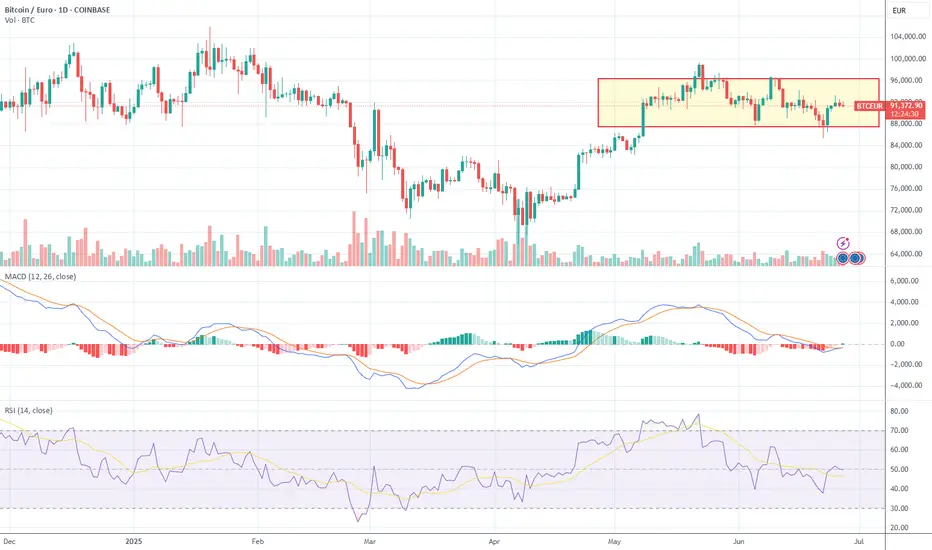
Zooming out a bit, we saw a bearish engulfing candle mid-June, right after a short-lived rally — a sign that sellers stepped in fast and took back control. Since then, no real bullish reversal patterns (like a hammer or morning star) have shown up, which makes it clear: buyers just aren’t stepping up with any conviction yet.
Takeaway: Price stalled after a weak bounce. No one’s taking the wheel right now.
Momentum Check
The broader uptrend that carried BTC from April into early June seems to be losing steam. Momentum indicators aren’t painting a strong picture:
MACD: Still showing a bearish crossover, with the histogram just flattening out — no momentum push either way.
RSI: Hovering around 46.6, below the 50 midline and drifting sideways.
Overall, there’s no panic, no euphoria — just quiet distribution. Classic "slow bleed" setup.
Takeaway: Trend looks tired. We’re probably in the middle of a sideways chop, not a trending environment.
Trading Box
BTC’s been trading inside a range since early May — roughly EUR88K to EUR96K. Price recently got smacked down near the upper boundary and is now drifting around the middle-lower part of the box. Volume hasn’t picked up on either side, which strengthens the case that we’re still stuck inside the box — no real breakout attempts yet.
Range:
Resistance: EUR96,000
Support: EUR88,000
Takeaway: Until BTC escapes this box with real volume, it’s just range-bound noise.
Fibonacci Levels to Know
Using the swing low near EUR60K and the high around EUR96K, here’s what matters:
Retracement Zones (if it breaks lower):
23.6% → EUR87,504
38.2% → EUR81,344
50.0% → EUR78,000
61.8% → EUR74,656
78.6% → EUR69,984
Extension Targets (if it breaks higher):
100% → EUR96,000
127.2% → EUR106,416
161.8% → EUR118,248
200% → EUR132,000
Current price? ~EUR91,400 — above the shallow retrace (23.6%) but well under the high. Basically... stuck.
Takeaway: Unless we see a push through EUR96K on volume, upside targets remain out of reach.
Trade Setup – Watching for a Trap
This is a textbook range trap setup. Price is stuck in a box, and while bulls are trying to hold the lower third, they’re not getting traction. Bears aren’t pressing either — it’s passive distribution, not aggressive selling.
Key Levels:
Resistance: EUR96K → Break + volume needed.
Support: EUR88K → Below here, EUR81K comes fast.
Trade Trigger: Volume spike + MACD/RSI confirmation — otherwise, it's just noise.
TL;DR Trade Edge
Bias: Neutral to slightly bearish
Strategy: Sit tight. Don’t chase in the middle of the range.
Watch for: Traps or fades near EUR96K or EUR88K
Need a real catalyst: Clean breakout with volume + momentum confirmation
BTCEUR trade ideas
It's an ideaI'm not a trader, I just like logs.
It somehow looks like we are trying to bottom here. If yes, we are in for some nice, spiky moves.

A possible future for BTCEURI see a chance of starting above 83825 euros, not until then. The MACD is holding up beautifully above zero on the seven-month timeframe, while the RSI is trying to close a cross above 50. This is positive. The smaller EMAs (8,13,21) still need to settle down, after which the bull run can begin. It will take about 3 weeks for this to happen, if we get confirmation on all other timeframes. What is confusing is that on the monthly timeframe, although the MACD is positive, the RSI does not follow it. Two cases are possible: the RSI closes the monthly timeframe cross in May-July, at the same time the MACD cross also occurs on the seven-month timeframe, or the MACD also crosses downwards on the seven-month timeframe, which brings the MACD below zero on the daily timeframe, so a longer sideways movement and decline are possible. Positive changes on the daily timeframe promote the events on the weekly and monthly timeframes. It also shows a very positive picture on a weekly timeframe, in the coming weeks it will become clear whether we will see a false breakout with a rise of a few thousand euros, or the beginning of the next bull season. If BTCUSDT makes the rsi cross on a monthly timeframe, this could happen as early as May, it could trigger an even more positive mood in both BTCEUR and the crypto market. In any case, what I see is very positive.

Bitcoin / Euro Pitchfork experimental ideaDoes Bitcoin / Euro give a new perspective compared to the usual Bitcoin / USD chart?
I drew a Modified Schiff Pitchfork with anchor-points December 2018, November 2021 and November 2022.
It seems to respect the Fib levels and 0.25, 0.5, 0.75, 1.0 levels well. Let´s see how it plays out.

Btc/eur personal chartjust another personal chart
Nothing meaningful to see here
Not intended as advice

Btc / Eur not for personal useBtc / Eur
Not for personal use
@Rekt4Sure
Short or long
Either way
Profits will be made

Bitcoin Bearish ScenarioClose the Daily below the 100 MA and we might see a further 16 - 20% downside
Move up again above the 13 EMA is Bullish

Long opportunityThe rypto is currently attempting to surpass its all-time high within the bullish momentum. If it does and settles above it, a continuation of the trend will likely happen in further establishing future highs.

Sell in may, go awayBullish divergence, positive macro outlook, very conservative playout idea. Highs are not as predictable as lows. Let’s see

RetracedAs the bias ist still bullish and we have retraced 62 % of the January rise now it seems possible to try a new rise to test the high once again.

BTC/EUR. Eyeballing across the €100'000 roofBitcoin robustly pumped to $100,000 and above for the first time on Wednesday, December 4, 2024 surging to a new record after President-elect Donald Trump unveiled administration picks seen as holding the keys to ushering in crypto-friendly policies when he takes office in January.
Chief among the picks is Paul Atkins, whom Trump intends to nominate to lead the Securities and Exchange Commission (SEC), which regulates cryptocurrency.
Atkins, know in social media as a crypto advocate and former SEC commissioner, is expected to regulate cryptocurrency with a lighter touch than Gary Gensler, who leads the commission under the Biden administration. Gensler, who aggressively fought the industry’s expansion in the US, is set to resign on Inauguration Day.
Bitcoin touched $100,000 just hours after Atkins was announced as Trump’s choice for SEC chair.
This is all right with the new milestone (counted in greenback), built on the stunning rally since Trump won the presidency throne on November 6, which fueled a $6,000 one-day spike in bitcoin that brought it to a new record above $74,000. A week later, it hit $90,000.
By the way.. The main technical graph for BTC/EUR COINBASE:BTCEUR says €100'000 milestone has not been passed through yet to this time.
While talks are talking, last exam is not passed yet. Macro data still stoke fears over a possible recession and the notion that the Federal Reserve could be too slow with cutting interest rates. Non-farm payroll added just 12K new places last month.
Fresh labor market data is on the radars on Friday, Dec 06 (+202K non-farm payroll forecasted).
Sure, there is "no guarantee", though.. until last exam is not passed yet.
In case of success only, we can talk about further growth towards 150 thousand euros.


292.000€ Bullrun Bitcoin - Continuation Shoulder Head ShoulderAs can be seen from the private videos, the bottom in form of a SHS continuation has formed.
I wait for month to go public with this Chart but i expect a lower right shoulder with approx. 25k-33k so its more symetrical. A little bit sad that i must NOW after everybody talks about the bullrun, i go public with it.
1. Szenario: Retest of the yellow neckline and targeting 118.000€.
2. Szenario: Forming as usual a new pattern and over the next month a controlled level up game with target of 292.000€ its atm the same as approc. 343.000$.
GL & HF

BTC correctionaccording to this LuxAlgo indicator, BTC can undergo a short correction. This is due to the red zone the price is in. The red zone indicates a low money flow, people do not buy or sell a lot in this zones. This suggests BTC is slighly overbought. At the other hand, the sentiment profile (at the left of the profilemap) shows a strong market, with even 100% change on bouncing futher to HH.

Trend Analysis of prediction for next peak is coming Using the Log scale, from the last cycle top which has been broken in Nov, a estimate of the exponential peak will be sometime after Feb'25.
With all the chatter about the incoming Trump Administration and the pro bitcoin Billionaires from Jan '25 on should see the RSI peak in the 1st Half of '25 in my humble view.
It is my opinion only and not financial advice

Btc will dropbtc will soon go to where it really belongs. to 22k. if. Expect alt coins to skyrocket during that period. Our best bet is Cardano

ITS gonna boom possiblyI am testing my own mathematical indicator derived from Lagrange Theory.
Its showing good signal and trend reversal.
LII is for buy and sell signal whereas LMV is for trend reversal pattern. So far its good.
Along with i use the combination of Trix and named as TRIX multiple created using ptne script editor that is available publicly now.
These two indicator are still under testing. Another anyone can try and give me feedback. With these three i can see the possibilities of BTC going upward.

up to 70kall medium ranges allign with bar prediction, all medium averages (market flow) points to a large cap injection until 70k, its buy time for hodls, medium term contracts adviced.
good trading!

BTC OUTLOOKThe projections are in favor of a momentary correction before the anticipated pump. Do not be afraid, be still and witness.


BTCEUREverything in the chart is characteristic and we are waiting for the phase change in the announced numbers


Testing my Heikin Ashi candles theory with BTCIt seems Heikin Ashi candles have a way of telling us the same story in a different way so perhaps we should pay more attention to them.
