BTCEUR trade ideas
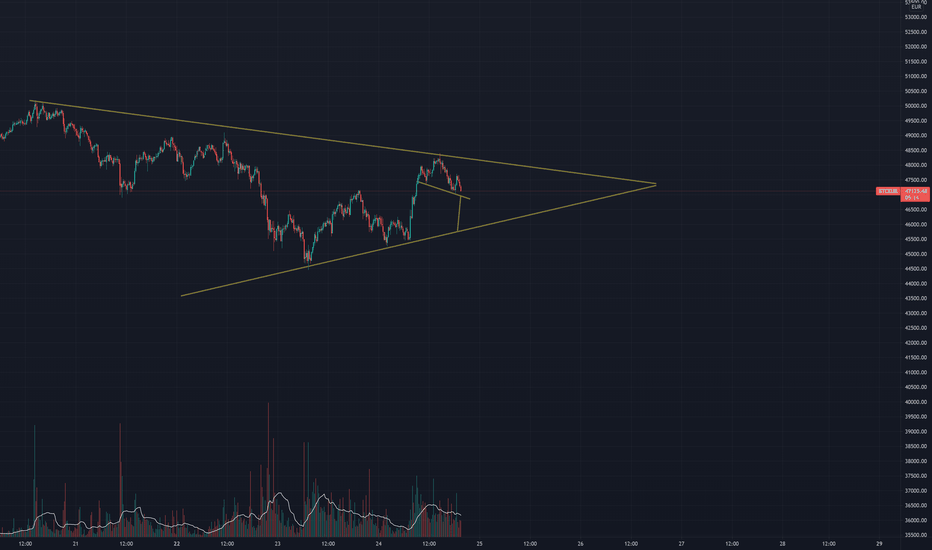
has been a weak short term period for BTCHello wonderful person!
So, the expected launch was not impressive and looked more like a hobby sized rocket launch than a NASA or Space-X version to the moon.
BTC dropped and moved very cautious with any strong momentum. Could it be because stock market is strong, and yield is back up? Maybe...
Personally, I need BTC to break the previous trend line in order to have full faith again (for a large bull in shorter term window, but I still have 100% faith in BTC fundamentals).
The ALT coins have seen massive gains, and strong sentiment that ALT season is still upon us (for those who wish to venture into those risky adventures).
Hedging BTC with large cap ALT coins within DeFi (UNI,Terra, Cake, etc), NFT (Theta, Chiliz, Flow, Enjin, Mana, etc) and Platform (BNB, Ada, Atom, DOT etc), would have given nice gains on both Euro and BTC front; and still believe that ALT have more room to grow
Just mentioning some to give an example, not a financial advice.
By hedging with for example 60% BTC and 40% strong ALT, you would not be that vulnerable WHEN BTC start to gain momentum again; whilst still have some nice gains from ALT coin season.
Stay safe out there and have a great time with trading, and remember to trade only what you can afford to lose and do not forget to book some profit!
BTCEUR 28 MAR 2021 1240 hrs (order block/volume)I used to think price action alone was too high risk. But I have opened my mind to price action tactics and all i can say is yes you can trade price action with a greater than 80% success rate (or better) . So credit where credit is due and apologes where apologoes are due... to the price action guys.
however.. why not use an indicator that gives you a fairly accurate estimate of the force that will likey come from that previous order block
Price has been bumping off of that supply block/supply zone. I do like the idea of calling it a block versus a zone. Price wats to clear that block before getting through it. some order blocks may not get revisited for months. Its the old look to the left of your chart basic technique.
Our job as retail is to target the order block... that is it. What we do when price arrives at that order block, wether to buy or sell will come back down to your range analysis. A pretty large advantage you gain using volume over price action alone is that you can roughly determine when the block is cleared and price is either ready to mark up or mark down.
If the order block is in a supply zone we would look for a no demand
If the order block is in a demand zone we would look for the no supply.
Bitcoin 4hr chart Potential next move.From the chart, we have just broken up from the previous All time high.
As can be seen we are about to come upon the 3 Fib level. ( This Fib level is from the beginning of trading back in 2009)
Once the 3 Fib Line is broken , its off to the extimated €61K 'ish mark before it sees any further major resistance.
Caveat , whales could come in and destroy this hypothesis by dumping coin .
On the long range plan, we could see price retrace to €40K before moving to €61K .
This is not financial advice , just my reading for the potential of an upside and downside in the short term future, (26th Mar - 02- Apr 2021)
2021.03.23 - BTC predcition 12 hoursDISCLAIMER
Please be aware that I own a diverse cryptocurrency portfolio as I want to remain open and unbiased to the cryptocurrency community. Video is for general information purposes only and not investment, legal, tax or financial advice. This video is purely opinion of the speaker who is not a licensed financial advisor or a registered investment advisor. Purchasing cryptocurrencies or cryptocurrency market in general is risky. The speaker does not guarantee any particular outcome. Past performance or success does not illustrate future results. This information is what has been publicly discovered on the Internet. This is all an opinion of my own. All material is intended for public knowledge and is public domain. Please make sure to do some research on your own when investing in cryptocurrency market. Never take the opinion of one person for financial advice. Multiple strategies exist and not all strategies suit all people.


