BTC/Euro 7/21/2020Hello and welcome to this analysis on BTC/Euro.
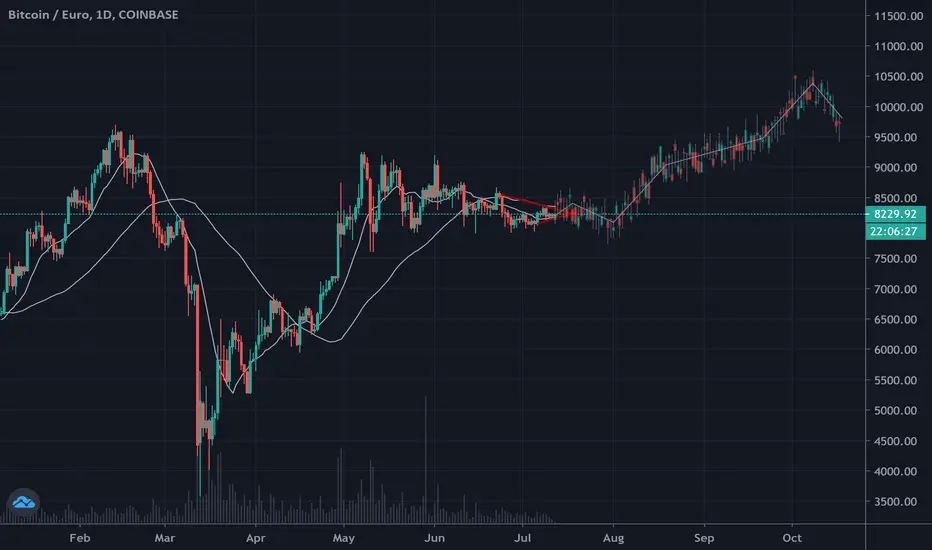
BTC has been in a very boring sideways range since the 7th of May. I choose to show the Euro pair because I believe the price action is much more visible on this pair compared to the USD pair.
Looking at the consolidation on the daily chart, the price has been making series of lower highs other than the fake-out at first of Jun that price broke above its diagonal resistant but couldn't manage to hold above it and instead it got smashed back down on high volume. looking at the bottom of the range, the price has consistently tapped the horizontal support at 7900 but each bounce from the support got shorter, and at the moment it is consolidating on the support. Support and resistance tend to become weaker the more price tests them. Also, the failure to make any higher high after almost 3 months of consolidation and resting on the support is a sign of weakness and distribution. The technical formations that I mentioned are describing a classic descending triangle which is usually a bearish pattern and can act as a topping formation. The target of the pattern is at 6660 Euro if price breaks below 7900 and don't manage to regain it back.
Looking at the volume you can see it has been falling since price topped at 9200 back at may and it has almost dried up. Also looking at the BBW at the bottom which is a volatility indicator you can see it has been going down and is resting at its historical lows at the moment. These 2 indicators are telling us that a very big move is likely to happen soon and they also confirm the deciding triangle pattern. BTC tends to trend for a while and move between 20 to 30% after it breaks 3 or more months-long consolidations while its volatility metrics are at the historical lows.
There is not any major horizontal support below the formation from 7900 till 6900. As you can see on the volume profile there is a volume gap in that price range. So the price can rapidly move down if it breaks below the formation. Also, there should be a lot of stop losses and liquidations below the support that will get triggered and push the price lower if it breaks the 7900 support.
These technical formations suggest a 15-20% drop in the price in the coming days as long as price doesn't manage to make a higher high above 9350 and break above the diagonal resistance of the formation.
Hope you enjoyed this analysis, good luck trading. :)
BTCEUR trade ideas


BTC/EUR distribution patternas we can see BTC vs EURO trap into a descending triangle as a distribution pattern for 4 months. due to this pattern and low volatility we can see, there would be a short opportunity here.
This trade idea has a 2.5 risk to reward ratio.
COINBASE:BTCEUR


BTCEUR Sitting At 8500.After rolling down on HL's, the BTCEUR is now steady at 8040.
My Analysis
In my view, something similar happened on 03 Jan '20, and if I connect that historical sequence then a bearish map shows that travels to 5000, but, 8913 is interesting .

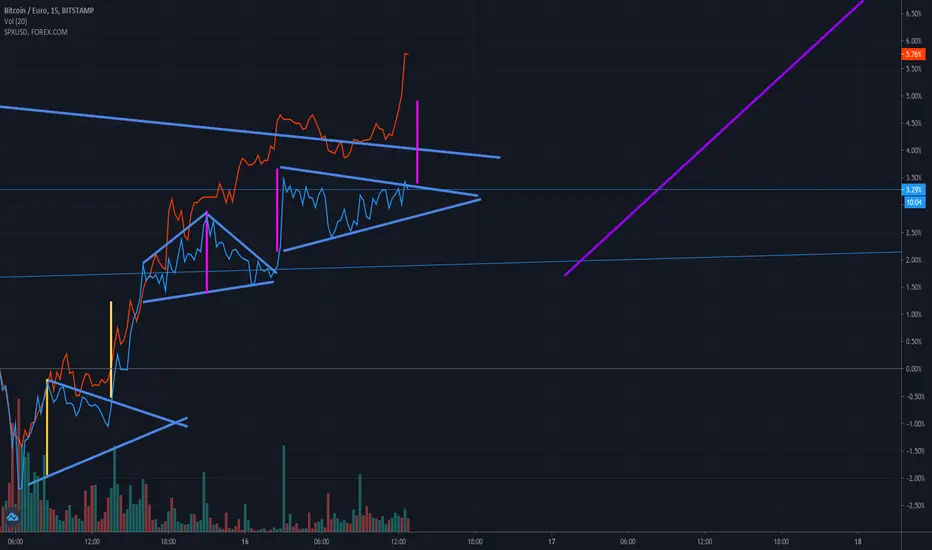
Same BTC, but different pair...Looking at things from a different view can always help!
BTCEUR is trading in a range just like BTCUSD but not as many fakeouts here and much more horizontal!
The bottom of mid-term range where BTCEUR is currently sitting (7900) can break soon since there is not much liquidity left, we may see a free fall like previous times to 5k area (6k on BTCUSD) or even lower (somewhere around 3k) if it doesn't hold.
On the bullish side, we can expect a new ATH, if BTC breaks out of the resistance zone (blue area).


BTC potential retracement sometime from the middle of Sept 2020If the pattern holds firm , we could be looking at a frice of €8k ish sometime by the middle of Sept, with a potential retracement back to a low in and around 4K , that is on the basis of BTC doing the unpredictable by shooting to the moon pefore that


BITCOIN / EUR ON DAilyhello everyone, BTC EUR on a range since May 01, may have a change of position in the coming days.

BTC ASSETT w/ BEST Performance: Covid19 Impact (5 Year) (Bitcoin as a Deflationary Asset or Inflationary Index)
note: Stock market liquidity boosted by FED Stimulus == increase Inflation
Gold Safehaven to BTC

BTC/EUR, the price is about to explode to the moon.Bitcoin to Euro is currently trading in the range market. In case we made it to the upside, that will be very bullish sign.

Bullish BTC IdeaRecent bullish run so momentum is bullish.
Rising triangle formation is bullish.
ETH and a few other cryptos also look bulish.

