BTCGBP trade ideas
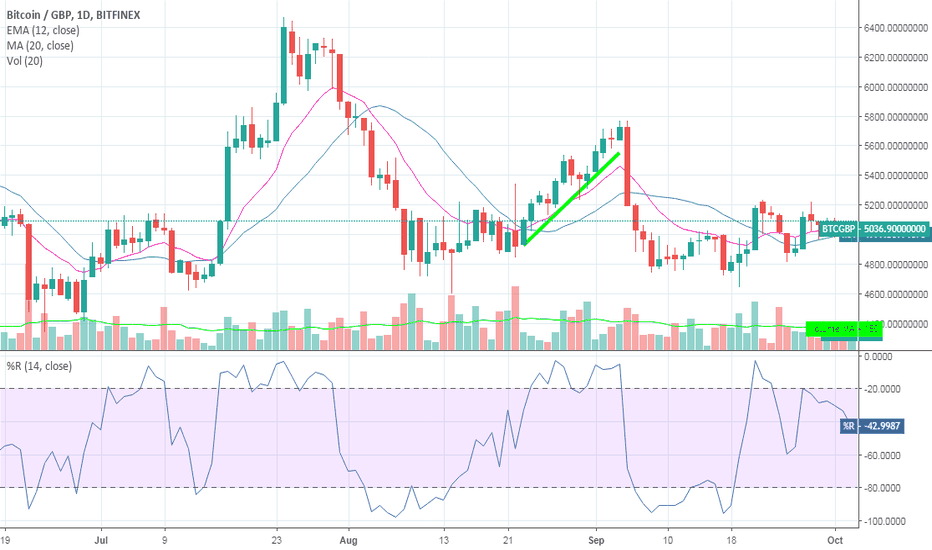
Bitcoin 1 hr following daily pattern
Bitcoin on the 1hr is interestingly matching the capitulation we saw on the daily chart.
The pattern looks remarkably similar and suggests a dip, rise, consolidation and then a break out in the green zone.
Lets see how this plays out the 1 hour suggests a rise in the green zone around 19th May.
BTC Looking to rally and complete IH&SHi One and all to my first BTC analysis of 2019. I hope you all had a wonderful new year.
Without further ado, BTC.
I have removed my IH&S pattern to aid clarity, if you want to you can go back to my previous publication to read what I had to say there about the formation.
A word before we continue though, as you will no doubt see BTC slid a little into the downside before just making a push through the trend line i have drawn here, I believe if BTC can keep this momentum we will see the formation complete.
As of writing this BTC has tested the old line of resistance and looks to be using it as support, that bounce may be used to propel BTC to test £4000 before attempting to go further.
I will continue to monitor BTC and look for conformation of this break out, or alert for a potential break out.
I am leaning more towards being bulling at this current time due to the MACD starting to curve upwards as well as the 200 MA looking healthy.
Post your thoughts and question below guys, ill answer any points you have and am always open to debate if you disagree with anything i have written here.
Remember though folks, this is not financial advice and any trades you take are at your own risk.
I, like all traders will be watching BTC and will take positions accordingly.
Stay frosty,
BTC within a chance for a inverse head and shoulders pattern.Hi all,
Been absent for a while watching whats been happening.
In my last post all those months ago I got caught up in the hype of everything. Now after taking some time away to learn and reflect on it all, im back with a fresh perspective and analysis.
A inverse H&S pattern is starting to emerge from the charts. This doesn't by it self indicate a trend reversal, it does however suggest it. Ina few days when we test the neck line we may see BTC regain some lost territory.
I doubt that will be back to the giddy highs we saw this time last year. But a swift shot up to test 4200-4350 where a small line of resistance will form, through that to meet heavy resistance at 5k. I wont estimate past that as it would be foolish.
To look for will be how BTC behaves in the next few days. If it can complete the reverse H&S we may have an opportunity to go long. Until then I would hold off and keep what you have in fiat.
Post your thoughts and question below guys, ill answer any points you have and am always open to debate if you disagree with anything i have written here.
Remember though folks, this is not financial advice and any trades you take are at your own risk.
I, like all traders will be watching BTC and will take positions accordingly.
Stay frosty,
Moglli, out.
High Probability Bounce ZoneMy current high probability bounce zone is somewhere in the box. I'm using box-entry as an eyes-on trigger. I don't intend to open a long position until I see a wave 1 candidate materialise in that zone (see bottom left for the previous)..
Justification for box bounds:
(i) Intersection of base and deceleration channels
(ii) wave A-B length parity confluence
(iii) min 50% retracement
(iv) max 78.6% retracement (considering market exuberance)
(v) Christmas insobriety ???
[BTC/GBP] Bitcoin supply & demand zones for GBP [BTFD]Greetings members and guests PLEASE hit the Thumbs Up button on the right to show some support and love ------------------------->>>>>> ^^^^^^^^ <<<<<
Comments and questions are welcomed below, please feel free to ASK anything!
HOW TO TRADE THIS CHART?
First like/thumbs up the chart then read below.....
This is a plan for GBP users looking at bitcoin prices to buy sell in the next months
use the coloured areas to get an idea of where we may bounce and rebound off
we are approaching a key area of $3k on the usd charts and want to show in different major currencies where these levels are in comparison to the leading usd charts
please leave comments below or join our BTFD trading group, we have current off to join VIP for only 0.01BTC p/m until end of 2018
disclaimer: this is for entertainment purposes only


