BTC/USD) Bullish reversal analysis Read The ChaptianSMC Trading point update
This is a bullish reversal analysis on BTC/USD (Bitcoin to USD) on the 4-hour chart, suggesting a potential long opportunity after a sharp corrective move.
---
Key Breakdown of the Chart:
1. Strong Downward Move with Potential Reversal:
Bitcoin experienced a sharp drop from the 88k region to ~74,387.50, now hitting a key demand zone (marked as "Orderblock").
2. Bullish Reaction Expected:
From the Orderblock support zone, a bullish reversal is anticipated.
The projected move aims to fill the imbalance and test the target zone between 87,152.94 and 88,557.14.
3. RSI Oversold:
RSI is around 32.27, indicating oversold conditions and adding confluence for a potential bounce.
4. EMA (200):
The 200 EMA lies around 85,153.85, which may act as dynamic resistance on the way up.
Mr SMC Trading point
5. Price Target:
The expected upside move is approximately +13,722.85 points (+18.75%), aiming for the supply zone above 87k.
---
Conclusion / Trade Idea:
Entry Zone: Near 74,387.50, the orderblock/demand area.
Target Zone: 87,152.94 – 88,557.14
Bias: Bullish short- to mid-term reversal.
Confluences: Oversold RSI, clean support zone, potential trendline bounce, and price inefficiency above.
---
Pales support boost 🚀 analysis follow)
BTCUSD.P trade ideas
BTC/USD Long Setup – Bullish Reversal PlayAfter a sharp drop, BTC is testing a key liquidity zone around 78.2k. The market structure suggests a potential bullish reversal, with a fakeout and recovery in sight.
📌 Trade Idea:
Entry: After confirmation of a reclaim and bullish structure break (above ~79.3k)
SL: Below recent low ~77.6k
TP: 82.8k zone
RRR: ~3.2
📅 Timeframe: 30min
📈 Bias: Counter-trend long
🔁 Watch for: Price reaction at current support and market structure shift
🚨 Wait for confirmation – patience is key in volatile conditions!
TC/USD Bearish Flag Breakdown Targeting 81,660 Support ZoneThis is a 1-hour BTC/USD (Bitcoin/US Dollar) chart showing a bearish setup. Here's the breakdown:
---
Key Observations:
1. Bearish Rejection Zone (Purple Box - ~83,174.62):
Price is showing rejection at a key resistance zone.
Both the 30 EMA and 200 EMA are above current price, adding downward pressure.
2. EMA Analysis:
30 EMA (Red Line): ~83,174.62 – acting as dynamic resistance.
200 EMA (Blue Line): ~83,715.92 – strong long-term resistance.
Price is below both EMAs, reinforcing bearish sentiment.
3. Pattern Analysis:
Bearish flag/wedge breakdown has already occurred.
Target projection based on measured move suggests a ~1.44% downside.
Anticipated drop towards 81,660.29, which aligns with prior support zone.
4. Price Action:
Recent breakdown from a small rising channel (bear flag).
Pullback to resistance (purple zone) seems complete, and continuation downward is expected.
---
Strategy Summary:
Bias: Bearish
Entry Zone: Near 83,174.62 (already rejected)
Target: 81,660.29
Stop Loss Idea: Above 83,715.92 (EMA 200)
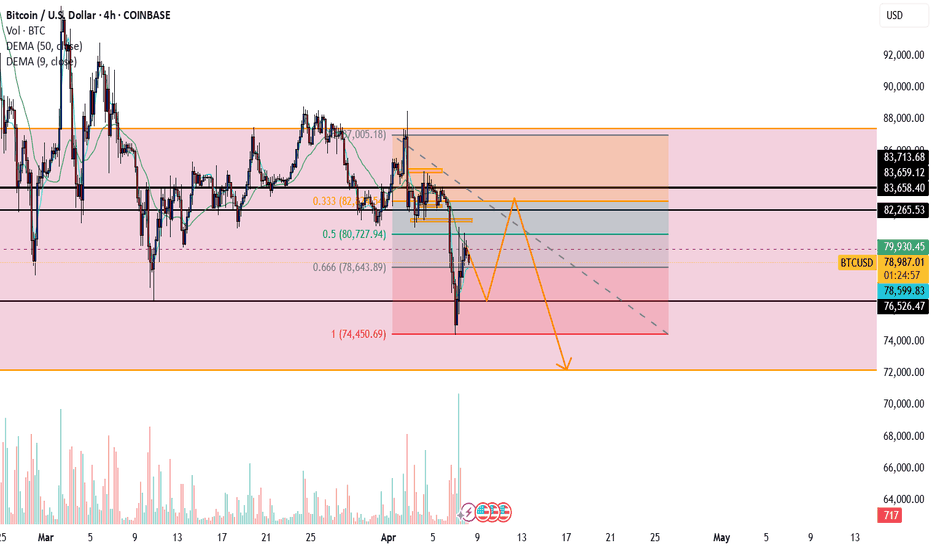
BTC SHORT TERM BEARISH
BTC/USD 5M Short Setup
Bias: Bearish (lower highs, clear structure breaks & ChoCh)
Entry: Short from premium supply zone (83,100–83,200), aligned with stacked FVGs and bearish OB
Confluences:
Multiple Fair Value Gaps (FVGs)
Change of Character (ChoCh)
Order block rejection zone
TP: 82,160 (targeting sell-side liquidity)
SL: Above 83,228 supply zone
Risk-Reward: Clean 3R+ setup
Note: Watch 82,960–82,360 for possible reaction (minor support/FVG)
BTC/USD Short Setup I have entered a short position on BTC/USD following a failed breakout and 4-hour candle close back below the key horizontal resistance level. This level also aligns with the mid-range of the recent consolidation zone. Price attempted to reclaim this level but was firmly rejected, signaling potential bearish continuation.
Entry: $81,517.95 (Rejection confirmation at resistance)
Stop Loss: $84,720.67 (Above the recent swing high and invalidation zone)
Risk Management Level: $79,552.34 (Move SL to BE once TP1 is hit)
Target Levels:
TP1: $79,552.34 – Moving SL to BE at this point to manage risk
TP2: $75,012.31
Trade Rationale:
The 4H rejection candle confirms sellers defending the resistance zone, with price unable to close back above — a signal of continuation lower within the broader range.
A clean break and retest of the ascending short-term trendline may further confirm bearish momentum.
Risk is defined above the most recent supply zone to allow space for natural price volatility.
Targets are mapped based on previous support reactions and potential liquidity pools below current levels.
Zone for a possible bounce from bitcoinProviding we get bullish divergences on the daily, 4 hr, 1 hr, and 30m RSI, we will be looking at this green box for a possible bounce. This looks like the bottom of a market maker cycle, looking for the price to come into the box forming the Peak formation low of the new cycle, recovering the imbalance from November, tapping into the Golden Pocket retracement from the previous range low to the all time high, and the bear market low to all time high .382 retracement.
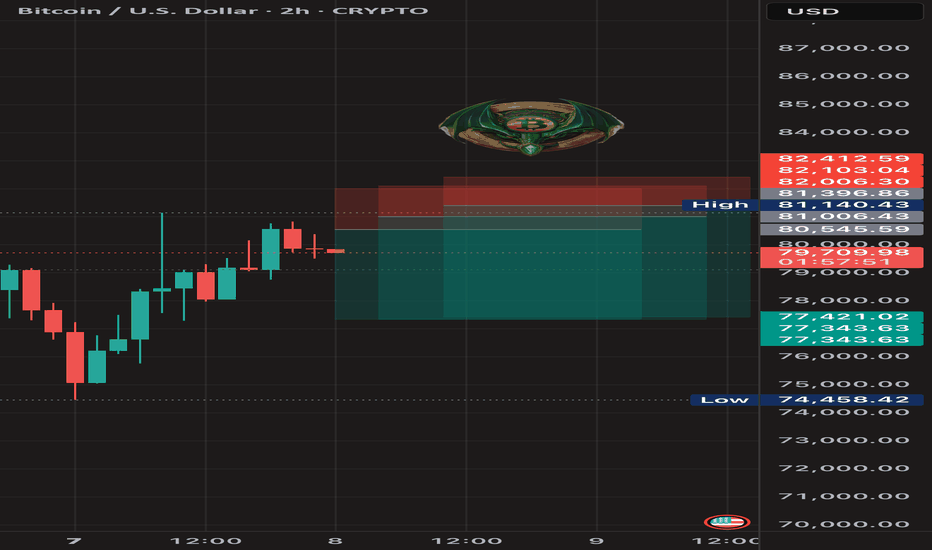
BTC SHORT TP:77,200 07-04-2025⚠️ Despite its recent recovery, Bitcoin is showing bearish patterns on the 1-hour and 2-hour timeframes. That's why I'm targeting a short at 77,300.
This analysis is based on those timeframes, so we expect it to develop in the next 12 hours; otherwise, it will be invalidated.
Follow me to stay updated and keep stacking those greens together! 💰🔥
The market is shaking. But what is Bitcoin doing?Despite today's market turmoil, the crypto world remains somewhat calm with some minor drops across the major cryptocurrencies. At the time of analysis, CRYPTO:BTCUSD is moving slightly lower, but as if it is a regular day for it.
Let's dig in!
MARKETSCOM:BITCOIN
Let us know what you think in the comments below.
Thank you.
77.3% of retail investor accounts lose money when trading CFDs with this provider. You should consider whether you understand how CFDs work and whether you can afford to take the high risk of losing your money. Past performance is not necessarily indicative of future results. The value of investments may fall as well as rise and the investor may not get back the amount initially invested. This content is not intended for nor applicable to residents of the UK. Cryptocurrency CFDs and spread bets are restricted in the UK for all retail clients.
$BTC Not Out Of The Weeds Yet - Must Break $84kIf CRYPTOCAP:BTC can break back above ~$84k then we could continue to follow my OG setup (yellow) and rip,
but since PA dumped slightly below the 50WMA it technically invalidated my inverse h & s idea.
A rejection of $84k would dump us back to ~$78k to form the right shoulder (red) and complete the setup.
nonetheless, i believe we've seen the bottom 👋
BITCOIN BEARS ARE STRONG HERE|SHORT
BITCOIN SIGNAL
Trade Direction: short
Entry Level: 83,826.61
Target Level: 79,330.33
Stop Loss: 86,817.52
RISK PROFILE
Risk level: medium
Suggested risk: 1%
Timeframe: 3h
Disclosure: I am part of Trade Nation's Influencer program and receive a monthly fee for using their TradingView charts in my analysis.
✅LIKE AND COMMENT MY IDEAS✅
Bitcoin / U.S. Dollar📌 **Chart Overview**
- **Pair:** Bitcoin / U.S. Dollar (BTCUSD)
- **Timeframe:** 1-hour chart
- **Current Price:** 81,788
- **Exchange:** BITSTAMP
---
### 📉 **Trade Setup: Bearish Reversal (Short)**
- **Resistance Level (Purple Box at Top):** ~83,300
This zone has been identified as a key **resistance area**, where price has previously reversed.
- **Support Level (Purple Box at Bottom):** ~75,160
This is the projected **target area** for the short move—also a prior demand zone.
---
### 🟪 Key Zones
- **Resistance:** Price entered and reacted to this zone with a rejection candle—often seen as a reversal signal.
- **Support:** Highlighted as a double-bottom zone where price previously bounced. It’s also marked with orange circles indicating bullish rejections.
---
### 🔄 **Pattern Insight**
- The chart shows a **potential double-top rejection** from the resistance level, followed by a sharp drop.
- The **projected path (black arrow)** suggests a corrective move down to the support zone.
---
### 🔎 Visual Highlights
- **Orange Circles** mark significant rejections at support and resistance levels—showing price behavior around these zones.
- The **red and green shaded area** likely represents the risk-reward zone of a short setup.
---
### 🧠 Summary
This is a classic **resistance-to-support trade setup**, betting on a pullback after a strong rally. The idea is that price fails to break through resistance and heads lower toward prior support.
BITCOIN Will Move Lower! Sell!
Take a look at our analysis for BITCOIN.
Time Frame: 30m
Current Trend: Bearish
Sentiment: Overbought (based on 7-period RSI)
Forecast: Bearish
The market is testing a major horizontal structure 79,880.44.
Taking into consideration the structure & trend analysis, I believe that the market will reach 78,453.18 level soon.
P.S
The term oversold refers to a condition where an asset has traded lower in price and has the potential for a price bounce.
Overbought refers to market scenarios where the instrument is traded considerably higher than its fair value. Overvaluation is caused by market sentiments when there is positive news.
Disclosure: I am part of Trade Nation's Influencer program and receive a monthly fee for using their TradingView charts in my analysis.
Like and subscribe and comment my ideas if you enjoy them!
BTC OutlookIn the volatile world of trading, uncertainty is the only constant. Could prices dip to 75k before surging to 115k? Is such a drop a brief pullback or the start of a prolonged downturn? What technical or fundamental signals might indicate a recovery toward 115k?
Disclaimer: This content is for informational purposes only and does not constitute financial advice. Always consult a professional before making any investment decisions.


