check the trendGiven the breakdown of the support trend line and the support area, it is expected that a diametric pattern will form. Accordingly, it is expected that a trend change will form within the specified support areas and we will witness the start of the upward trend.
BTCUSD.P trade ideas

CAN BTC HOLD THIS PARRALELL CHANNEL??Bitcoin has been holding this parralell channel for quite awhile now.
So it's been very bearish with money flow and bearish diverging oscillator on high timeframes.. if it breaks below the channel it could surely be the bear market until next BTC halving!


Short The price is consolidating between 89,000 and 76,500 zone. But I can see another downward move to 76,500 is developing.
Where I drew blue rectangular blocks and red vertical lines in the chart (Feb and March 2025) are the very similar set up as the current situation as follows:
1) The market creates the set up where it looks like the price is slowly recovering and pushes above EMA200.
2) The reverses aggressively to the downside (liquidity sweep).
3) The price consolidates in the very tight range.
4) Momentum indicators move into the bear zone.
I already have one small short position, but once RSI and MACD enter the bear zone and the price stays below VWAP (purple line drawn from the August 24 low) and also closes below the buy order block (green box), I will open another short position.
Stop loss - above EMA 200 in 4H chart.
Target - 76,540


BITCOIN weekly and 50 SMA - has VERY good newsAs you can easily See, despite all the unsettled News and events in recent days, the current Week candle has returned to GREEN having hit that 50 SMA.
To remind you, we began the week with a RED candle BELOW that 50 SMA.
This is Very important for sentiment. We bounced off that 50 back in 2024 and went to ATH.
To remind you, we have hit the 50 at the same time as the weekly MACD has entered a Bounce Zone, very near Neutral.
The MACD chart above shows you that the Histogram bar has also returned to White, showing a possible turn of favour from Bearish to Bullish.
BITCOIN IS SO READY TO GO
We just need the investors that are pouring money into the Snail called GOLD, to realise the Future is BITCOIN
We wait

Getting Closer Double bottoms historically lead into a IH&S - the correlation to the 2-618 FIB target with 2W RSI previous bull targets in last cycles match.

BTC/USDT Long term PatternHere we can see a clear pattern since the bulls and bears from 2014/2015 till present times.
Every bull and bear with the same amount of days. We are now in a zone of correction with a possible reverse to the upside at about 73K, although if it fails and does a correction like last bull we can see a move down to about 49K/50K.
Let's see what the future holds for us in the crypto market, but just wanted to let this pattern identification here that gives us some insight on what might happen.

Two bearish scenarios for Bitcoin:
If the downward trend continues, these two scenarios are likely.
However, if the upper resistance of the channel is broken, the trend will change.

BTC Under Pressure. More downside RiskBTC trading in a descending channel on the daily timeframe. Trade wars are weighing down equities as well as Bitcoin. Until the tariff narrative changes, expect further downside with BTC.
Trade Safe - Trade Well. DM for account management
~Michael Harding

Bitcoin ready for a Bullish Broadening Wedge Breakout! Bitcoin is in a bullish broadening wedge pattern!
Bitcoin tested key diagonal trendline support (on log scale) as marked by yellow arrows!
Trump's inauguration on January 20th, 2025, marked the local top, and now I expect the Trump tariff day event on April 2nd, 2025, to mark the local bottom, which can lead to a massive move to the upside in the coming weeks and months!
I overlaid the Sept 2023 breakout fractal to show how bullish breakouts can lead to the fib targets near the yellow magnets on chart in the coming months! COINBASE:BTCUSD

BTC - Slight Distribution After Nearly 10xMorning my fellow traders, and happy new year!
I hope you do not have a hangover right now. But if you do, get a tea going, it usually does the trick for me!
I can't deny the possibilities for another rally to take out the highs, but I'm thinking what the market makers are planning is a simple inverted Adam & Eve pattern that will lead us to new opportunities within the next month or so.
Keep in mind that for sometime now Alts have not been giving, and I believe that after this next Alt season (which I believe we will still get), they will keep giving less and less.
I sold near $100k for probably a couple weeks now. Did not get a perfect $108k sale, which is fine. Now I'll focus on a reentry if this plays out.
Trade thirsty, my friends!

Bitcoin continues to fallBitcoin has broken its 3-year channel downwards, marking the start of a major correction on the 1-day timeframe

Bitcoin’s Doom: The Collapse Has Begun 50K comingBitcoin is on the verge of a catastrophic collapse, and the monthly chart confirms it. We have officially topped out, signaling the beginning of the 2025 bear market. The so-called “dumb money” is now holding onto their sinking bags, while the smart money has long since exited.
-RSI is trending downward, confirming exhaustion.
-The bull market is officially over.
-A steep decline to $50,000 and below is inevitable.
This is not just another correction—it’s the start of Bitcoin’s terminal decline. The dream of $100K has failed, and reality is setting in. As quantum computing advances and error rates decrease, Bitcoin’s encryption will be broken, rendering it obsolete and worthless.
The pet rock is sinking, and soon the crypto bubble will implode in spectacular fashion. The crash is not just coming—it’s already here.
Prepare for the reckoning. 🔥

Bitcoin Super RecessionI beleive Bitcoin will face a totally 53% drop from its all time high after US Recession will start during this year.
Mark my words last time we had a collapse on crypto in 2022 i predicted this time is easier due to financial incertenity

Bitcoin vs. Nasdaq: BTC Shows Signs of Decoupling Amid US Stock
For years, the narrative surrounding Bitcoin’s price action has been inextricably linked to the performance of traditional financial markets, particularly the tech-heavy Nasdaq Composite. Often moving in lockstep, Bitcoin was viewed by many as a high-beta asset, amplifying the gains during bullish periods and suffering even steeper losses when risk sentiment soured in equities. However, recent market movements have sparked a crucial question among investors and analysts alike: is Bitcoin finally beginning to forge its own path, decoupling from the gravitational pull of U.S. stocks as they face mounting headwinds?
The past few weeks have witnessed a notable divergence. While U.S. stock markets, reeling from a confluence of factors including escalating geopolitical tensions stemming from a potential “Trump tariff war,” persistent inflation concerns highlighted by Federal Reserve Chair Jerome Powell’s hawkish warnings of “higher inflation and slower growth,” and broader macroeconomic anxieties, have experienced a significant downturn – shedding a staggering $3.5 trillion in value – Bitcoin has demonstrated a surprising degree of resilience, even posting gains in some instances. This nascent divergence has ignited a wave of optimism among Bitcoin proponents who have long yearned for the digital asset to be recognized and traded based on its own fundamental merits, rather than as a mere proxy for risk-on sentiment in the equity markets.
The concept of Bitcoin decoupling from traditional assets has been a recurring theme in the cryptocurrency space. The original thesis for Bitcoin, after all, positioned it as a decentralized, censorship-resistant store of value and a hedge against traditional financial system vulnerabilities. Its finite supply, its independence from central banks and government policies, and its inherent scarcity were touted as key differentiators that would eventually lead it to trade independently. However, the reality of the past few years has often painted a different picture, with institutional adoption bringing increased correlation with established asset classes.
The current shift, however tentative, offers a glimmer of hope for those who believe in Bitcoin’s unique value proposition. The factors contributing to the stock market slump – trade war anxieties, inflation fears, and the prospect of tighter monetary policy – arguably strengthen the case for Bitcoin as an alternative asset. In times of economic uncertainty and currency debasement concerns, the fixed supply and decentralized nature of Bitcoin could become increasingly attractive to investors seeking a safe haven outside the traditional financial system.
Furthermore, the increasing maturity of the Bitcoin market, with the development of more sophisticated trading instruments, greater institutional participation, and a deeper understanding of its underlying technology, may be contributing to its growing independence. As Bitcoin gains broader acceptance as a legitimate asset class, its price discovery mechanisms may become less reliant on the sentiment driving traditional equity markets.
However, it is crucial to approach this apparent decoupling with a degree of caution. While the recent divergence is encouraging for Bitcoin bulls, it is too early to definitively declare the long-awaited break has finally arrived. Market correlations can be fluid and influenced by a multitude of factors. A sudden shift in global risk sentiment or a significant negative event specific to the cryptocurrency space could easily re-establish the link between Bitcoin and traditional assets.
Adding a layer of complexity to the current narrative is the warning from some analysts regarding a potential Bitcoin price correction. Despite the recent resilience, multiple BTC price forecasting models have pointed towards a scenario where Bitcoin could fall back to its 2021 all-time high of around $70,000 in a relatively short timeframe – some even suggesting this could occur within the next ten days. This potential “crash risk,” as one analyst termed it, is attributed to various technical and market cycle indicators.
The notion that $70,000 could represent Bitcoin’s “practical bottom,” as suggested by some, highlights the inherent volatility and speculative nature of the cryptocurrency market. Even if Bitcoin is beginning to decouple from traditional equities, it remains susceptible to its own unique set of risks and price swings. Factors such as regulatory developments, network security concerns, and shifts in investor sentiment within the crypto space can still exert significant influence on its price.
Therefore, while the current divergence between Bitcoin and the struggling U.S. stock market offers a compelling narrative and fuels the hopes of long-term Bitcoin holders, it is essential to maintain a balanced perspective. The confluence of factors driving the stock market decline could indeed be creating an environment where Bitcoin’s unique characteristics become more appealing, leading to a sustained period of independent price action. However, the inherent volatility of the cryptocurrency market and the potential for a significant correction remind investors that the journey towards true decoupling is likely to be a complex and potentially bumpy one.
In conclusion, the recent market dynamics present a fascinating juncture for Bitcoin. The initial signs of decoupling from the crumbling U.S. stock market, driven by a confluence of macroeconomic anxieties and the potential for Bitcoin to act as an alternative store of value, are undeniably encouraging for those who believe in its long-term potential. However, the warnings of a potential price correction underscore the inherent risks within the cryptocurrency space. Whether this nascent decoupling marks a definitive shift in Bitcoin's market behavior or proves to be a temporary divergence remains to be seen. Investors would be wise to monitor these trends closely, remaining cognizant of both the potential for independent growth and the ever-present risks associated with this dynamic and evolving asset class. The coming weeks and months will be crucial in determining whether Bitcoin can truly forge its own path in the face of traditional market turmoil.

BTCUSD Analysis Today: Technical and On-Chain !In this video, I will share my BTCUSD analysis by providing my complete technical and on-chain insights, so you can watch it to improve your crypto trading skillset. The video is structured in 4 parts, first I will be performing my complete technical analysis, then I will be moving to the on-chain data analysis, then I will be moving to the liquidation maps analysis and lastly, I will be putting together these 3 different types of analysis.

* BTC bullish and bearish scenarios explained! *Hello Degenerates,
In this video, I tried to explain my bull and bear scenarios while highlighting that EVEN MY BEAR SCENARIO IS BULLISH!
Take some time to watch it if you want, and share your thoughts!
Thank you!

BTC/USD 30Min PairMY looking at a potential short-term trade setup for Bitcoin:
Buy Entry: $84,500
Target: $87,000
Potential Gain: $2,500 per BTC (~2.96%)
Make sure to consider:
Stop Loss: Important to define—perhaps around $83,000 to manage risk?
Volume/Trend Confirmation: Is price action supporting upward momentum?
News/Events: Check if any macro or crypto-specific events could impact price soon.
Want help with chart analysis or setting up a full trade plan?

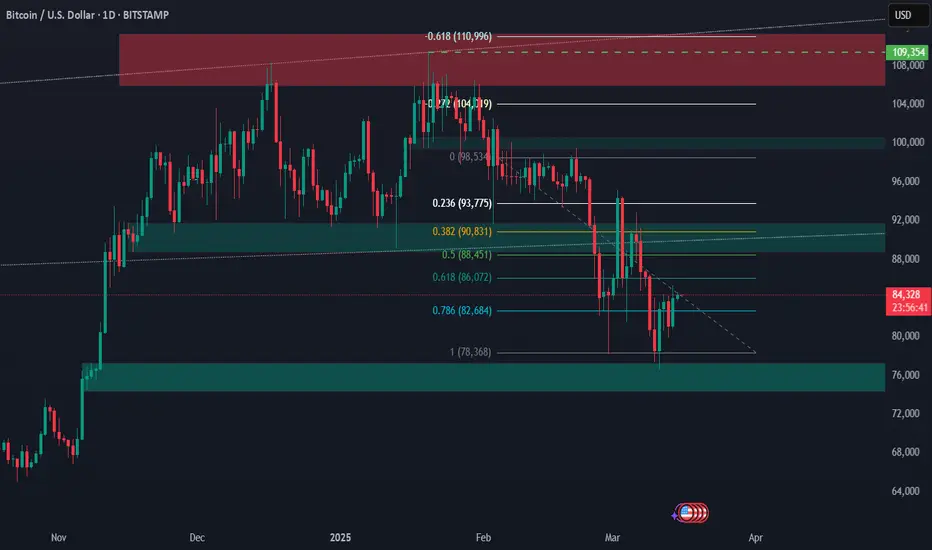
Bitcoin Daily ChartBitcoin Sits below 0.618 on the fib chart there is a good chance that it will break this level then retest again before moving towards 86k then 90k.
Observation : this could be over the next few weeks due to the Tariffs/Inflation coming out of the USA with a combination of unrest around the world. Meaning that investors are seeking safe haven until there is confidence to reinvest in the Bitcoin.
Conclusion: its better to take long shorts /also short shorts were available towards support and Resistance Levels as it appears Bitcoin is ranging between Levels until the Markets settles from all the Volatility .
Disclaimer: In no way is this Financial advice for trading. trading is a RISK individuals and are at all times responsible any and all trades they engage in.
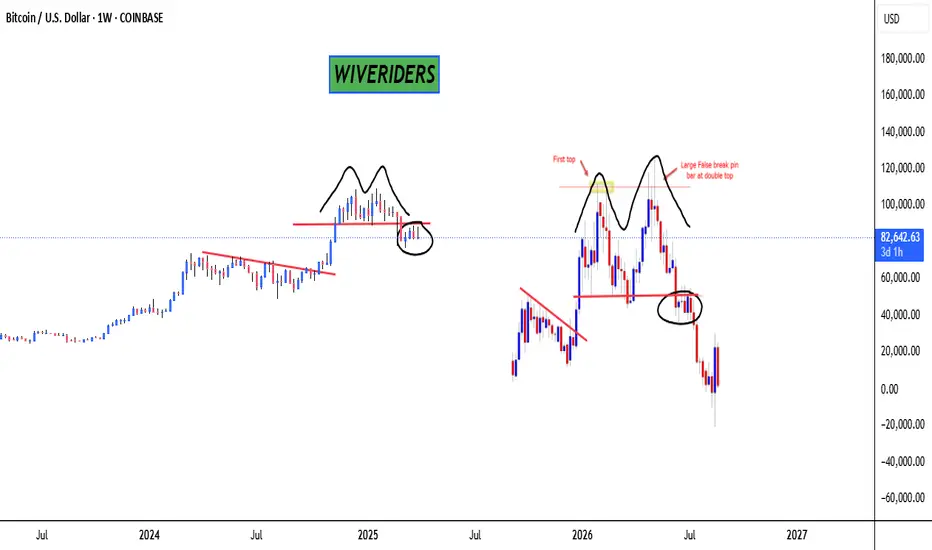
BTC Weekly Chart Update📉 CRYPTOCAP:BTC Weekly Chart Update
It looks like a double top pattern is clearly forming on the BTC weekly chart — and honestly, doesn't it remind you of a similar structure we’ve seen before? 👀
Patterns like these often signal potential trend reversals, so this is definitely a chart to watch closely.
Do you see the similarity with the previous one? Let me know your thoughts in the comments 👇
🔴 Bearish scenario could continue unless we break above key resistance.
BITCOIN Do you really want to miss this rally???Bitcoin / BTCUSD remains supported by the 1week MA50 just like it has been through the whole 2020/21 period after the COVID crash.
In spite of the massive bearish pressure of the polical developments (tariffs), the fact that the market is holding the 1week MA50, means that it is respective Bitcoin's Cycles.
In fact this is like the May-June 2021 accumulation on the 1week MA50, following the first Bitcoin Top of April 2021.
Similarly, we've had a peak formation in December 2024- January 2025 and the market corrected.
In addition to that, the 1week RSI is testing the 42.00, which isn't just where the August 2024 and September 2023 bottoms were priced, but more importantly the June 2021 one.
The symmetry between the last two Cycles is uncanny, both trading inside the long term Channel Up, with identical Bear Cycle and (so far) Bull Cycle ranges.
If all ends up repeating themselves, expect a value of at least $160000 by September.
Follow us, like the idea and leave a comment below!!

Bitcoin Inverse Cup & HandleBTC/USD 1D Chart
Bitcoin is showing a potential Inverse Cup & Handle pattern—a bearish continuation structure.
The “handle” recently broke down, and the measured move from the cup formation points to a projected target near $44,300.
Structure looks clean. If it plays out, we could be looking at a major move lower.
⚠️ Not financial advice. Do your own research.
