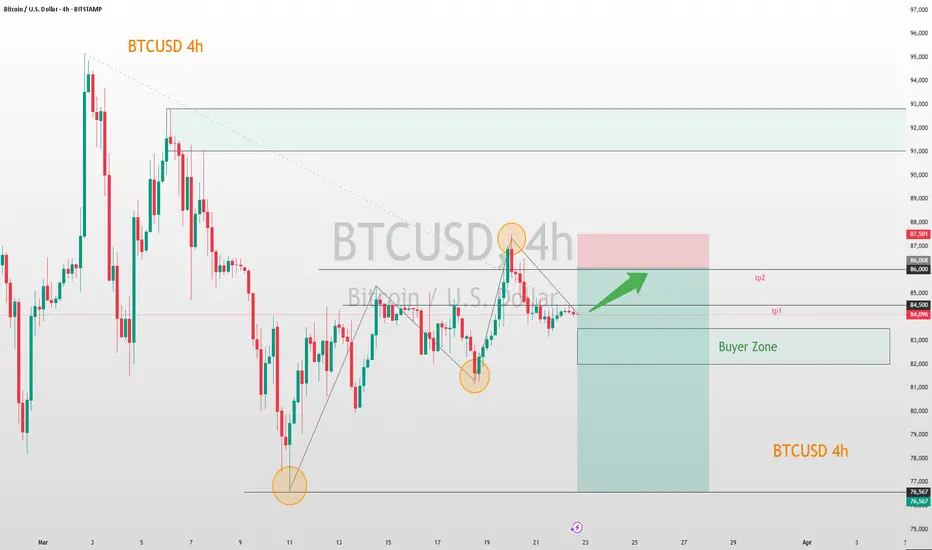
BTCUSD - Consolidation Likely to Resolve with Bullish BreakoutThe Bitcoin/USD 4-hour chart displays a consolidation pattern after recovering from the March lows near $77,000, with current price action hovering around $83,928. Following a recent test of resistance at $86,500, a minor pullback appears to be underway, but the higher probability move remains to the upside as indicated by the directional arrows on the chart. The price has been forming a series of higher lows since the March 11 bottom, suggesting accumulation and underlying bullish momentum. Key to this outlook is the strong support established by the blue reaction zone near $76,000-$78,000, which has successfully contained selling pressure. Traders should monitor for a potential shallow retracement before the anticipated push toward the orange resistance level at $87,650, which represents the next significant hurdle. A decisive break above this resistance would likely trigger an acceleration in buying momentum and confirm the bullish scenario, potentially opening the path toward retesting the $90,000-$92,000 region in the coming sessions.
Disclosure: I am part of Trade Nation's Influencer program and receive a monthly fee for using their TradingView charts in my analysis.
BTCUSD.P trade ideas

BTC Today's strategyToday, the price of bitcoin fluctuates between 84K-84.5K, and in the current complex cryptocurrency market environment, this price level is at the key node of the long and short power game, and the resistance point of 85K and the support point of 83K have become an important reference indicator affecting its short-term trend.
The strategy of selling high and buying low is adopted in the 84K-85K range
Our investment strategy has achieved significant returns in the past two weeks. If you also want to double your capital, you can click on my link to get my trading strategy

BTCUSD A Fall Expected! SELL!
My dear friends,
Please, find my technical outlook for BTCUSD below:
The instrument tests an important psychological level 84765
Bias - Bearish
Technical Indicators: Supper Trend gives a precise Bearish signal, while Pivot Point HL predicts price changes and potential reversals in the market.
Target - 84317
About Used Indicators:
Super-trend indicator is more useful in trending markets where there are clear uptrends and downtrends in price.
———————————
WISH YOU ALL LUCK

The momentum of BTC indicates its short-term potentialThe BTC/USD price is currently in a consolidation phase within a specific range.
Pay close attention to the 82,000 - 83,000 zone. Should the price retrace to this area and demonstrate signs of support, it could be a viable opportunity to initiate a small long position.
Set the target take - profit levels between 84,500 and 86,000. When the price reaches 84,500, it is advisable to consider partially closing the position to secure some profits. If it manages to break through this level, the subsequent target will be 86,000.
Considering the extreme volatility characteristic of the crypto market, prudent management of position size is of utmost importance. It's essential to refrain from overtrading to safeguard your investment capital.
BTCUSD
buy@82000-83500
tp:84500-86000
I will share trading signals every day. All the signals have been accurate for a whole month in a row. If you also need them, please click on the link below the article to obtain them.
BTC Buy SETUP for todayThis is a BTCUSD buy setup with ENTRY< STOP LOSS TAKE PROFITS LEVES for today 23 of March 2025

BTCUSD UPWARD TREND UPCOMING READ IN CAPTIONS BULLISHThe chart shows Bitcoin (BTC/USD) on a 1-hour timeframe, displaying a clear bearish channel with an expected reversal towards higher levels. Here’s the detailed analysis:
Key Observations:
1. Bearish Channel: The price is currently inside a bearish channel marked by blue trendlines, where the price has been making lower highs and lower lows. This indicates that the current trend is bearish, but there are signs of a possible reversal at certain levels.
2. FVG (Fair Value Gap): The FVG (Fair Value Gap) zone is marked just above the support, suggesting an area of imbalance in market orders. The price is expected to fill this gap before continuing its bullish move. If the price stays above this gap, it could act as a support level.
3. Order Block: An order block is indicated at the top of the chart, suggesting that the price could potentially face resistance in this area. If the price manages to break through the resistance at this level, the bullish momentum could intensify.
4. Target: The target is set at 86,134, which is just above the current price level. If the price manages to break through the upper boundary of the channel and fill the FVG, it could move toward this target.5. Price Action: The price is currently bouncing around the FVG area, indicating that buyers may step in here, creating a potential opportunity to go long. The next step is to watch for a breakout above the resistance zone to confirm the continuation of the bullish move toward the target.
Conclusion:
The chart suggests that Bitcoin is currently in a bearish channel but could soon reverse if the price holds above the FVG zone around 84,100. A bullish breakout above the order block would likely lead to an upward movement, with the target at 86,134 in sight. Traders should monitor price action around the FVG gap and the order block for potential entry points.

Venus Cazimi : BTC (historical dates)🖤 Venus governs currency, resources, desire, art, and collective values. During Cazimi Venus is “in the throne room” of the Sun
🖤 Venus Cazimi acts like a cosmic software update—the perfect time to embed intentions into the collective astral matrix. In darker practices, they may deliberately invert Venus’s frequencies.
🖤 Financial systems often see synchronistic pivots near Venus Cazimi windows due to occult knowledge of Venus’s rulership over material and sensual realms.

Bitcoin (BTCUSD) is showing stability around $83,914, indicatingBitcoin (BTCUSD) is showing stability around $83,914, indicating a potential bullish move. In this setup:
✅ Entry: $84,009 (after confirmation)
🎯 Take Profit 1: $86,000
🎯 Take Profit 2: $88,000
🛑 Stop Loss: $81,000
Analysis: If the price breaks above $84,009, it may continue upward, targeting $86,000 and $88,000. The $81,000 support level acts as a strong stop-loss point.
🚀 Risk-Reward Ratio: Maintain proper risk management!
#Bitcoin #Crypto #Trading #BTC #PriceAction #CryptoSignals

Bitcoin ROADMAP I think there is one more push to the downside, flash out everyone and then get back up .
Bitcoin is not dead , altcoins are not dead , the sentiment is dead which can easily change in a single weekly green GIGA candle .
Optimistic for what is coming up , i dont think the bull run will end without an altseason .


BITCOINT WILL SHOCK EVERYONE. The clouds have gathered. Weekly FVG tested and a reversal at this zone is imminent. It will shatter the weak high on its way to 120000.

BTC sell setup on H1. 1:5 RRCurrently, we have a breakout buy on the Daily, and the price is doing a pullback towards the demand zone, there's still some down move left before the price really shoots up..lets say we hit this TP, u can then look for a buy structure to follow the daily direction and clear the previous daily breakout high.

BTC Today's strategyToday, BTC still fluctuates within our marked range, and the strategy of selling high and buying low still works
Today's BTC trading strategy:
btcusdt buy@83K-84K
tp:85K-86K
There are risks in trading. If you are not sure about the timing, it is best to leave me a message. This will better confirm the timing of the transaction, It can also better expand profits and reduce losses

Unveiling Crypto Market Insights - Wen PumpGM, Bitstampers!
In today’s update, we’re diving into Bitcoin’s recent price action, analyzing its current trend, and identifying key support and resistance levels .
Bitcoin Market Commentary
Bitcoin reached a new all-time high (ATH) of $109.4K on January 20, 2025, on Bitstamp. Since then, the price has been in a sustained downtrend, marking 50 consecutive days without a meaningful trend reversal.
On March 9, BTC broke below the 200-day simple moving average (SMA) and had repeatedly failed to reclaim it—until yesterday, when it made a conclusive close above it, indicating a potential trend reversal.
We’re closely watching key support and resistance levels:
March 11 low – Bitcoin touched 76K, and established short-term support.
Next major support – Around 73K, aligning with the March 2024 high. A drop to this level would mark a >30% correction from ATH.
With Bitcoin reclaiming the 200-day SMA, indicating a potential trend reversal, levels around 90K could act as an important line of resistance.
If Bitcoin bottomed on March 11, that would mark an almost 30% correction lasting 50 days.
What’s next for Bitcoin? Has it bottomed, or is further downside in play? When do you think Bitcoin will trade above 100K again? Share your thoughts in the comments!

$BTC quiet before the storm?Bitcoin looks bear flaggy / rising wedge. Trading range getting tighter which normally is followed by an explosive move. I'm guessing it will be to the downside with a target of appx. 74k. I could also see it overshooting and then retaking the key area.

BITCOIN Is Very Bullish! Long!
Take a look at our analysis for BITCOIN.
Time Frame: 9h
Current Trend: Bullish
Sentiment: Oversold (based on 7-period RSI)
Forecast: Bullish
The market is testing a major horizontal structure 84,125.
Taking into consideration the structure & trend analysis, I believe that the market will reach 90,061 level soon.
P.S
The term oversold refers to a condition where an asset has traded lower in price and has the potential for a price bounce.
Overbought refers to market scenarios where the instrument is traded considerably higher than its fair value. Overvaluation is caused by market sentiments when there is positive news.
Disclosure: I am part of Trade Nation's Influencer program and receive a monthly fee for using their TradingView charts in my analysis.
Like and subscribe and comment my ideas if you enjoy them!

"Bitcoin Price Analysis: Short Trade Setup with Key Levels"### **Bitcoin Price Analysis Chart (BTC/USD - 4H Timeframe)**
This chart presents a **bearish trade setup** for Bitcoin (BTC/USD) based on technical analysis. The key levels and trade plan are as follows:
### **📌 Key Levels:**
- **Entry Level:** **$86,790** – The proposed short entry point, suggesting that BTC may face resistance around this level.
- **Stop Loss (SL):** **$88,500** – If BTC moves beyond this level, the trade would be invalidated, as it would indicate a bullish breakout.
- **Target:** **$78,500** – A strong support zone where the price is expected to decline if the trade plays out correctly.
### **🔻 Bearish Trade Scenario:**
1. Price is expected to approach the **resistance zone (~$86,790 - $88,500)** before rejecting downward.
2. A potential **double rejection** at resistance before a decline toward the support at **$78,500**.
3. The price could consolidate slightly before breaking downward, confirming the short position.
### **📊 Trade Plan:**
✅ **Short Entry:** Near $86,790 (wait for confirmation).
✅ **Stop Loss:** Above $88,500 to limit risk.
✅ **Profit Target:** $78,500 for a strong risk-to-reward trade.

BTC.DAILY.22.3.2025BTC.DAILY.22.3.2025
Over the past few days, BTC has continued its correction on the H4 timeframe as part of its bottoming process. That bottom appears to have been completed, and BTC is now moving into another upward leg.
This Saturday and Sunday, BTC is expected to push up toward the 88k–91k zone. The speed of this move will depend on overall market dynamics, but the 88k–91k range is a key area to watch for a potential continuation of the downtrend on the D1 timeframe.
The plan:
Short-term scalping on BTC in the LONG direction
Simultaneously wait for a solid SHORT entry point to swing back down to the 72k zone
Time to bite into BTC, folks.
Good luck out there.

SHORT POTENTIAL Price hit majpr Resistance area with a retest resulting in selling.
Potentially i see price continuing downtrend to 83k before and reversal

BTC IMF Tracking, Liquidation Frenzy, and Market PredictionsBitcoin's recent price action has been a rollercoaster, marked by significant gains, dramatic liquidations, and a confluence of macroeconomic factors that are shaping its trajectory. From the International Monetary Fund (IMF) officially tracking Bitcoin in cross-border finance to speculative predictions of a potential $87,000 surge, the cryptocurrency remains a focal point of intense market scrutiny.
One of the most noteworthy developments is the IMF's increasing recognition of Bitcoin's role in global finance. While the IMF previously issued warnings to El Salvador regarding its Bitcoin adoption, its decision to now track Bitcoin in cross-border financial flows signals a tacit acknowledgment of the cryptocurrency's growing significance. This shift reflects a broader trend of institutions grappling with the reality of digital assets, forcing them to incorporate these assets into their analytical frameworks.
Simultaneously, the Bitcoin market has witnessed a surge towards the $87,000 mark, triggering a wave of short liquidations. This phenomenon occurs when traders who have bet against Bitcoin's price are forced to close their positions at a loss as the price rises. The sheer magnitude of these liquidations, exceeding $110 million in a short period, underscores the volatility and the inherent risks associated with leveraged trading in the cryptocurrency market. The total market liquidations surpassing $200,000 in 24 hours only highlights the dramatic price swings and the vulnerability of short positions.
Adding to the complexity of the market dynamics is the emergence of another CME gap in the $84,000–$85,000 range. Historically, these gaps, which represent discrepancies between trading prices on the Chicago Mercantile Exchange (CME) and other exchanges, tend to be filled, suggesting a potential pullback in Bitcoin's price. This pattern creates a sense of uncertainty, with traders weighing the potential for further gains against the possibility of a corrective downturn.
Furthermore, the surge in Bitcoin open future bets on Binance, with an increase of $600 million, indicates heightened price volatility. Open interest, which measures the total number of outstanding futures contracts, often correlates with price movements. A rise in open interest alongside a price increase typically confirms an uptrend, but it also signals the potential for sharp price swings as more capital enters the market.
Market analysts are divided on Bitcoin's future trajectory. Some predict a "brutal bleed lower," while others foresee a break towards new all-time highs in the second quarter. The critical level to watch is $93,000. If Bitcoin can reclaim this level as support, it would significantly reduce the risk of a fresh collapse. However, until this threshold is breached, the market remains vulnerable to downward pressure.
On a more positive note, the S&P 500's reclamation of its 200-day moving average provides a potential tailwind for Bitcoin. This technical breakout in equities, coupled with similar signals in the cryptocurrency market, could indicate renewed bullish momentum. The correlation between traditional financial markets and Bitcoin has become increasingly apparent, with positive developments in equities often translating to positive sentiment in the crypto space.
Adding another layer to the narrative is the potential softening of the stance on reciprocal tariffs by Donald Trump. Some analysts see this development as a potential catalyst for a Bitcoin bottom. Any relaxation of trade tensions could boost investor confidence and create a more favorable environment for risk assets, including cryptocurrencies.
Finally, the concept of tokenized US gold reserves, as proposed by NYDIG, presents an intriguing long-term prospect for Bitcoin. While gold and Bitcoin are fundamentally different assets, the tokenization of gold on a blockchain could enhance the overall legitimacy and infrastructure of digital assets. This increased institutional acceptance could indirectly benefit Bitcoin by further integrating blockchain technology into mainstream finance.
In conclusion, Bitcoin's current market landscape is characterized by a blend of institutional recognition, intense trading activity, and speculative predictions. The IMF's tracking of Bitcoin in cross-border finance underscores its growing relevance, while the liquidation frenzy and CME gap highlight the inherent volatility of the cryptocurrency market. The interplay of macroeconomic factors, technical indicators, and speculative sentiment will continue to shape Bitcoin's trajectory, making it a fascinating asset to watch in the coming months.

99% chance BTC is headed to this exact spot*99% in my mind which can mean 1% in someone else's. That being said, I invite you to watch this video and then tell me where I'm mistaken...
Hope to see you there soon!!!
Happy trading all :)

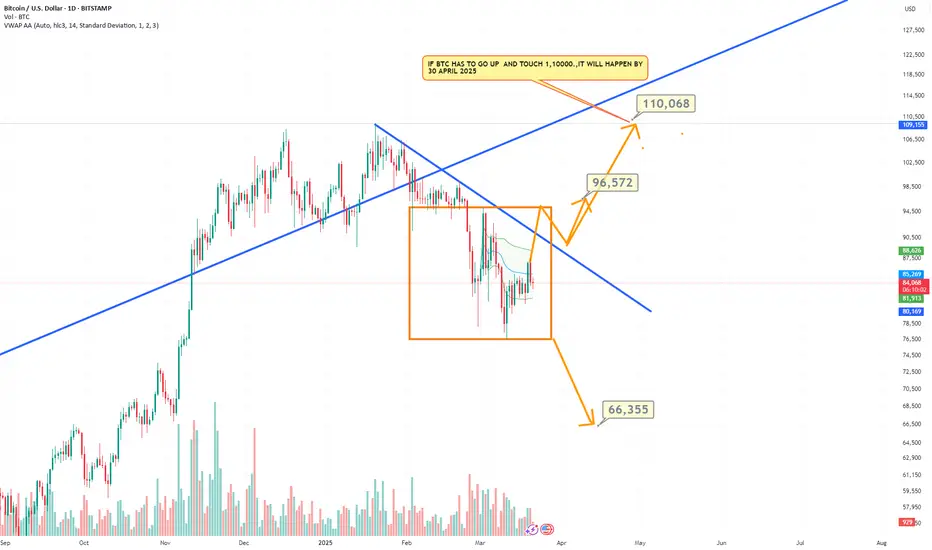
BITCOIN ...Probably pathMostly,,Till next week it should stay 96 and 76k....till 28 mar...(sell outside this call options above 96k for 28 mar)..stop is 96 k....Also please note I have marked movement for april first week.and 2nd week..once the box level of 96 and 76 k breaks...it will go to the tgts marked on the chart...up as well as down..Most probably it will go Max to 96k and come down....anyway thats later ..but first thing first ..sell any calls above 110 k to be safe mar 28 ..
Another yearly view updateMonthly candles on a yearly scales where each color of a number represents green/red year.
Here you can notice how BTC managed to still move withing cycles. Will the 3rd green year play out ?
