Bitcoin programmed bubble sine wave theory chartYear 2000 dot com bubble burst
Gold CRE 2000-2011
Bitcoin created for and succeeded in the Tech stock bull run CRE 2011-now
CRE upon us, gold bull market decade, tech/stocks crash a decade
So market to decide, is bitcoin "tech" , or digital "gold"
BTCUSD.P trade ideas

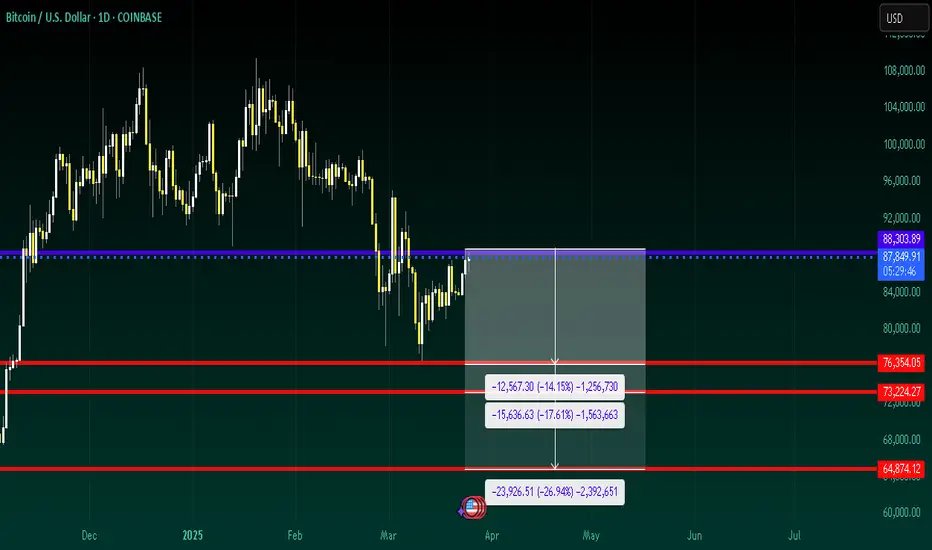
BITCOIN SHORT FORECAST Q2 FY25im expecting price to reject my point of resistance and drive down lower to the price levels in red
it did make a nice set of higher highs but didnt break any structure on the daily you notice that the structure leading to my
resistance has gotten shorter indicating weakness (clearer on h4)
i made a post on the short as it hit 102k im just insighting
more shorts ahead when reversal idk
last post
dont miss the 500 follower giveaway
LONG ON BITCOIN BTC/USDBitcoin has changed structure from down to up on the 4hr TF.
It is slowly but surely rising. I am looking to buy bitcoin as I believe this is the beginning of its turn around. At least to the next level of resistance.

Could the Bitcoin bounce from here?The price is falling towards the pivot which acts as a pullback support and could bounce to the 1st resistance which has been identified as a pullback resistance.
Pivot:85,975.56
1st Support: 83,546.45
1st Resistance: 89,692.83
Risk Warning:
Trading Forex and CFDs carries a high level of risk to your capital and you should only trade with money you can afford to lose. Trading Forex and CFDs may not be suitable for all investors, so please ensure that you fully understand the risks involved and seek independent advice if necessary.
Disclaimer:
The above opinions given constitute general market commentary, and do not constitute the opinion or advice of IC Markets or any form of personal or investment advice.
Any opinions, news, research, analyses, prices, other information, or links to third-party sites contained on this website are provided on an "as-is" basis, are intended only to be informative, is not an advice nor a recommendation, nor research, or a record of our trading prices, or an offer of, or solicitation for a transaction in any financial instrument and thus should not be treated as such. The information provided does not involve any specific investment objectives, financial situation and needs of any specific person who may receive it. Please be aware, that past performance is not a reliable indicator of future performance and/or results. Past Performance or Forward-looking scenarios based upon the reasonable beliefs of the third-party provider are not a guarantee of future performance. Actual results may differ materially from those anticipated in forward-looking or past performance statements. IC Markets makes no representation or warranty and assumes no liability as to the accuracy or completeness of the information provided, nor any loss arising from any investment based on a recommendation, forecast or any information supplied by any third-party.

BITCOIN Is Going Down! Sell!
Here is our detailed technical review for BITCOIN.
Time Frame: 4h
Current Trend: Bearish
Sentiment: Overbought (based on 7-period RSI)
Forecast: Bearish
The market is trading around a solid horizontal structure 83,714.88.
The above observations make me that the market will inevitably achieve 81,433.62 level.
P.S
Please, note that an oversold/overbought condition can last for a long time, and therefore being oversold/overbought doesn't mean a price rally will come soon, or at all.
Disclosure: I am part of Trade Nation's Influencer program and receive a monthly fee for using their TradingView charts in my analysis.
Like and subscribe and comment my ideas if you enjoy them!

Intra-day Price Action: Bearish Triangle Formation ?Hello Traders,
On the 4 hour time frame, Bitcoin is likely to developed a bearish triangle pennant, a continuation pattern that suggests further downside. Within this formation, lower highs are stacking up, meaning traders’ stop losses are accumulating above the resistance. This creates a liquidity zone, which could be tapped before a breakdown occurs.
The pennant has an apex zone, the point where dynamic support and resistance converge. This suggests price will soon make a decisive move. If Bitcoin breaks down from the pennant with strong volume, the next technical target is around $69,470, aligning with the measured move of the formation. However, if Bitcoin fakes out to the upside with no volume support, a rapid rejection could accelerate the downside move.
Key Technical points to remember for this potential bearish pennant.:
- This pattern typically signals continuation of the prevailing downtrend.
- Liquidity Build-Up inside the triangle places emphases on price action rotations
- Apex Zone: This is when the dynamic support and resistance of the pennant converge, leading
to an impulsive break
Technical Target: A confirmed bearish breakout could send Bitcoin toward $69,470, this is a measure move of the triangle formation.

Bitcoin will soon fall!With technical analysis we can expect BTC to fall to $72,000.
we can witness Lower Highs and Lower Lows forming on Daily. we should expect a drop soon with 1-3 months. Expecting the Bull Run to be postponed perhaps around October of 2025.

$BTCUSD - It is green and the market could followCRYPTOCAP:BTC you know what is not down? Bitcoin. That means the market will most likely follow suit.
If this descending broadening wedge plays out, we are looking at $104K to $108K area.
Resistance areas to watch:
$90 - $91K
$96K
NASDAQ:IBIT

Thoughts on the market: BTC -> NDX -> SPX -> NVDA -> SMHMarket Outlook Scenarios
1. Delayed Correction : Despite near-term volatility, markets reach new all-time highs before experiencing a significant correction. Bear market conditions likely emerge late 2025 or early 2026.
2. Imminent Downturn: Current downward momentum continues, approaching bear market territory (-20%). At that point, we'll need to reassess based on:
Earnings reports from major companies
Forward guidance quality
Potential for either a sustained recovery or further deterioration
3. Accelerated Bear Market: Markets rapidly decline from current levels, driven by:
Economic uncertainty intensifying
Misalignment between AI technology expectations and actual business outcomes
Significant revaluation of growth assets
Remember: it's never a straight line up or down

Bitcoin Short: Wave 3 of 3 down (Target $72,000)I explain in this video the wave counts as well as how I set the stop loss and take profit target.

Continue to believe in BTCI. Technical Analysis
(1) Support and Resistance Levels
BTC has a strong support at $80,000. It’s withstood selling pressure multiple times. When the price dropped to $82,000, it rebounded, validating this support. $85,000 and $87,000 act as resistance levels. Failed attempts to break through these thresholds show strong selling above these price points.
(2) Moving Average System
While BTC short - term moving averages are down due to price drops, long - term ones stay upward. This means the long - term uptrend isn’t disrupted. A golden cross may form when short - term averages recover and cross long - term ones, supporting upward movement.
(3) Technical Indicators
RSI shows BTC is in oversold zone, hinting at excessive selling. Market recovery may trigger a price rebound. Although MACD gives a bearish signal, the bearish momentum is weakening, indicating a possible reversal.
💎💎💎 BTC 💎💎💎
🎁 Buy@80500 - 81000
🎁 TP 83000 84000 85000
The market has been extremely volatile lately. If you can't figure out the market's direction, you'll only be a cash dispenser for others. If you also want to succeed,Follow the link below to get my daily strategy updates

BitcoinBTCUSD
- Completed " 12345 " Impulsive Waves
- Break of Structure
- S / R Level
- Fibonacci Level - 38.20% / 50.00%
- Order Block

Be patient and Stay on the TrendJust learn how to be patient and stay on the trend. STFLAT FTW!! So far it has giving me so much confidence on staying on the trend.
Still not seeing an upside move for BTC

Bearish drop?The Bitcoin (BTC/USD) has reacted off the pivot and could drop to the 61.8% Fibonacci support.
Pivot: 84,019.80
1st Support: 72,880.23
1st Resistance: 91,396.07
Risk Warning:
Trading Forex and CFDs carries a high level of risk to your capital and you should only trade with money you can afford to lose. Trading Forex and CFDs may not be suitable for all investors, so please ensure that you fully understand the risks involved and seek independent advice if necessary.
Disclaimer:
The above opinions given constitute general market commentary, and do not constitute the opinion or advice of IC Markets or any form of personal or investment advice.
Any opinions, news, research, analyses, prices, other information, or links to third-party sites contained on this website are provided on an "as-is" basis, are intended only to be informative, is not an advice nor a recommendation, nor research, or a record of our trading prices, or an offer of, or solicitation for a transaction in any financial instrument and thus should not be treated as such. The information provided does not involve any specific investment objectives, financial situation and needs of any specific person who may receive it. Please be aware, that past performance is not a reliable indicator of future performance and/or results. Past Performance or Forward-looking scenarios based upon the reasonable beliefs of the third-party provider are not a guarantee of future performance. Actual results may differ materially from those anticipated in forward-looking or past performance statements. IC Markets makes no representation or warranty and assumes no liability as to the accuracy or completeness of the information provided, nor any loss arising from any investment based on a recommendation, forecast or any information supplied by any third-party.

Smart Money Buys the Dip Before the Next Surge!BINANCE:BTCUSD 🔍 Technical Analysis – 4H Timeframe
🚀 Stay ahead of the market with our latest high-probability trade insights! Get ready for expert Smart Money Concept (SMC) analysis to maximize your trading potential.
🔹 Current Price: $87,330
🔹 Support Zone: $85,985 - $85,500 (Potential buy zone)
🔹 Precise Key Levels
🔹 High-Probability Trade Setups
🔹 Risk Management Strategies
🔹 Real-Time Market Insights
🔥 Patience & precision lead to success! Follow for expert updates and smart trading decisions.
#SMCTrading #ForexSignals #CryptoAnalysis #SmartMoneyConcepts

BTCUSD: Bollinger squeeze paving the way for $160k.Bitcoin remains marginally neutral on its 1W technical outlook (RSI = 46.017, MACD = 2013.300, ADX = 45.410) and started last week a Bollinger Bands squeeze process. This squeeze has been present inside the 2.5 year Channel Up every time after it bottomed. Only July-August 2024 made a slightly lower low because the squeeze process turned out to be longer. Even in the event, what follows all Bollinger squeezes is an expansion rally, especially after a 1W STOCH RSI Bullish Cross and the pattern shows that by this September, we can reach $160,000.
## If you like our free content follow our profile to get more daily ideas. ##
## Comments and likes are greatly appreciated. ##

Rising wedge on the daily chart; hard fought battleToday and tomorrow are critical. Today's candle needs to clear 89s with conviction or we stand a very strong chance of falling down out of this rising wedge and that will spell 80 or lower most likely. RSI looks healthy and bullish however.
All that said, beware of some fakeouts in one or both directions to lure leveraged traders one direction or the other based on a presumed breakout. That sort of trickery is never out of the question.

Bitcoin, Strategy, and Michael Saylor: A Crypto Comedy Special!Buckle up, folks, because we’re diving headfirst into the rollercoaster world of Bitcoin, corporate shenanigans, and one man’s unrelenting quest to convince everyone—Wall Street, the White House, even your grandma—that digital gold is the future. Yes, we’re talking about Michael Saylor, the captain of the good ship Strategy (formerly MicroStrategy, but we’ll get to that rebrand in a sec), and his high-stakes gamble that’s got everyone clutching their wallets and popcorn 🍿. Let’s go! 🚀
Act 1: Bitcoin Goes Brrr… Until It Doesn’t 📉
Picture this: Bitcoin’s price is tumbling faster than a Jenga tower at a frat party, and the stock market’s throwing a tantrum because someone whispered “recession” in the break room. Meanwhile, Strategy—the artist formerly known as MicroStrategy—is sitting on a mountain of Bitcoin like Smaug hoarding gold in The Hobbit. Except, unlike Smaug, they’ve got bills to pay, and those bills are starting to look a little… chunky.
See, Strategy is the biggest corporate holder of Bitcoin, and they’ve been leveraging themselves up to their eyeballs to snatch every BTC they can get their hands on. Convertible bonds, debt financing, equity offerings—they’ve been playing the Wall Street game like it’s Monopoly, except instead of hotels on Park Place, they’re stacking digital coins. It was all fun and games when Bitcoin was mooning 🌕, but now that it’s trading like a NASDAQ stock on a bad hair day, the cracks are showing. Cue the ominous music 🎶.
The latest plot twist? Strategy just dropped a batch of High Coupon Preferred Stock last Friday—think of it as a fancy IOU with a 10% coupon (yes, you read that right, ten percent). That’s two whole percentage points juicier than the 8% coupon they peddled a month and a half ago. Desperation much? 🤔 Wall Street’s raising an eyebrow, and the whispers are getting louder: “Liquidity crunch incoming!” If Bitcoin keeps tanking, Strategy might have to start selling off their precious stash to keep the lights on. Untimely selling? In this economy? Oh, honey, pass the tissues 😢.
Act 2: From Micro to Macro—Rebranding for the LOLs 😎
Let’s talk about that rebrand for a hot minute. MicroStrategy—a name that once screamed “we make boring software”—is now just Strategy. Bold move, Saylor. It’s like if McDonald’s renamed itself “Food” or if Netflix became “Watch.” Genius or midlife crisis? You decide. Either way, it’s giving off vibes of a company trying to flex its big Bitcoin energy while subtly screaming, “Please don’t look at our balance sheet too closely!” 🙈
And speaking of balance sheets, let’s break down this preferred stock drama. These shiny new shares come with a 10% coupon—already a red flag that says, “We’re paying through the nose to borrow money.” But wait, there’s more! If Strategy misses a dividend payment (which, let’s be real, could happen if Bitcoin keeps sliding), they’ll owe compounded dividends that climb by 2% every quarter until they hit a whopping 18%. Eighteen percent! That’s not a coupon; that’s a loan shark knocking on your door with a baseball bat 🏏.
Compare that to the convertible bonds they were slinging last year—interest rates between 0% and 2%. Their interest expense over the last 12 months was a measly $15 million, pocket change for a company with Bitcoin holdings worth north of $10 billion. Now? They’ve jacked up their quarterly nut with $40 million in dividends from the February 8% stock, plus another $60 million from this 10% offering, on top of that $15 million in interest. That’s $115 million they’ve got to cough up every year—or roughly 1% of their Bitcoin stash at current prices. No biggie, right? Unless, of course, Bitcoin drops another 20%, and suddenly they’re selling coins like a yard sale on steroids. Yikes 😬.
Act 3: Michael Saylor, Bitcoin’s Loudest Cheerleader 📣
Enter Michael Saylor, the man, the myth, the megaphone. If Bitcoin were a religion, Saylor would be its high priest, preaching the gospel of “digital capital” to anyone who’ll listen—and plenty who won’t. He’s been on a tear, leveraging Strategy to the hilt with the unshakable belief that Bitcoin’s price would keep soaring forever. Spoiler alert: the stock market’s growth scare and recession fears had other plans.
Saylor’s latest stunt? Marching to the White House on March 8th with a PowerPoint titled “A Digital Asset Strategy to Dominate the 21st Century Global Economy.” No, this isn’t a Simpsons episode—it’s real life. His pitch? The U.S. government should scoop up 10-20% of all Bitcoin by 2045 (when 99% of it will be mined) through “consistent programmatic daily purchases.” Translation: Uncle Sam should borrow real money—paying interest, mind you—to buy a digital asset nobody uses commercially, all to prop up its price. Brilliant! Why didn’t we think of that? Oh, right, because it’s bonkers 🤪.
Saylor’s been shopping this idea around like a door-to-door salesman. He even pitched Microsoft, promising $5 trillion in shareholder value if they’d just hop on the Bitcoin train. Microsoft’s response? “Thanks, but no thanks.” Oof. Shots fired 🔫. Turns out, not everyone’s buying what Saylor’s selling—literally or figuratively.
Here’s where it gets juicy. Bitcoin was supposed to be a “peer-to-peer payment system,” per Satoshi Nakamoto’s white paper. A rebel currency to stick it to the banks! But somewhere along the way, it morphed into a Wall Street darling—a speculative asset that trades like a tech stock and has Michael Saylor begging governments to hoard it. From libertarian dream to government-backed portfolio filler? The irony is thicker than a triple-decker burger 🍔.
Take El Salvador, Bitcoin’s poster child gone rogue. Four years ago, they made BTC legal tender, and the crypto bros cheered. Fast forward to January 2025, and El Salvador’s like, “Yeah, never mind.” New laws say Bitcoin’s no longer currency (though still legal tender—confusing much?), it’s voluntary to use, and you can’t pay taxes with it. Their state-backed Chivo wallet? A ghost town. A poll showed 88% of Salvadorans haven’t touched it in a year, and Moody’s says the whole experiment cost them $375 million—more than their Bitcoin profits. Whoopsie daisy 🌼.
The commercial world’s reaction? A collective shrug. Bitcoin’s “value” is all about price now, not utility. Saylor can pump it all he wants, but if nobody’s using it to buy coffee or pay rent, what’s the point? It’s a financial asset, not money. And that’s fine—stocks and gold don’t buy lattes either—but let’s stop pretending it’s the future of currency, okay? 🙅♂️
Act 5: The Leverage Trap—When the Music Stops 🎵
Back to Strategy. With $8 billion in debt due over the next seven years, plus these escalating dividend payments, they’re walking a tightrope with no net. If Bitcoin keeps tanking, they’ll have to sell more coins to cover the tab. And if the market sours on their debt (less appetite to roll it over), they’re in deep doo-doo 💩. The rebrand, the high-coupon stock, the “we’re buying more Bitcoin” flex—it all smells like a company projecting strength while sweating bullets behind the scenes.
Saylor’s out here playing 4D chess, but the board’s looking more like a game of Chutes and Ladders. Pump the price, convince the world Bitcoin’s a reserve asset, and pray the recession scare doesn’t tank everything. It’s a high-wire act worthy of a circus 🎪—and we’re all just watching to see if he sticks the landing or faceplants spectacularly.
Finale: Bitcoin’s Not Dead, Just… Different 🧟♂️
Don’t get me wrong—Bitcoin’s not going anywhere. It’s a solid store of value, a speculative toy for Wall Street, a shiny thing for hodlers to flex on X. But money? Nah. The free market’s been screaming for centuries that it wants flexible, dynamic mediums of exchange—think Eurodollars, not rigid digital gold. Bitcoin took a wrong turn chasing hyperinflation boogeymen instead of building a better payment system. Oops.
For Strategy, the stakes are sky-high. They’re all-in on a story that’s fraying at the edges, and if the price falters, the leverage bites back hard. Will Saylor pull it off? Will Bitcoin moon again? Or will this be another bubbly tale of “too much, too fast”? Grab your popcorn, folks—this comedy’s still got a few acts left 🍿🎬.
Until next time, keep your wallets close and your sarcasm closer. Peace out! ✌️

BTCUSD: What if it's just a Channel Up to $175k?Bitcoin remains neutral on its 1D technical outlook (RSI = 51.175, MACD = -714.800, ADX = 31.665) as it is stuck between the 1D MA50 and 1D MA200 but it's the wider timeframes that are particularly critical right now and more specifically the 1W, which is causing the current rebound on the 1W MA50. We can argue that the pattern since the Dec 2017 Top is a Channel Up, even though the last Bear Cycle bottom didn't make exact contact with its bottom.
We can equally however assume that the new Cycle High won't make direct contact with the Channel's Top either. And that's also backed up technically by the Fibonacci levels of the previous Cycle, which saw BTC making a Top just over the 1.618 Fib extension. Consequently we can assume the new Top to hit at least $175,000 (Fib 1.618 currently). The bullish wave is also a direct Channel Up since the November 2022 bottom after all. Even on the previous Cycle, if we exclude the COVID crash price distortion, the bullish wave was a Channel Up as well.
## If you like our free content follow our profile to get more daily ideas. ##
## Comments and likes are greatly appreciated. ##

BTC Today's strategyRecently, the market's bets on interest rate cuts have increased, and the expectation of loose liquidity has prompted funds to flow into risky assets. Bitcoin undergoes a block reward halving every four years, which leads to a reduction in mining output and exacerbates its scarcity. The proportion of long-term holders has risen, the circulating supply has decreased, and the inventory on exchanges has been continuously declining, weakening the selling pressure. These changes in the supply-demand relationship provide support for the price of Bitcoin.
After a significant decline, BTC is currently testing the level of $82,000 in the short term. It is recommended to consider making a purchase.
btcusdt
buy:81500-82000
sell:84500-85000
We share various trading signals every day with over 90% accuracy
Fans who follow us can get high rewards every day
If you want stable income, you can contact me

Bitcoin Part2: Bullish Trade longBad economy,global inflation,recessive U.S. economy,hypes,uncertainly, the white house policy.
All these facts matter:They put the markets under massive pressure
Where is the chance: To plan different scenarios and models that have benn working in such similar scenarios. 202 is a good example, as the markets suddenly experienced big pressure.
Last not least, the FED transistory inflation, that wasnt real inflation, now indeed is becoming a dangerouse reality: We will have higher inflation, and global risks increasing.This will impact global liquidity inflow into markets.
Additionally we are noticing an outflow of the US stock markest, and increasing inflow of capital in foreign countries stock markets.
This are not good news for Bitcoin nor for crypto at all.
The chane in my opinion is just to think reverse.like 2020
Sell when positive news from the Whitehouse andpositive tone from FED.
Buy when White house talking and announcing threadful tariffs and if FED talks negatively.
Why?Because we have indieed real thread of inflation, and FED is the more competent team, who really now does everything to tame the inflation.Therefor i beleive them more.
Also short term contarian trade is just planned for max 24-48 hours. not longer
As the volatility rises.
Helding positions for more periode of time means increasing the risk.Upwards and downwards.

BUY BTC/USDBTC/USD on the 1h timeframe has reached a key area of support and is showing signs of a reversal from consolidation. It is also oversold.

BTC BREAKING OUT?The 4-hour Bitcoin chart is looking increasingly constructive.
Price is holding above both the 50 MA and 200 MA, confirming them as support. A golden cross—the 50 MA crossing above the 200 MA—looks imminent, which would add fuel to the bullish narrative.
We’re seeing a clear series of higher highs and higher lows since the bottom, which was predicted by bullish divergence on oversold RSI. Price action has consolidated into a clean bull flag, mirrored by a similar pattern on the RSI. RSI has already broken above its descending resistance and is retesting that breakout level—this often precedes a breakout in price.
Momentum is building, structure is clean, and the setup is leaning bullish.
