BTCUSD.P trade ideas

BTCUSDT, ELLIOTT WAVE ANALYSIS This chart represents a technical analysis of Bitcoin based on the Elliott Wave Theory. It appears that the analyst has used this pattern to predict future price movements. Let's break it down:
1. Elliott Wave Pattern:
Waves (1) to (5) indicate a large upward movement, typically consisting of five main waves.
In this chart, each sub-wave (1, 2, 3, 4, 5) is nested within larger waves, confirming a bullish pattern.
Wave (3) is usually the longest and strongest wave, which is clearly visible here.
2. Trend Lines:
The two sloping yellow and white lines form an ascending channel.
The price moves within this channel, with the upper line representing resistance and the lower line acting as support.
3. Future Projection:
Wave (4) seems to be complete, and Wave (5) is forming, typically indicating a final upward move before a major correction.
According to this analysis, the price could reach the range of $140,000 to $160,000.
4. Analysis Validity:
If the price can sustainably remain above the midline (dashed line), this analysis will be stronger.
Breaking below the lower trend line would invalidate the analysis, potentially leading to a deeper correction.
✅ Conclusion:
This analysis points to a strong bullish trend that, if realized, could be highly profitable. However, as with any technical analysis, these predictions are not guaranteed, and investments should always be made with caution and risk management.
This is a personal analysis and not a recommendation to buy or sell!

Is correction over?BTC could retest 101k area before dumping to 67-68k area in May. I see a retest of 2021 peak that could become a support to the last bullish leg to a new ATH @ 137k

Bear cycle begins if this happens. Not the time of buy the dipI have been thinking this Bitcoin cycle has already peaked.
I am using a weekly chart here because I can fit in three BTC cycles on the screen, but it is more clear if you look at it in the Daily chart.
I am analysing the chart by using VWAP - Volume weighted moving average.
When you place VWAP (orange line) at the peak of each cycle you can see the pattern as below:
1) The price goes down steadily from the suspected peak price but eventually breaks above the descending trendline. (please check it in daily chart).
2) The price moves and closes above the descending trendine but the upside move is limited and price gets trapped and consolidate in the sideway for a few months (blue rectangular box).
3) VWAP acts as resistance line and eventually resumes the downside move.
4) By then, all momentum indicators are deep in the bear zone, and the bear cycle begins.
When I look at weekly and daily chart, I can see the same scenario is unfolding now.
I don't think the price will go straight down from here. There are good small swing trade opportunities in lower time frame for the next few months. However, if the price struggles to move above VWAP, the end of cycle scenario becomes more and more convincing.
It is just my humble opinion based on one style of analysis.
Final note:
Bitcoin price action has been very similar to NASDAQ100 and US500, and these charts are looking very dire. If US indices go down in the the next few months, Bitcoin will go with them.

Good r:r on alts.I have made market watch baded on indicator on main screen. It aggregate view on main alts. Fat dot is bullish. Thin coloured dot is signaling possible entry. Gray dot is bearish. No dot is just downtrend. Solid line is showing how market is performing. Now its valie is 1. In the recent past it was good place to enter long trades. Marked with yellow lines. Be aware. If this is entry into bear market there will be dead cat bouces so manage your risk.


sell btc long silvernew 3wk MACD cross on silver dominance. should see a favorable silver inflow vs btc now for the next 3 wk closes (3-4 at least) = 3-4 months

Bullish Breakout Watch: Bitcoin Targets $86,111 Amid Market!My Targeted Price is $86111 Its Bulliesh now a VERY Perfect break out..

Check out my Week 14 Trade Analysis for 2025!Hello fellow traders , my regular and new friends!
How was your trading this week?
For me i did a couple of trades, namely on the EurNzd, Usdjpy and snp500.
Took a lost on snp500.
Usdjpy was so so
Eurnzd was not bad :)
Which are the pairs you have traded?
NFP for this week, do take note. What should we keep an eye on?
Do check out my recorded video for more insights!
Do Like and Boost if you have learnt something and enjoyed the content, thank you!
-- Get the right tools and an experienced Guide, you WILL navigate your way out of this "Dangerous Jungle"! --
*********************************************************************
Disclaimers:
The analysis shared through this channel are purely for educational and entertainment purposes only. They are by no means professional advice for individual/s to enter trades for investment or trading purposes.
*********************************************************************

Stay Calm and Long On - 70K btc bottomThe panic could be severe, given market conditions are creating job losses at an accelerated pace. Expect overcorrection and place stink bids. But fair market value for bitcoin remains at a floor of ~85k per: en.macromicro.me/charts/29435/bitcoin-production-total-cost
So anything below 85 is pure discount. Good luck.

Btcusdt technical analysis.Btcusdt technical analysis next move possible at h1 time frame.not financial advise.
BTC to move into continuous downspin if uptrend brokenIf Bitcoin breaks below the uptrend that has been in play since Sep 2023, I believe that said uptrend could start to act as resistance and that moves down to 52K are possible.
Possibility of a rally into latter part of April shortly following by a significant move down to one of these levels:
- the 618
- the downtrend that began to form in Mar 24
- the support region 49-52k
Projected flight path for "trough" est. Jun-Jul 25
A new ATH is usually printed Nov-Dec of the year following the BTC halving event:
- Dec 2013
- Nov 2017
- Nov 2023
Conclusion (provided the uptrend is broken):
- Rejection late Apr
- Trough in Jun
- New ATH Nov/Dec
🤷♂️

Behavorial ScienceI want to caveat this post with the fact that I've never read any Gann books and only privy to the bare minimum knowledge in how to use Gann tools.
First off, I don't really subscribe to the "mystical" aspects of Gann's work, but to me that doesn't invalidate the other aspects of his work. In fact most Gann tools are just visual depictions of market sentiments. After all, isn't that what technical analysis mostly is? A visual/quantitative study of human behavior and reaction? Gann angles = sentiment. Gann boxes/intervals = patience/time.
And so we use Gann tools not like some mystical pentagram chart to wealth, but simply as a ruler to quantify and measure sentiment and patience.
For reference sakes I'm going to label the current Bitcoin chart as an a-b-c-d-e expanding diagonal wave I (maybe it is, maybe it isn't... not relevant for this chart). An observation I made was that wave e seems to be similar in characteristics to a wave d but played in reverse... so why not model the upcoming wave as a flipped version of wave c (adjusted for time)?
Using Gann angles from the most recent local bottom (dashed lines) we see a bounce off the 1/8 angle. 1/8 to me represents euphoria so IMO a continuation upwards cannot be ruled out here... however given the broad market's aversion to risk right now, an intermediate term corrective wave seems more likely. So we model a flipped wave c to prepare for entry points.
TLDR; bullish long term, neutral to bearish short term


I'm already out, but maybe you should tooI'm not a trader. I just bought at 16, and sold at 107.
I still think people are considering that we go way higher. I think we are overestimating that.
We can go to 120-ish at max. But high likelihood if we don't hold the current levels, it's going to go downhill.

BTC CORRECTION PhaseFrom all the data in the high time frame on the bitcoin chart, we see that the correction is still continuing.
The correction target for Bitcoin is in the nearest support area, 66-67K zone.

Bitcoin Next two SwingMy next two swing for btc, is simple, I am using the basic strategy of a fibonacci retracement, combined with VAH, VAL, POC.
I want to clarify that I am short from 98k, this is just road plays for me
Remember that trading is a game of probabilities, stick to the highest probabilities.

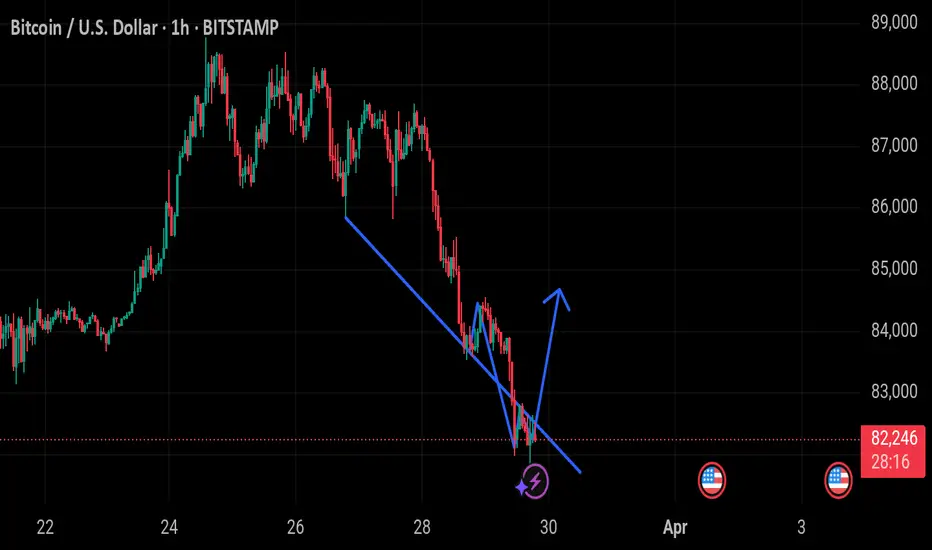
Rising wedge breakdown may take BTC below 84K and lowerCRYPTO:BTCUSD has broken down from a bearish wedge in hourly. I expect it to do at least 38.2% retracement around 84k, though it could likely go lower around 50% as well which is around 82,600. Closing below 80k might open doors to resumption of downside trend.

BTC trading very polite #Fibonacci is strong with this one. The downwards trend retracement held without question.
As a short thermometer pull back looking for the .5 to hold as support/ add lvl or wait for the .61 retracement.

btcusdThis Analysis Can Change At Anytime Without Notice And It Is Only For educational Purpose to Traders To Make Independent Investments Decisions.
Disclaimer
The information and publications are not meant to be, and do not constitute, financial, investment, trading, or other types of advice or recommendations supplied or endorsed by TradingView

Death cross Liquidity grabDeath cross of 200 day SMA and 50 day SMA is imminent, previous had a 18% grab, would put us at 71K then a sharp reversal.

BTCUSD Technical Breakdown | Key Support & Resistance Levels!Watch how Bitcoin reacts to major support and resistance zones with precise price action! This 30-min chart shows multiple breakouts, retests, and trendline shifts—perfect for short-term traders looking for entries and exits. Keep an eye on those yellow zones and structure shifts!

BTC PERPPETUAL TRADE (SELL) Sold from $85,220BTC PERPPETUAL TRADE
BTC SELL SETUP
Currently $85,300
Sold at $85,220
(Trading plan If BTC up to $87,000 we will add more sell)
Expecting target $83,200 0R DOWN
Incase of early exist will update this anaylsis
Its not a Financial Advice
