Btcusdt technical analysis.Btcusdt technical analysis next move possible at h1 time frame.not financial advise.
BTCUSD.P trade ideas

Time Is On Our Side.It’s been awhile since I’ve published my ideas, forgive me, most of my analysis you can find on X, so follow me there for more analysis but I should post here more often. Here I am:
Daily chart printed a relatively EQHs then crashed where price bottomed into the 50% range, so it’s time to rally back up run those EQHs, a final attempt for the Monthly to Close Above $93354.77, ending 2025/Q1 above $102K, followed by the next market phase the Distribution stage where price will Mark down price into the bottom of 2026/Q3 @$62317 then rally back to print a new high by end of 2028/Q3, possibly $130K but at this rate of adoption unlike any other times, price will soar sky high.
Prepare yourselves and move diligently:
Sell The Premium (Top) by 2025/Q2.
Buy The Discount (Bottom) by 2026/Q3.

BTCUSDT TRADING POINT UPDATE >READ THE CHPTAIANBuddy'S dear friend
SMC Trading Signals Update 🗾🗺️ crypto Traders SMC-Trading Point update you on New technical analysis setup for crypto BTC USDT. ) list time post signals 💯 reached target point ) 👉 New technical analysis setup BTC USDT looking for bullish trend 📈 FVG level support level. 83k 82k support level 87k 88k resistance level ). Guys 🤝 good luck 💯💯
Key Resistance level 87k + 88k
Key Support level 83k - 82kà
Mr SMC Trading point
Pales support boost 🚀 analysis follow)

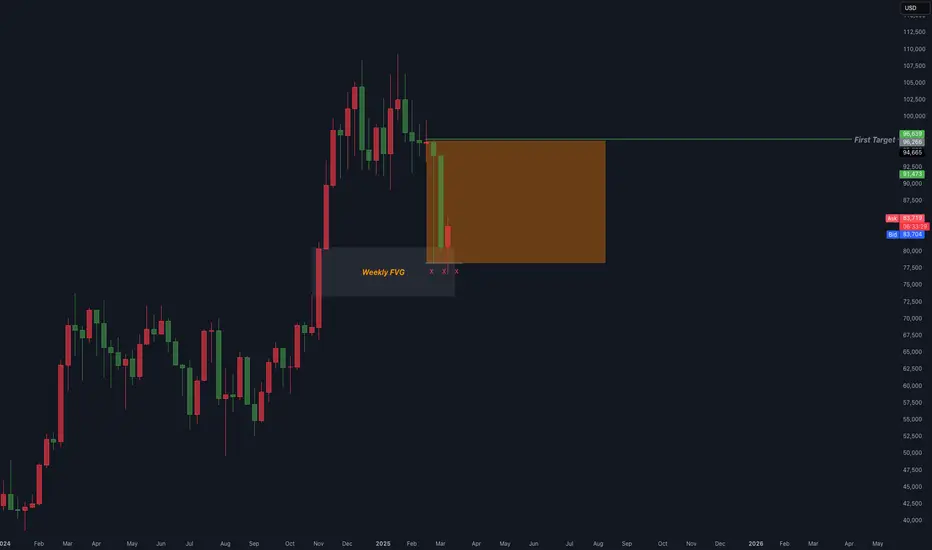
I think there is potential for BTC longs in the week ahead.BTC is at a weekly FVG and has strong BSLQ at the first target, which could push the market to the upside. This is just my humble opinion and not financial advice.
Bitcoin just needs one bullish engulfing candle here to reverse personal idea: As my previous two posts Bitcoin reacted to 76k and we see bulls control, in my opinion Bitcoin needs just one bullish engulfing candle to complete it's pull back and starting it's parabolic movements, in my opinion if it happens, this cycle of Bitcoin probably will be different from previous movements and we see high energy of market because all of Alt coins are thirsty to rally. Good 🙂 luck 👍

Cocoa and Bitcoin: Correlation or Mere Coincidence? Since January of 2023, the price of Cocoa Futures and the price of Bitcoin have demonstrated a highly positive correlation. 115 data points of weekly close prices of Bitcoin and Cocoa Futures were entered into a correlation coefficient calculator between January 1st, 2023 and March 15th, 2025. This yielded an output of r=.9289 representing a strong positive correlation.
The correlation in price movement becomes even more clear if we look at the charts going back to early 2023. As you can see below, both Bitcoin (top) and Cocoa Futures (bottom) have moved in nearly identical patterns. There are even some local bottoms and tops that line up to the day. For example, temporal markers such as Election Day (November 5, 2024) and Inauguration Day (January 20, 2025) that very closely mark the start of a local uptrend and local downtrend, respectively, for the price of both assets.
Recent Cocoa price increases and volatility have mainly been attributed to decreases in supply, driven by adverse weather conditions in West Africa, crop diseases, supply chain disruptions and strong global demand. While all of these factors clearly play into Cocoa’s price volatility, we cannot discount the uncanny correlation of price movement simultaneously occurring in Bitcoin which is completely unaffected by the aforementioned supply factors.

BTCUSDBITCOIN is heading towards 86K and then we will see some reaction as either correction or impulse downwards.
Disclosure: We are part of Trade Nation's Influencer program and receive a monthly fee for using their TradingView charts in our analysis.

BTC/USD Analysis & Trade Idea - Zooming Out
Market Structure & Key Levels
Bitcoin (BTC/USD) has recently faced a significant correction after reaching local highs, now testing a key demand zone. The structure indicates a potential reversal or further downside if support fails.
- Support Zones:
- $73,805 – Currently acting as support; a breakdown could trigger more downside.
- $68,997 – A strong demand area that previously led to a bullish breakout.
- $61,206 – A deeper retracement level and a key zone for long-term buyers.
- Resistance Levels:
- $84,304 – A critical resistance where price may face rejection.
- $93,401 – A major supply zone; breaking above would confirm bullish momentum.
Price Action & Potential Scenario
- BTC is testing $73,800 , a key inflection point. A strong bounce could push price toward $84,300 , while a breakdown may lead to $69,000 or lower.
- Price recently rejected from local highs, suggesting increased selling pressure .
- A confirmed reclaim of $84,300+ would be a bullish confirmation for another leg up.
Trade Outlook
📈 Bullish Scenario : If BTC holds above $73,800 and breaks $84,300 , a rally toward $93,400 could follow.
📉 Bearish Scenario : A breakdown below $73,800 could lead to a retest of $69,000 and possibly $61,200 in a deeper correction.
Conclusion
Bitcoin remains at a key decision point. Holding support could fuel a reversal, while failure to maintain $73,800 may trigger further downside. Watch for price action confirmation before taking positions.
---
Disclaimer
This analysis is for informational purposes only and reflects my personal views. It is not financial advice. I am not responsible for any trading or investment decisions you make. Always do your own research and consult a professional before investing.

Bitcoin Technical AnalysisBitcoin's technical analysis based on Elliott waves will be as follows: Given the completion of 5 complete Elliott waves, we expect a deep correction to begin, which can be corrected to the 78.6 Fibonacci range. Why to this range because the wave corrects in the main?

Uncertainty equals TurbulanceWith so much fear and uncertainty due to tariff talk, fear has taken over the markets. Will the markets have enough good news in the near future to make new highs like some bulls expect? Or will the fear continue to worsen forcing panic selling to take over? Only time will tell. I expect another crazy week ahead. Fed talk and Options X manipulation ahead. Stay tuned

BTC Monthly AnalysisMy current perspective is simple.
The market flips supply into demand
OR
The market taps into demand.
——————————————————
While there can be trades taken between levels with proper risk management, these zones should provide the best setups.
It’s okay to swing and miss; again with proper risk management.
I am long term bullish & short term bearish.

#BTC crashNot to many EWT's see this leading diagonal and a truncated wave 5 but I am all over it. Bitcoin price could drop to 2017 highs again 20k target

$BTC to the moonWhen analyzing BTCUSD, I believe it has found its bottom. We have several confluences indicating a potential bullish move, including the mitigation of a monthly key level in a discounted region, an SMT swing low with ETH, and liquidity strategically positioned to act as fuel. Given this, I genuinely think the next stop is the moon. Let's go, BTC! 🚀

BTCUSD The Week Ahead 17th March ‘25 Recent price action in Bitcoin (BTCUSD) suggests an oversold bounce, with resistance capping gains at the 88,000 level. The continuation of selling pressure could extend the downside move, with key support levels at 76,112, followed by 74,222 and 67,260.
Alternatively, a confirmed breakout above 91,900, accompanied by a daily close higher, would invalidate the bearish outlook. In this scenario, Bitcoin could target 95,126, with further resistance at 98,500.
Conclusion:
The price remains at a pivotal level, with 88,000 acting as a key resistance. Failure to break above this level could reinforce downside risks, while a breakout could shift momentum back in favor of bulls. Traders should watch for confirmation signals before positioning for the next move.
This communication is for informational purposes only and should not be viewed as any form of recommendation as to a particular course of action or as investment advice. It is not intended as an offer or solicitation for the purchase or sale of any financial instrument or as an official confirmation of any transaction. Opinions, estimates and assumptions expressed herein are made as of the date of this communication and are subject to change without notice. This communication has been prepared based upon information, including market prices, data and other information, believed to be reliable; however, Trade Nation does not warrant its completeness or accuracy. All market prices and market data contained in or attached to this communication are indicative and subject to change without notice.

Almost 600 pips move catch this long setup.BTCUSD 600 pips move catch this long setup almost half target successfully archived with technical analysis.

BITCOIN (BTC/USD)BTC/USD – Technical Outlook
Bias: Bearish
BTC/USD has completed the ABCD pattern and is now printing lower highs and lower lows, confirming a shift in market structure to bearish.
Price is currently retesting a previous support, now turned resistance. If this level holds, it could open the door for continued downside; with the 68K–50K zone as a potential BTD (buy-the-dip) area.
TARGET 1 (78K):
A key structural zone. A clean break and close below this level would confirm bearish momentum and increase the likelihood of price falling.
TARGET 2 (66K):
Likely to act as a magnet; a previous resistance turned support that launched price toward 100K. A return here would retest the foundation of the previous rally to 100k.
TARGET 3 (50K):
From a fractal and psychological standpoint, double tops often retrace to the origin of the bullish move. In this case, around the 50K zone.
Invalidation:
A reclaim of 85K–90K would shift bias back to bullish, signalling potential for upside momentum.

BTC Today's analysis
BTC has been fluctuating at 84000 to 84500 yesterday, very stable, like a crocodile waiting for food to come, so we should always be vigilant
BTC 🎁 Buy@83000 - 83200
🎁 SL 83500
🎁 TP 84500 - 84800
If you're struggling to find direction or generate profits in finance,
I'm here to help. As a seasoned financial analyst,
I'm great at decoding market signals for profit - making chances.
I'll customize a plan for you. Contact me now to start seeing financial gains!

BTCUSD POSSIBLE 69-63K CRUSHHH IN COMING???BTC are the KING OF BULL MARKET but can be very profitable when looking to SELL CORRECTION
I can see we are forming this BEARISH TRIANGLE 4H, I like to trade this AGGRESSIVELY on LAST TOP TOUCH and not on brake at the bottom
Im looking for this to play out, if 85K DONT stay solid that will be my SELLIG ENTRY SL 90k TARGET 69-63K
Once im in i will update
Enjoy your FRIDAY, i have feeling this weekend will have CRYPTO BLOOD ON THE STREET NEAR YOU LOL

Smart money concept trading strategy the order block below it's a high probability for the buyers to take control of the market potential price movement.-25% risk

BTCUSD Sell now.BTCUSD Sell now based on the Momentum of sellers after breakout of Distribution phase. Most likel hit will hit the TPs highlighted.

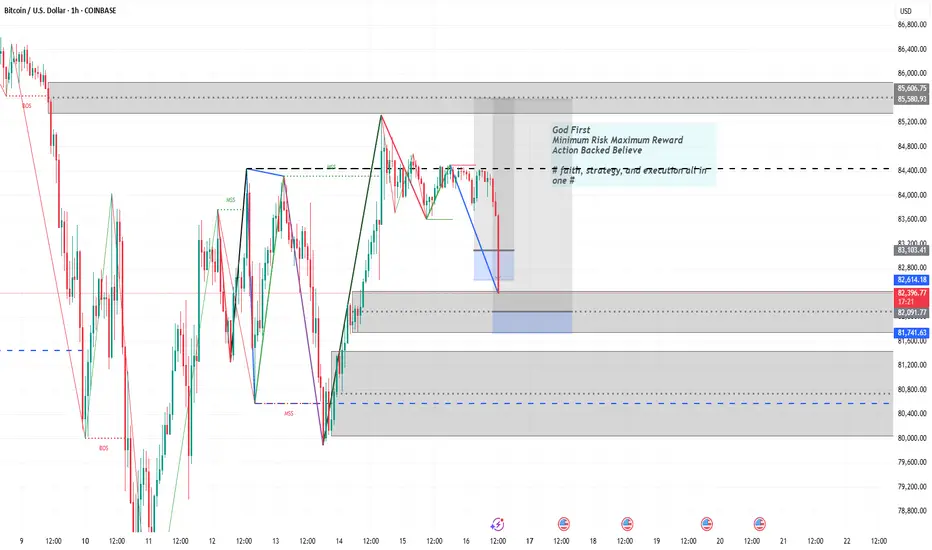
BUYGod First
Minimum Risk Maximum Reward
Action Backed Believe
# faith, strategy, and execution all in one #
KEEP SHORTS FOR 50% CORRECTIONPrice has been trading tops and bottoms within well defined harmonic forms.
The third major top was at 68997.75+/- level and corrected to a bottom at 15473.78 on 21/11/2022. From the primary bottom on 05/10/2009 to this bottom we have a timeline 685 weeks forming the horizontal x-axis and price change +689.9775 the vertical y-axis.
05/10/2009 - 21/11/2022 = 4795 days / 685 weeks / 157.5 months
From this we have:
Price: 0.00 - 68997.75 - 15473.78 (Price change = 689.9775 * 10) pts
Time: 05/10/2009 - 21/11/2022 (Time count = 685 weeks)
This sets the pace for the expansion forms, price reached 73757.39 from 15473.78 and corrected again to 49217.00 on 05/08/2024, a price change of (+737.5739 * 10) from the primary low and 774 weeks time count. That gives a (737.5739 x 774) structure expanded from (689.9775 x 685).
From 68997.75 which is the (1/Phi) level the next expansion would be a (+1087.00 +/-) pts of which price made a top at 109354.00. This would be the 1.0 or the (1 x 1) Gann square of price and time. Price has reached the 1.0 top, time made 798 weeks at this top. From a (1 x 1) Gann square which is usually the smallest expanded structure we would have a 50% decomposition which we expect price to reach at least the 52400.00 level if we break through the 68997k top.
Since time is still lagging price by 208 weeks +/- it suggest two possible scenarios to consider.
Check back as we make time projections and price levels to expect forward.
Good luck, manage risks responsibly.

BTCUSD Analysis StrategyToday's Bitcoin market shows the dual characteristics of technical correction and cautious market sentiment. The short - term risk is inclined to the downside, but there is still rebound potential in the medium - and long - term.
The fact that the price of Bitcoin has fallen below $84,000 does not mean the end of Bitcoin. Instead, it is just a part of the market operation. For investors, the key to success lies in understanding the underlying factors of the market and correctly assessing the risks and opportunities. In a market full of uncertainties, only by staying calm and conducting rational analysis can one seize the future opportunities.
Bitcoin Trading Strategy
sell @ 90000
buy @ 78000
Finally, I'd like to remind every investor that the cryptocurrency market is inherently highly volatile, and every decision you make may have an impact on your investment returns. In this rapidly changing market, what we need is not just luck, but also a keen mind. You are all welcome to follow me. Let's discuss the future of Bitcoin together. Perhaps it is through the collision of ideas between you and me that we can gain a clearer understanding of this market.
