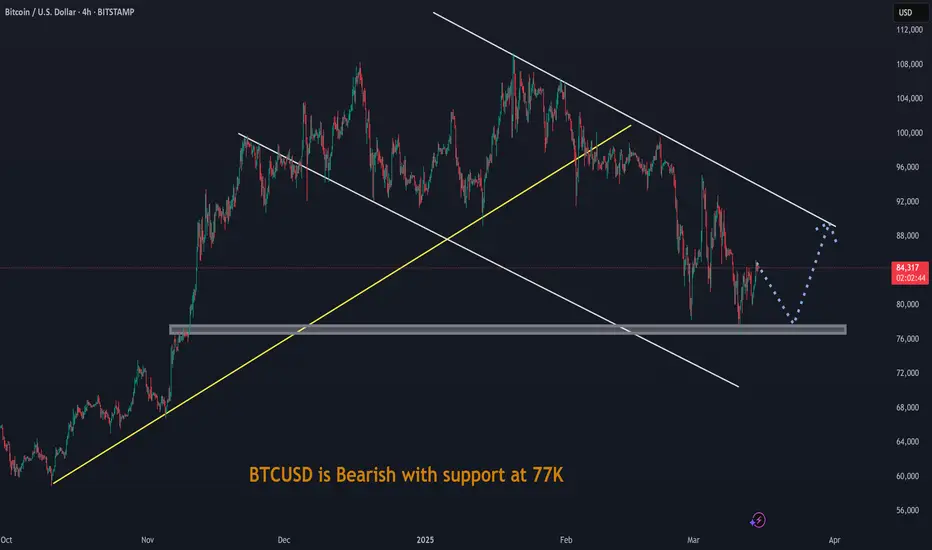
BTCUSD is Bearish with support at 77KBTCUSD is Bearish with support at 77K. It may consolidate for a while.
BTCUSD.P trade ideas
BTC Bearish Sell Trade with TargetsBTC just rejected from the daily FVG imbalance area.
It is reacting from the middle line of the rejection wick.
Short trade idea and targeting the lower wick
Entry / SL / TP are on the chart.

BTCUSD, Are we going to face 35% Correction ?! (Local View)BTCUSD, Are we going to face 35% Correction ?! (Local View)
Let's take a look at local movements on INDEX:BTCUSD .
Since last post Bitcoin moved in our favor, reached 38,500$.
We have a strong bounce here, which is heading towards upper 40s as long as daily close was above big red candle.
There is a probability, that Bitcoin is going to draw lower high which can be anywhere from 38.2 to 61.8 (Golden Pocket) Fib. In confluence we have several magnets at this range.
Possible stop losses around 43,500$
Fair Value Gap around 44,500$. Possible liquidations Across top 3 exchanges (Binance, OKX, Bybit) totaling around 4.0 Bln. USD. (This number covers last 30 Days Data)
Hence we should take into consideration, that huge amount of liquidity is sitting down in the previous reaccumulation zone. (Suggesting to check out Liquidity Heatmap . Putting link because I am not able to add screenshot.)
- - - - - - - - -
Next I want to mention one weird thread I bumped into on Twitter.
It’s about HTX (ex Huobi), which is owned by Justin Sun. They turned off their proof-of-reserves system, what hints about their insolvency. Onchain analysis say that they have problems with ETH holdings.
Also this is not connected to only HTX, things are being wrong with TUSD and stUSDT (Stacked USDT receipt on TRON Network).
For further details about this event please read thread from adamscochran on twitter . Hence there was around 600 Mln. USDT transfer to JustlandDao yesterday.
In the end, I want to mention, that there is no 100% accurate analysis.
We are dealing with probabilities, just with analysis we are shifting probabilities to our favor.
Best Wishes.

BTCUSD, Are we going to face 35% Correction ?!If we take a look at previous 2 notable cycles we easily notice similarities.
From these 2, 2022-2024 looks more similar to 2016-2017, as long as we had -
Breakout of downtrend line. ✅
Reaccumulation zone. ✅
Testing major bear market impulse (Which in all cases became strong resistance). ✅
What we didn't experience is correction after these 3 moves.
In 2016 it was around 40% (Tested reaccumulation zone)
In 2019 it was around 53% (Tested major support / resistance zone).
As long as current market structure somewhat repeats 2016 move, have possibility to retest top of after trend line breakout reaccumulation zone, which sits around 33-32k.
Percentage wise it's around 35% from ETF top and 23% from current price.
What you think ?

Big Cup N Handle BTCUSDTextbook cup and handle with a completed retest. General direction should be up IMO. 130K target although the timeline is hard to say.

long ideaThis Analysis Can Change At Anytime Without Notice And It Is Only For educational Purpose to Traders To Make Independent Investments Decisions.
Disclaimer
The information and publications are not meant to be, and do not constitute, financial, investment, trading, or other types of advice or recommendations supplied or endorsed by TradingView

$BTC Closed Above 200DMA + Bullish DivergenceCRYPTOCAP:BTC closed the day a tick above the 200DMA.
Need to trade a few days above $85k to show strength for Bulls.
Ideal setup would be an inverse H & S from here.
RSI showing Bullish Divergence.

Potential reversal for a short term bullishTrading Plan:
1) Buy Area: 79,243 - 78,807
2) Sell Area: 87,414.31 - 88,198.32 - 88,790.43
A potential short-term bullish reversal for BTC may occur today once it hits the fair value gap. However, please note that the overall trend remains bearish, and there is a possibility that this trend will continue due to market uncertainty driven by geopolitical factors.

shortThis Analysis Can Change At Anytime Without Notice And It Is Only For educational Purpose to Traders To Make Independent Investments Decisions.
Disclaimer
The information and publications are not meant to be, and do not constitute, financial, investment, trading, or other types of advice or recommendations supplied or endorsed by TradingView

BTC Short Ideawe are looking good for a short setup here to follow the short term retracement. tp1 will be the last low and there will be a runner to the next support at about 83550. please note this is not financial advice and for training and education purposes only
Happy trading 33
Bitcoin Analysis – Inverse Head & Shoulders Breakout📊 Bitcoin Analysis – Inverse Head & Shoulders Breakout 🚀
BTC/USD (1H, Binance) is showing a textbook Inverse Head & Shoulders pattern, signaling a potential bullish breakout! 🎯
🔹 Left Shoulder: Around $78,000
🔹 Head: Around $74,000
🔹 Right Shoulder: Around $78,000
🔹 Neckline Breakout: $84,000 (Confirmed ✅)
If BTC holds above this neckline, we could see a strong push toward $92,000+ in the coming sessions! 📈
🔥 Trade Idea: Long positions above $84,000 with SL below $82,000 and TP near $92,000.
📢 DYOR – This is not financial advice! Always manage risk properly. ✅

BTC SHORT TP:77,000 13-03-2025Bitcoin has broken a significant accumulation zone that was set for an upward movement, now indicating bearish signals. We will look to enter a short position between the 82,000 - 83,000 range, with a take profit set at 76,000 - 77,000.
This analysis is based on 4-hour and 2-hour timeframes, so we anticipate that this will unfold within 25 to 30 hours. If the expected movement does not occur within this timeframe, the trade will be deemed invalid.
Make sure to follow me to stay updated and continue maximizing your profits!

BTC/USD A QUICK TRADE? The price is at an interesting point...the drawing is basically more of a 5m trade but it goes well with m15 TF so its cool, just makes it stronger zones.... we can see how the price is reacting and we can see we are in a buy momentum and trend on these TF's... so we can look for the fakeout and enter for buy or sell...but buy is a higher chance...lets see!

BTCUSD: Phase 4 of Bull Cycle just started.Bitcoin is about to turn neutral again on its 1D technical outlook (RSI = 44.562, MACD = -3343.000, ADX = 34.423) as it is making a big 1W comeback on this week's candle following a nearly perfect touch of the 1W MA50. Every test of the 1W MA50, as well as every test of the S1 1W RSI level, has been a straight buy opportunity inside the Bull Cycle's Channel Up since the very begining of the November 2022 bottom.
As first the price action was concentrated on the lower half of the Channel Up (green zone) but since February 2024 it has been primarily on the upper half (blue zone) as the rallies got more aggressive, with the only exceptions being the 1W MA50 tests such as the current one (green Arcs). Every bottom rebound has increased by at least +98.76%, so that gives us a peak estimate of TP = 150,000. An temprary high around 120k and pullback to 100-90k is a possible scenario based on all previous rallies/ Phases. Phase 4, which should technicall be the final of the Bull Cycle, has just started.
## If you like our free content follow our profile to get more daily ideas. ##
## Comments and likes are greatly appreciated. ##

BTC to likely kiss the $74K - $69KBitcoin Market Analysis and Forecast
Bitcoin has retraced over 50% from its all-time high (ATH). Despite a rebound from the Fibonacci 50% level to its current price of $84,600, continued selling pressure could push BTC lower toward the Fibonacci 61.8% retracement zone, which lies between $74,000 and $69,000.
This potential pullback presents strategic entry points for long-term investors who have the patience to hold through market cycles.
Given the current market conditions, I will continue to accumulate using a Dollar-Cost Averaging (DCA) strategy to mitigate volatility and optimize long-term gains.
I will be monitoring the price action closely and providing further updates as the market develops.

Bitcoin is ABSOLUTELY under Pressure - It MUST react before DECI have been looking at this in detail for some time and have decided to change how I calculate things and here is the result.
There are 2 things of Massive importance to see here.
First is that Curve that PA has been under since 2010
The Lower Dashed Line is the Trend line formed in 2011. It is Strong and it is Valid and PA is currently running along it.
Here is a closer image to show you where we are in relation to it right now. Directly below PA currently, we hit that line around 67K
The Apex of this "Triangle" is December THIS YEAR
PA Has to break Above that Arc, the same Arc that has Rejected PA EVERY TIME since 2011
BUT THIS TIME IS DIFFERENT - IT HAS TO BE and here is why
I am not going to explain the % increase each Cycle Low to ATH, it is in the chart but I do want to show you this,
The first real push of Bitcoin was a massive % rise that created the ATH that formed the 1st point of the Lower Trend line of the New channel. This is A on the chart
The Next push was to B. This push was 1.433% of the Original push A - smaller by a long way in % terms.
These 2 moves created the channel that PA has remained in ever since. ( see dashed upper trend line)
From this point on, we can see that each cycle push , while in channel, has been approx 20% of the previous rise. Or around 1/5 of the size in % terms
Or to put is another way, Each Rise has been a diminishing % rise from previous.
Look at that curve. It has pushed PA down each cycle ATH
This cycle, we are currently at 26.7% of the previous push ( to 2021 ATH ) and it has created a cycle ATH currently.
But is the cycle Over ? - Hopefully NOT
Because if it is NOT over, we need to break through that Curve of resistance by December.
The Much expected 200K ATH is way over that curve and would result in a 55% of previous push rise. That would break the "trend"
This is VERY Different. But Absolutely required.
So, the question that should be on Everyone's lips is "Which is stronger ? The line or the Arc ?"
My expectation is that we will break through. That Arc has been a Major part of the formative years of Bitcoin PA but now, it could prove detrimental. Because, if we do not break through it, It will push Peice DOWN, through that line of Long term support.
We do not want that
SO, Maybe THIS is why the Bulls are waiting for the Weekly MACD to reset to Neutral...PA Needs the strength to break through.
So, Go Buy your Local BULL a Beer ( or white wine lol ) and Lets get on.
Watch this Close. It really is more important that Trumps Reserve, Saylors Love nest or Bezos after burners.................

btcusd technical analysis , focous on key levels This chart represents a technical analysis of Bitcoin (BTC/USD) on a 1-hour timeframe using harmonic patterns and key price levels. Here’s a breakdown of its meaning:
1. Harmonic Pattern (Gartley or Bat)
The chart displays a harmonic pattern (potentially a Bat or Gartley pattern) with key Fibonacci retracement and extension levels.
Points labeled X, A, B, C, D form the structure, which traders use to anticipate price reversals.
2. Sell Zone & Resistance Area
A "Sell Zone" is marked in the gray rectangle where the price is expected to face resistance.
The strong position label suggests that this area is considered a significant resistance level where sellers might step in.
3. Expected Price Movement
The blue downward arrows suggest that the price might decline after reaching the resistance zone.
The analysis indicates a potential retracement towards the lower support zone (~$81,000).
If resistance holds, traders might short BTC/USD in this area.
4. Key Price Levels
Current price: ~$84,242
Sell zone: ~$85,000 - $87,000
Support zone: ~$81,000
Lower support: ~$77,667 (red line)
5. Trading Strategy
Bearish Scenario: If BTC/USD fails to break the resistance, traders might look for short opportunities.
Bullish Scenario: If BTC/USD breaks above the sell zone, a further rally could occur.
Would you like help analyzing the possible trade setups based on this chart?

Btcusd support for pullback This Bitcoin (BTC/USD) price analysis on a 1-day timeframe (from Coinbase) includes key technical indicators:
1. Double Top Formation – Marked at the resistance level, this pattern typically signals a potential price reversal. The price failed to break above this level twice before declining.
2. Resistance Level – A trendline acting as a strong resistance, previously rejecting price movements. The chart suggests that Bitcoin needs to break through this level for further bullish momentum.
3. Support Zones – Two green zones indicate key support levels where buying pressure has historically increased, preventing further declines.
4. Projected Price Action – The analysis suggests a short-term decline towards support, followed by a bullish rebound. The price is expected to test resistance again and potentially break out toward $104,283.
5. Volume Profile – The right side of the chart shows the volume traded at different price levels. Higher volume zones indicate strong areas of interest for buyers and sellers.
Overall, this analysis suggests a temporary dip followed by a potential breakout to new highs, contingent on Bitcoin holding support and overcoming resistance.

mOON pHASE cORELATIONIts easy to see we pump into the new moon. something to keep an eye on when entering or exiting positions...

REASON WHY I BUY BTC.I have bucketed btc and study the particulate market structure, each time that structure happen ,i already forecast what is going to happen 70% .watch and study is price action.

BITCOIN BULLISH TO $116?! (UPDATE)Since I posted this last night, price of BTC has been pushing up very nicely!
After a redistribution phase where late buyers got wrecked at the top the market, we've seen price drop back down liquidating billions in buy orders in the past few weeks. I believe this Wave 4 shakeout will now be followed by another bull run, like we are seeing happen now.

Bitcoin (BTC/USD) Tests Key Support Within Downtrend ChannelBitcoin is attempting to stabilize after finding support at the lower boundary of a well-defined descending channel. The price has rebounded +5.44%, climbing back toward the $85,000 level, but remains below the 50-day SMA (94,968), which has acted as dynamic resistance.
Despite today's bounce, BTC remains in a broader downtrend, with both the MACD and RSI showing bearish momentum. The RSI at 42.82 suggests the market is still in neutral-to-weak territory, while the MACD remains in negative territory, confirming downside pressure.
Key Levels to Watch:
📉 Support: 77,000 (200-day SMA), 75,000 (trendline support)
📈 Resistance: 90,000 (mid-channel resistance), 95,000 (50-day SMA)
A breakout above the channel could signal trend reversal, while continued rejection at resistance would keep the bearish bias intact.
-MW

BITCOIN min target 95100 The max by all ew counts is 111/113 The chart posted is my work in BITCON I am sorry bitcoin . we dropped back to perfect math in a 3 wave decline so what next ?/ well if you go back to see my call in 2021 at 61800 5wave s up ending now . I then saw the 3 wave drop and called for a new high 68900 to 69400 based on B waves at 1.236 and 1.382 . So now what At most I see is another wave B The HOPE Wave I call it !! I maintain the Deflationary cycle in ALL ASSETS has begun . and will collapse into oct 10to the 20th 2026 . In wave B rallies they tend to show Maximum Optimism best of trades WAVETIMER . I maintain bitcon drops below 23 to 21k into 2026 oct
