Is BTC forming a Morning Start at TrendLine?Is BTC forming a Morning Start at TrendLine?
Can we expect a bull run?
Is it the right time to get a ride on?
BTCUSD.P trade ideas

Bitcoin - That you can't ignoreDo I want you to miss out on the opportunity? Subscribe, save the post, write comments - and let's make money togethers.

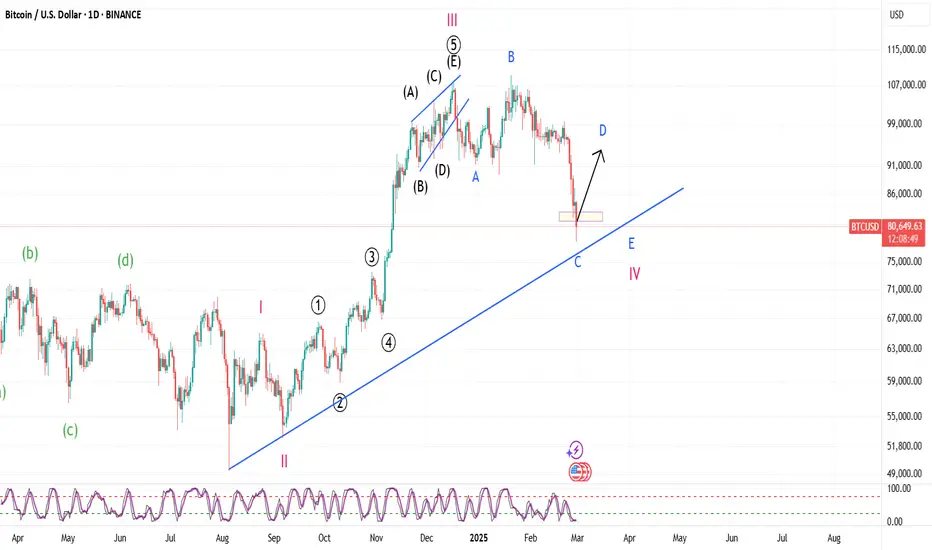
Reasons for and against a Push higher by Bitcoin SOON sin November 2022, PA has almost become predictable.
Running on a Pattern of Steps and Always paying attnetion to the Weekly MACD
I have posted in detail about the weekly MACD in other posts so I will not expain much now but here is the chart again, It explains itself really.
We are, once again, Waiting for the weekly MACD to reset to Neutral, were we hope it will bounce again. BUT, as you can see, a 3rd bounce would be unusual but , on this occasion, Highly probable
On the main chart, we can see that PA began running on a Rising trendline and, after ranging for a while, it bounced off it in Mid October 2023. It has Never returned to that line.
PA began Ranging again in March 2024. Note that date on the MACD chart. MACD Peaked and began turning Bearish and fell till it hit neutral in Sep.
At that same moment, in Sep 2024, PA bumped into the 50 week SMA ( RED) and bounced up to a New ATH in Dec 2024
So, we had 2 bounces after ranges, seemingly unconnected - until you look at the day count of each range.
1st -April 2023 to Sep 2023 - 196 days
2nd - March 2024 to Sep 2024 - 189 days
Now also note the Double Tops and then the retrace on Both those Range dates AND on the current Range
And so NOW, Currently, we are in a Range, again, MACD Peaked High and is falling Bearish
But this Range began in DECEMBER 2024
So why do we have a possibility of a push higher soon ?
Look where that RED 50 week SMA is - Just below PA.
Could PA Bounce of it if we bump into it ?
We have come VERY Close in recent days. The 50 is around 75500 - PA got to 76500
If PA touches it, I am sure we will bounce Higher
And so This leads us to why we may NOT bounce soon
I think the Bulls are trying to keep PA off the 50 till MACD is reset. If true, that 50 will level out.
PA will have to touch it BEFORE it begins to fall or PA will have to drop below 70K to reach it.
And THIS Leads us to what I think could Very well happen
IF PA were to have a bounce higher soon , maybe to Top of Range, around 109 ( but probably Lower) this would give PA room to drop back to Bottom of Range while MACD continues to Fall. A Quick push up , say over 10 days, would hardly effect the MACD reset but gives PA room to move without loosing to much more value, Keeping Market CAP stable and Sentiment happy
MACD is expected to reach neutral, at current rate of descent, around May / June.
And Look..that happens to be around 189 days since range began. The same approx day count as the previous 2 ranges this cycle.
We may see a drop lower this month, nothing is for sure but if we fall below that 50 SMA, I will be changing my Bullish Tune and Screaming CAUTION
All to play for in the next few months

BTC AND THE 200 MABitcoin is now facing resistance at the 200-day moving average (currently around $83,645). After bouncing from recent lows, price is struggling to reclaim this key level, which aligns with prior support turned resistance. A clean break above the 200 MA would be a bullish signal and could open the door for higher prices, but for now, this area is acting as a significant barrier.

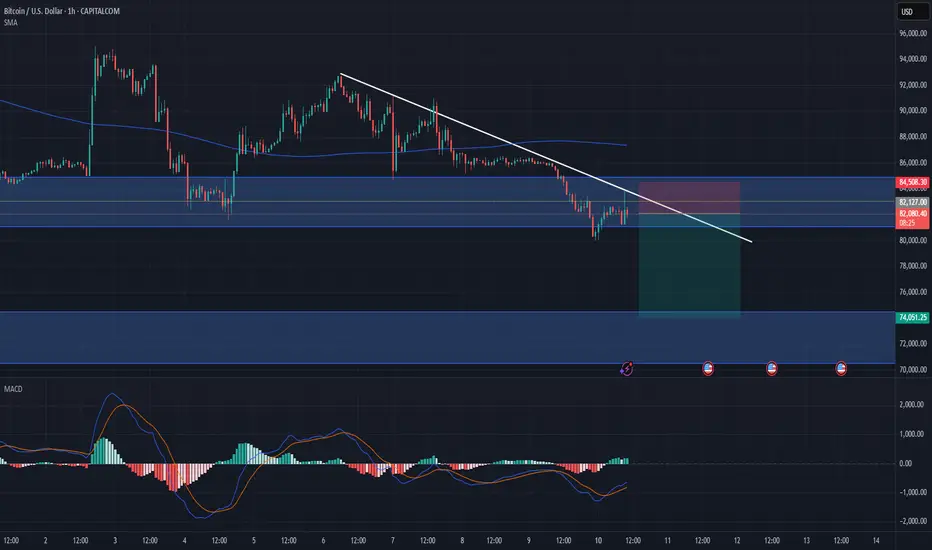
BTCUSD one more leg down to 74-70k rangeAlready in, SL and TP on the chart.
Will update if necessary
This could be a bitter end for BTC or an opportunity !!!Do you think this will happen, or do you see Bitcoin below $50K in the future?
Give me some energy !!
✨We spend hours finding potential opportunities and writing useful ideas, we would be happy if you support us.
Best regards CobraVanguard.💚
_ _ _ _ __ _ _ _ _ _ _ _ _ _ _ _ _ _ _ _ _ _ _ _ _ _ _ _ _ _ _ _
✅Thank you, and for more ideas, hit ❤️Like❤️ and 🌟Follow🌟!
⚠️Things can change...
The markets are always changing and even with all these signals, the market changes tend to be strong and fast!!

$BTC daily, attempting to avoid a death crossCRYPTOCAP:BTC recovered and is attempting to hold bottom trend line, push over 200 MA. If it can’t we will have a death cross, and likely move further down.

BITCOIN Money Supply, Dollar and Bonds pushing for MEGA RALLY!This is not the first time we publish a Bitcoin (BTCUSD) analysis in relation to the U.S. Dollar Index (green trend-line) or Chinese Bonds (red trend-line) and Global Liquidity (blue trend-line). In fact we have been doing this since the late 2022 bands in China and like the highly bearish sentiment that was in the market then, we decided to dive into this cross-asset analysis yet again in order to put the current sentiment in perspective.
Well it couldn't be more relevant. What we discovered is that all the financial assets mentioned above have yet again aligned to offer the strongest bullish confirmation for BTC since the November 2022 Bear Cycle bottom!
More specifically, we are a little past the point where the DXY peaks and declines aggressively, Global Liquidity bottoms and starts rising, while Chinese bonds (our CN02Y/CN20Y ratio) bottom and rise aggressively. In the past 10 years this combination of events has happened 6 times, 2 times during each Cycle: one at the bottom of the Cycle and the other when the final, most aggressive rally starts.
Notice also that (naturally) this is where the stock market (SPX, black trend-line) also bottoms and starts rising aggressively.
As a result, the above market conditions are an indication that despite the recent monthly correction and turbulence due to a number geopolitical and other trade fundamental reasons, the macro-economic parameters remain intact for the wider picture of this Cycle. Truthfully, this is where an announcement next week of future Fed Rate Cuts would come very handy.
So what do you think of this analysis above? Are you fearful that a new Bear Cycle is starting or more confident that the market will soon recover and price a new High? Feel free to let us know in the comments section below!
-------------------------------------------------------------------------------
** Please LIKE 👍, FOLLOW ✅, SHARE 🙌 and COMMENT ✍ if you enjoy this idea! Also share your ideas and charts in the comments section below! This is best way to keep it relevant, support us, keep the content here free and allow the idea to reach as many people as possible. **
-------------------------------------------------------------------------------
💸💸💸💸💸💸
👇 👇 👇 👇 👇 👇

Bitcoin - Bulls vs Bears: Who Will Win This Battle?Market overview:
Daily Timeframe
The daily chart is the foundation of this analysis, providing a macro perspective on Bitcoin’s current market structure. Price is trading between two critical zones, one acting as support and the other as resistance. These levels have historically played a significant role in Bitcoin’s price action, making them key areas to watch for potential breakouts or breakdowns.
Currently, Bitcoin has tested the lower support zone multiple times, showing that buyers are actively defending this level. However, each bounce has been met with selling pressure near the previous support-turned-resistance zone, which indicates indecision in the market. This price action suggests that Bitcoin is in a consolidation phase, where liquidity is building before a larger directional move.
There are two potential scenarios that will determine the next major trend:
Bullish Breakout:
If Bitcoin breaks above the resistance zone (the green-marked area on the chart), it would indicate a shift in market sentiment, with buyers taking control. This move would confirm that the recent downside movement was a temporary correction rather than a trend reversal. A clean breakout, followed by a successful retest of the level as support, would provide an ideal confirmation for a long position, targeting higher resistance levels.
Bearish Breakdown:
If Bitcoin loses the current support zone, it would confirm that sellers remain in control. A daily close below this level would likely trigger increased selling pressure, leading to a move towards lower support zones. In this case, a short position would be favored, with potential downside targets in mind.
Since price is still within this range, waiting for a confirmed breakout or breakdown is crucial before committing to a directional trade. Acting too soon, without confirmation, could lead to getting trapped in false breakouts or liquidity grabs.
4-Hour Timeframe – Liquidity Sweep & Bullish Reversal Signs
Looking at the 4-hour chart, Bitcoin has recently swept a major low, a move often associated with liquidity grabs. However, price did not close below this level, suggesting that the move was intended to trap sellers rather than initiate a true breakdown.
Liquidity sweeps occur when market makers push price below a previous low to trigger stop-losses and induce panic selling before reversing the price direction. This failure to break lower could be a sign that Bitcoin is gearing up for an upside move, but further confirmation is required.
1-Hour Timeframe – Key Level for a Bullish Breakout
The 1-hour chart further supports the bullish case, as it also shows a liquidity sweep of recent lows, similar to what was observed on the 4-hour timeframe. This confluence strengthens the idea that Bitcoin may be preparing for a move higher.
A key resistance level has been marked with a black line on the chart. This level represents the most recent structural high that must be broken and flipped into support to confirm bullish momentum.
Trading plan for a long position:
Break Above the Key High – Price must first move above the marked resistance level to signal strength.
Retest & Hold as Support – A successful retest of this level as new support would indicate that buyers are in control.
Entry for a Long Position – Once support is confirmed, a long position can be considered, targeting higher resistance levels.
If Bitcoin fails to break this level, the bullish thesis weakens, and attention should shift back to the daily support zone for potential bearish continuation.
Upcoming Bitcoin-Related News & Events to Watch
While technical analysis provides clear trade setups, macroeconomic events can heavily influence Bitcoin’s movement. Some key fundamental catalysts to watch in the coming days include:
CPI & Inflation Data (March 12, 2025) – Higher-than-expected inflation could negatively impact risk assets like Bitcoin, while lower inflation numbers could support a bullish breakout.
FOMC Meeting & Interest Rate Decision (March 20, 2025) – The Federal Reserve’s stance on interest rates will be crucial. A more dovish tone could provide a bullish tailwind for Bitcoin, while hawkish policy could lead to downside movement.
Final Thoughts
The daily range is the most critical structure to watch, whichever level breaks first will determine the trade setup.
The 4-hour liquidity sweep suggests potential bullish momentum but still needs confirmation.
The 1-hour key high must be broken and flipped into support before looking for long positions.
Macro events like CPI and Fed decisions could heavily impact Bitcoin’s movement.
__________________________________________
Thanks for your support!
If you found this idea helpful or learned something new, drop a like 👍 and leave a comment, I’d love to hear your thoughts! 🚀
Make sure to follow me for more price action insights, free indicators, and trading strategies. Let’s grow and trade smarter together! 📈

Selling?Morning folks,
So, Monday's plan has worked perfect, we're at 85K. Today we have to keep an eye on daily chart, where bearish grabber pattern might be formed and trigger downside action.
In general upside action is rather slow, so bearish context stands intact. We see only one risk for it - non-market driving factors, such as a D. Trump flood on X. But, this is out of our control.
That's why we keep everything as it is - 85K is considered for short entry. If we get daily bearish grabber also - all the better.
Next target stands around 74K

BITCOIN Is Very Bullish! Long!
Take a look at our analysis for BITCOIN.
Time Frame: 1h
Current Trend: Bullish
Sentiment: Oversold (based on 7-period RSI)
Forecast: Bullish
The market is on a crucial zone of demand 82,849.
The oversold market condition in a combination with key structure gives us a relatively strong bullish signal with goal 86,359 level.
P.S
Please, note that an oversold/overbought condition can last for a long time, and therefore being oversold/overbought doesn't mean a price rally will come soon, or at all.
Disclosure: I am part of Trade Nation's Influencer program and receive a monthly fee for using their TradingView charts in my analysis.
Like and subscribe and comment my ideas if you enjoy them!

Heading into 61.8% Fibonacci resistance?The Bitcoin (BTC/USD) is rising towards the pivot and could reverse to the 1st support which had been identified as a pullback support.
Pivot: 85,769.28
1st Support: 80,188.79
1st Resistance: 88,718.07
Risk Warning:
Trading Forex and CFDs carries a high level of risk to your capital and you should only trade with money you can afford to lose. Trading Forex and CFDs may not be suitable for all investors, so please ensure that you fully understand the risks involved and seek independent advice if necessary.
Disclaimer:
The above opinions given constitute general market commentary, and do not constitute the opinion or advice of IC Markets or any form of personal or investment advice.
Any opinions, news, research, analyses, prices, other information, or links to third-party sites contained on this website are provided on an "as-is" basis, are intended only to be informative, is not an advice nor a recommendation, nor research, or a record of our trading prices, or an offer of, or solicitation for a transaction in any financial instrument and thus should not be treated as such. The information provided does not involve any specific investment objectives, financial situation and needs of any specific person who may receive it. Please be aware, that past performance is not a reliable indicator of future performance and/or results. Past Performance or Forward-looking scenarios based upon the reasonable beliefs of the third-party provider are not a guarantee of future performance. Actual results may differ materially from those anticipated in forward-looking or past performance statements. IC Markets makes no representation or warranty and assumes no liability as to the accuracy or completeness of the information provided, nor any loss arising from any investment based on a recommendation, forecast or any information supplied by any third-party.

#BTC TO CONTINUE LOWER FOR NOWThe recent 'pump' due to Trump's announcement disappointingly only created a pullback to the previous area where a downtrend had already been triggered.
Looks like BTC will continue with the correction down to our next support level which sits at $67,792.
Once BTC gets to this level, we will either see a nice bounce off this support and we can continue higher or it's a possibility that we may continue even lower but will provide an update once we touch the next target.
We've currently down 23% from the top, let's be reminded that we've seen corrections as deep as -51% last cycle which are a healthy for the market!

DOUBLE SCENERIO ARE POSSIBLE ON BBTCUSDHere is the solid out look on bitcoin, the bear trend may continue when price bounce on the sell zone and the trend line. Also price might break the trend and retest it for upward continuation .Let's keep being realistic.

BTCUSD - Decision Time.As we see, price is at the white L-MLH.
This is a critical level.
On one hand, price showed weakness.
On the other hand, price is stretched to the downside, bearing the possibility to shoot upwards from here.
How can we find out what's happening?
By observation and NOT ACTING!
Just watch, observe, and a good entry Long or Short will uncover. FOMO is your greatest Enemy!
Calm down, wait for the sweet Fruits that will be given to you. §8-)

Bitcoin based on Elliott wavesHello, I expect the market to make a move in the form of wave D and then have a downward correction in the form of wave E, and then we can wait for the main market move.
BTCUSD STRONG DOWN FOR SURELY READ IN CAPTIONSThe chart shows Bitcoin (BTC/USD) on a 1-hour timeframe. The price has recently completed its target at 80,200, indicating a successful move towards the lower levels. The price is currently testing resistance around 83,000, forming a potential reversal pattern. A bearish move is expected, with the target set at 80,200. Traders should watch for a breakout below the support zone for confirmation of the downtrend, targeting 80,200 again.

Bitcoin (BTC/USD) - 1H Market Analysis📊 Bitcoin (BTC/USD) - 1H Market Analysis
🔹 Current Price: $82,867
🔹 Market Structure: Price approaching a key supply zone after bullish correction.
📍 Key Levels to Watch:
🟢 Supply Zone:
🔺 $84,747 - $85,531 (Potential Rejection Area)
🔻 Demand Zone:
🟢 $74,000 - $77,500 (High Probability Buy Zone)
📈 Bullish Scenario:
🔸 If BTC breaks and holds above $85,531, further upside potential may be unlocked.
📉 Bearish Scenario:
🔸 A rejection from the $84,747 - $85,531 zone could trigger a downward move towards $77,554 and $74,002.
💡 Trading Plan:
🎯 Sell Setup: Look for confirmations at the supply zone.
🎯 Buy Setup: Potential long entries at $74,000 - $77,500.
🎯 Risk Management: Set stop-loss based on key structure levels.
#Bitcoin #BTCUSD #CryptoTrading #FXFOREVER 🚀

Bitcoin in a falling wedge / bull pennant It’s hard to say where it will. Break up from ths pennant, I put the dotted measured line in an arbitrary spot which will almost certainly have to be readjusted and most likely further down than where I placed it but if it were to somehow break up from the wedge by then and confirm that breakout the target would be in the 145k zone. *not financial advice*

BTC Bullish Trade Setup with Entry PointsBTC set up for a bullish move
Setup for R/R over 4.4
Manage your risk. Don't trade your whole account. Trading is a game of the patient.
Check out the chart for Entry / TP / and SL
1 hour chart setup

BTC UPDATE!!!BTC Update: Rejection from Daily Bearish FVG
The current market has encountered a rejection from the daily Bearish Fair Value Gap (FVG), indicating a potential reversal in the upward momentum.
Key Insights:
- The rejection from the daily Bearish FVG suggests a shift in market sentiment.
- We anticipate a downward movement in BTC, targeting the $80,200 - $79,100 range.
Market Analysis:
The daily chart indicates a failed attempt to break above the FVG, leading to a potential bearish reversal. With this rejection, we expect sellers to regain control, driving the price towards the aforementioned support zone.
Trading Considerations:
- Short-term traders may consider positioning themselves for a potential downward move.
- Long-term investors should monitor the price action closely, adjusting their strategies as needed.
Stay informed and adapt to changing market conditions!

BTCUSDWassup!!! 🔥 As we all know, BTCUSD is taking a dive on the lower timeframes, so the play is to bag some short setups. 💰📉 And right here? This is where I see BTC tanking after a little retest. Stay locked in, move smart, and don’t get wrecked! 🚀💀 Risk is real, so don’t be throwing cash in blind! 💯
BTCUSDI mean, the charts speak for themselves! I've already told ya on numerous occasions... THEE GREATEST TRADER EVER IS HERE!!!! As you can see, I been in the Lab Cooking!!!! Bon Appetite
_SnipeGoat_
_TheeCandleReadingGURU_
#PriceAction #MarketStructure #TechnicalAnalysis #Bearish #Bullish #Bitcoin #Crypto #BTCUSD #Forex #NakedChartReader #ZEROindicators #PreciseLevels #ProperTiming #PerfectDirection #ScalpingTrader #IntradayTrader #DayTrader #SwingTrader #PositionalTrader #HighLevelTrader #MambaMentality #GodMode #UltraInstinct #TheeBibleStrategy
