BTCUSD.P trade ideas
Bitcoin for SavingsBitcoin with 21million total supply of coins is going to look cheap at this rate. Looking at the charts, Bitcoin is in a bullish trend and rising. VWAP is sitting at 100,899, so there is plenty of room to keep moving forward. It is still trending the bullish sentiment that we have been witnessing. Next stop, right at VWAP, then on to test 102,789.
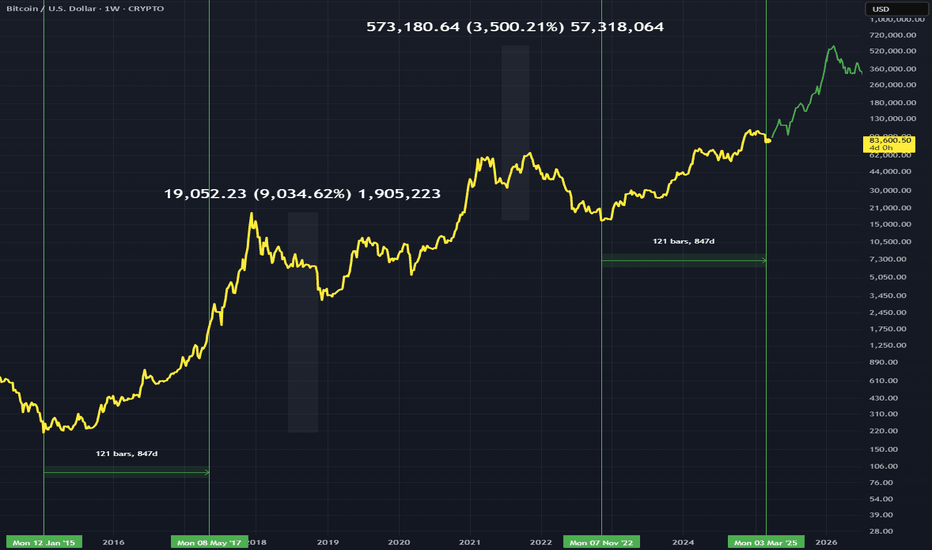
BTCUSD - If it is a Similar Situation to 2017If we are experiencing a similar run to 2017 we would be 847days into the bull run
I have shown the bars pattern for where price could go with the rest of the time left, which shows a 3500% gain this bull market. This is compared to the 2017 run which was a 9000% gain to the top.
We have some bull time left is the take away if the runs are comparable.
Weekly chart.
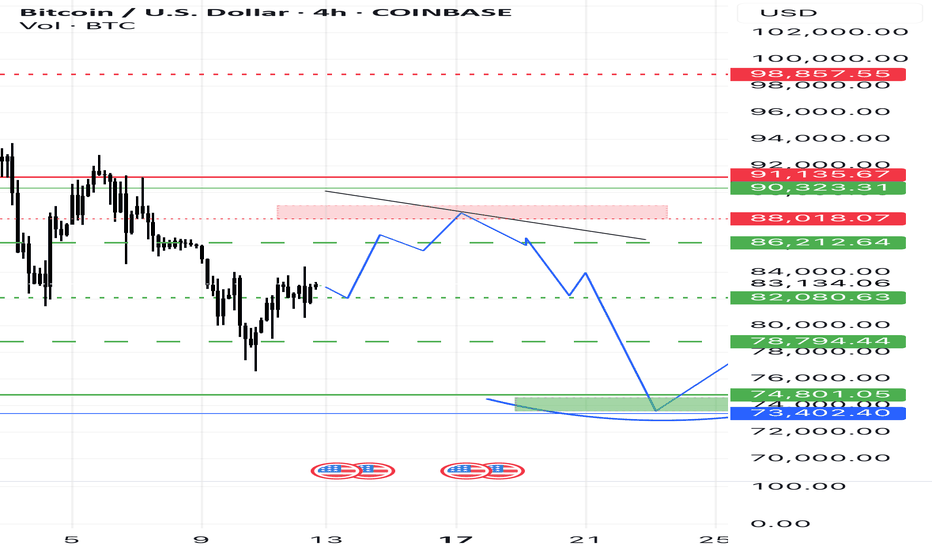
BTCUSD SURELY DOWN Counter-Analysis (Disrupting the Bearish Outlook)
Bullish Continuation Instead of Rejection
If BTC breaks through the resistance zone near $87,792 instead of reversing, it could aim for $92,305 or higher.
A breakout with strong volume could lead to a new uptrend rather than a drop.
Strong Demand at Support Levels
The suggested bearish drop assumes that support levels will fail, but BTC could see significant buying pressure around $78,000–$74,000.
If buyers step in aggressively, the price may consolidate and push higher rather than continue downward.
Higher Low Formation Instead of Breakdown
The chart suggests BTC will drop below $70,000, but if it forms a higher low above $75,000, it could confirm an uptrend instead.
Trendline support or moving averages could prevent a deep correction.
Fundamental Factors Supporting BTC
Macroeconomic conditions, ETF inflows, or institutional demand could prevent a major sell-off.
If the Federal Reserve signals dovish policies, BTC could stay strong rather than droP
Weekly Support is around 80000.Weekly Support is around 80000.
However, 72500 - 73000 is its previous
breakout level & probably a Best Buying Rage
(if it touches) which is also a Confluence area of
Trendline Support+Important Fib. level.
Bullish Divergence on Shorter Time Frame +
Weekly Support around 80000 (if Sustained)
may push the Price up towards 87000 &
then around 95000 - 96000.
Ultimate Resistance is around 110000.
Crossing this level may open new Highs
Targeting around 136000.
On Shorter Timeframe, 85000 - 86000 is
the Immediate Resistance & Support is
around 80000.
Bitcoin in correction phaseWave 4 price is currently shoeing, with a target range of 72000-73000. Looking for a buy opportunity at 73000. Uptrend confirmation requires a close above 92000.Keeping a close eye on that 73000 level then. Gotta be quick on the trigger if it dips down there. Don't want to miss the boat if it bounces. Setting an alert for 73000 just to be sure. Still cautious though, that 92000 close is the real confirmation we're looking for. Until then, it's a calculated risk. Might even consider a tight stop-loss just below 72000 to manage potential downside if this wave 4 ain't finished correcting. Patience is key here, don't want to jump the gun. Waiting for that setup.
Bitcoin - The Uptrend Remains 100% Valid!Bitcoin ( CRYPTO:BTCUSD ) can create a textbook break and retest:
Click chart above to see the detailed analysis👆🏻
Over the past couple of weeks we have only been seeing a consolidation on all cryptocurrencies, governed by the slow movement on Bitcoin. With today's drop Bitcoin is now approaching the previous all time highs, which are now acting as a major support, pushing price much higher.
Levels to watch: $70.000, $300.000
Keep your long term vision,
Philip (BasicTrading)
Predicting sell off, 30"++ in advance of a head and shouldersLet's examine how a head and shoulders is usually formed by a wave 4 and 5 and an A & B wave, the C wave is the sell off after the head and shoulders.
I use this pattern to predict a head and shoulders AT THE RIGHT NECKLINE. In this case 90 minutes in advance.. So 6 X 15 minute candles in advance we can predicted a H & S and a selloff, sound valubale?
if you understand this concept please give a thumbs up.
To go over price action again, we are going up on 5 waves. Wave 4 creates the left shoulder. After wave 5 we come down on an A wave, that is the right neckline.
This is where You can predict an B wave UP, and if it doesn't go higher than the previous wave 5, we will get a typical head and shoulder sell off after the wave B up.
BTC 30m Long: Bullish reversal pattern forming, targeting BTC Long Opportunity on 30m Chart
A bullish reversal pattern is forming on the 30m chart, indicating a potential long opportunity. The recent downtrend has shown signs of exhaustion, and buying pressure is starting to build.
Key Levels:
- Entry: $
- Target: $
- Stop Loss: $
Technical Analysis:
- The Relative Strength Index (RSI) is oversold, indicating a potential bounce.
- The Moving Average Convergence Divergence (MACD) is showing a bullish crossover.
- The chart is forming a higher low, indicating a potential trend reversal.
IT IS NOT Financial Advice
THATS MY ANALYSIS


