BTC long IdeaTook a loss on the previous trade but as discussed this is a higher support. if this does not hold up i will wait for a short of the daily resistance level. happy trading everyone.
33
BTCUSD.P trade ideas

BITCOING BROKE SUPPORT - GOING TO 82,112Not a rally yet my friends. It may have looked like a trend would go up and hopefully break 87,500 for our next push upward; however, too much weakness in the market and it broke support so we are headed lower. (My personal perspective)

Stablecoin liquidity = Bitcoin bullish thesis --> $109k?Can BTC soon climb to the $109,000 level thanks to stablecoin liquidity? Maybe yes!
An increase in stablecoin market cap often signals more money entering the crypto space, indicating bullish sentiment as investors prepare to deploy capital. This increased liquidity can lead to smoother trading and attract more participants, potentially driving up Bitcoin's price.
The chart clearly illustrates this relationship:
Purple line ( CRYPTOCAP:USDT + CRYPTOCAP:USDC + CRYPTOCAP:DAI + CRYPTOCAP:USDEE market cap) shows steady growth
Bitcoin candle chart ( COINBASE:BTCUSD price) follows with more volatile increases
Blue line at the bottom: BTC and stablecoin correlation coefficient of 0.9 😊
This correlation can serve as a leading indicator for Bitcoin price movements. During downturns, investors might sell Bitcoin for stablecoins, but as sentiment shifts, this "dry powder" can quickly flow back, driving Bitcoin's price up.
Adding to that, the long-term correlation coefficient between stablecoin liquidity market cap (USDT+USDC+DAI+USDE) and Bitcoin is 90%. So, yes, there's a strong long term correlation and usually BTC and stablecoin liquidity converge.
According to my views on the stablecoin liquidity, the Bitcoin price should target the $109k level.
Last time I made this analysis, Bitcoin jumped from $58k to my price target of FWB:73K in the span of 2 months.
Let me know your thoughts.

86K for another short sellMorning folks,
So, not occasionally we said in previous 2-3 updates that BTC action doesn't look bullish and we suggest a new nosedive. Now we have bearish engulfing pattern on weekly chart . And consider these two Fib levels for another short entry attempt. Of course, 86K would be just perfect, but it could start earlier. One of the possible shapes we consider a downside butterfly.
In general, re-test of 70-73K area on average fits to our long-term view.
In a case if 86K will be broken, it could mean that market is tending to 93.5K target, based on daily AB=CD pattern . But we consider this scenario as less probable due on overall BTC heavy performance in a recent few weeks.
Thus, for now, if you want to make a scalp long trade, you could try, but better to set initial target not higher than 86K.
Our major scenario is bearish and we consider 84K and 86K Fib levels for accumulation of a bearish position, unless something extraordinary will happen.
Profit to everybody, Peace.

BITCOIN new All Time High is a certainty.Bitcoin / BTCUSD found excellent support on the 1week MA50 and is staging a full force recovery.
According to the Time Cycles, it sits between the 0.786 and 1.0 Fibonacci levels. That's hostorically the Final Year of the Cycle.
All Fib stages have been fairly similar among those Cycles so if it continues to be that consistent, we should expect the price to rise now non-stop towards the end of the year and price a new All Time High.
Follow us, like the idea and leave a comment below!!

90-91K Short setup updateMorning folks,
So, today we need just 1H chart as not many events happened. In a recent two weeks people start making upside revisions on BTC price, based on recent JPow comments on QT contraction.
We agree that it has some reasons and supportive to BTC, but they forget that GDP forecast was cut, while inflation increased, which points on stagflation signs.
This is the reason why we do not want to overestimate the positive effect of QT contraction. We still think that BTC could show the pullback to ~70K area.
Now we have three different patterns that point on this level. Since our last update we've got the flag consolidation, that suggests upside continuation. AB-CD based pattern also point on 90-91K area.
So, we still keep our idea to consider shorts around 90-91K area

Bitcoin: tariffs and inflationFor one more week investors were not happy with developments over trade tariffs and inflation expectations. The US equity markets finished the week in red, and BTC was just following the general sentiment. During the first half of the week, BTC was trying to reach higher grounds, above the $ 88K, however, the new stories regarding tariffs and especially Friday's University of Michigan inflation expectation sentiment of US consumers, brought another sell-off day. The BTC ended the week at the level of $82,4K.
The RSI tried to breach the 50 level in order to start a path toward the overbought market side, however, the indicator ended the week at the level of 44. At this moment, it is questionable whether the market is eyeing the oversold market side for one more time. It is more likely that the investors are uncertain which side to trade. Significant developments are also with MA50 and MA200 lines, which are converging toward each other for some time now, pointing to a probability of a cross within a few weeks from now. This time, it will be a so-called dead cross, implying a BTCs potential for further decrease in value.
Current charts are showing a potential for BTC to move toward both sides during the week ahead. On an upside, there is some probability for the levels above $85K, but not higher from $86K. On the opposite side, the support line at $80K might easily be the first stop of BTC in the week ahead. However, this is not a long term significant level, so in case that $80K is reached, the BTC will not spend too much time testing it. It should be considered that NFP and unemployment data for the US will be posted, so volatility will most probably continue also in the week ahead.

BTC heads up at 89.6k: minor Covid fib that might end our bounceBTC broke above our Golden Genesis fib at 85.3k.
Now pushing towards a minor Covid fib at 89.6k.
This fib may end bounce and retest the 85k zone.
==================
Previous Plots below
==================
85k zone to break;
105k top Call:
73k previous top:

The Global BTC Shake out is coming before 1 million BTC in 2037I believe it worth stating that we might be in a moment where bitcoin is gonna shake everyone out and make everyone sell or at least all those who think 1 million BTC is coming soon. The great Bitcoin reset cycle will occur eventually before true mass adoption... we could very well retest $15,000 as bottom sometime next year.. if true BUY and hodl and invest consistantly for a whole decade and reap the reward of a 1 million bitcoin probably in 2037-38 and Bitcoin by then will be nearly on par with golds market cap by then or below it. And youll become among the weathiest of the wealth.

BTCUSD Trade Recap & Weekend Outlook This weekend, BTCUSD showed signs of continued bearish momentum after a clean break and retest of the support zone turned resistance. The market respected both structure and fib confluences, giving a great R:R opportunity on the short side.
🔹 Trade Breakdown:
First short position was stopped at -50 pips, but setup remained valid.
Re-entry aligned with bearish confirmation, hitting a +100 pip move on the downside.
Price is now printing a lower high and appears to be preparing for further downside continuation.
📍 Technical Highlights:
Price rejected the 0.236 fib zone and failed to reclaim the prior support.
Market is respecting a bearish channel from the higher time frame.
Next potential target zones lie around the 82,000–81,000 region if momentum continues.
🧠 Note: This analysis is for educational purposes only. Always use proper risk management and confirm trades with your own strategy.

Bitcoin From 1hr povBitcoin from the 1hr pov ( trade last 1 or 2 days) will bounce but don't expect much of it cause the Daily still in confirmed downtrend. Make some money and get out or just wait for a good move once the 4hrs gives us the long signal probably in about 3 to 5 days. stay tune.

BTC LONG TP:84,000 31-03-2025Bitcoin is currently presenting a promising bullish formation around the 84,000 mark on both the 1-hour and 2-hour timeframes. This suggests a strong upward momentum developing in the short term. Furthermore, over the next 3 days, we are observing a super bullish setup that indicates the potential for prices to reach between 90,000 and 95,000 by April.
These developments offer an exciting opportunity for traders looking to capitalize on the upward trend. Be sure to follow me closely as we navigate these market movements together and continue to generate profits!

Bitcoin- Short term recovery?As you know, I am bearish on Bitcoin in the long term. However, in the short term, the cryptocurrency could see a recovery.
Yesterday, the price tested the 81,000 support zone once again and rebounded from that level. Now, Bitcoin is pushing against the 83,500 resistance, and I believe a breakout is likely.
If that happens, we could see further gains, with 86,500 as the next key target for the bulls.
In conclusion, I’m bullish on BTC in the coming days and will be looking to buy dips.

Bitcoin - Please Just Listen To The Charts!Bitcoin ( CRYPTO:BTCUSD ) remains in a bullish market:
Click chart above to see the detailed analysis👆🏻
Despite literally everybody freaking out about cryptos lately, big brother Bitcoin is still creating bullish market structure. During every past cycle we witnessed a correction of at least -20% before we then saw a parabolic rally. So far, Bitcoin is just doing its normal "volatility thing".
Levels to watch: 70.000, $300.000
Keep your long term vision,
Philip (BasicTrading)

BTCUSD technical analysis This move possible after retirement.BTCUSD Forecast and technical analysis H1 Time Frame next move possible. After this level retestment. Not financial advice.

BTC Today's strategyYesterday, the fluctuations of BTC were within the scope of our analysis. Taking all aspects into consideration, we can continue to execute the plan of buying around $81,500. When the price drops to around this level, it often attracts a large number of buying orders to enter the market, thus forming a relatively strong supporting force that drives the price to rebound. Secondly, from the perspective of technical analysis, when the price corrects to $81,500, some technical indicators such as the Relative Strength Index (RSI) are expected to show oversold signals, which will further confirm the buying value of this position.
Although we are optimistic about the price increase of BTC today and have provided the best entry position, the digital currency market is highly uncertain and risky. Investors need to stay vigilant at all times, pay close attention to market dynamics, and manage risks properly.
btcusdt
buy:81500-82000
sell:84500-85000
We share various trading signals every day with over 90% accuracy
Fans who follow us can get high rewards every day
If you want stable income, you can contact me

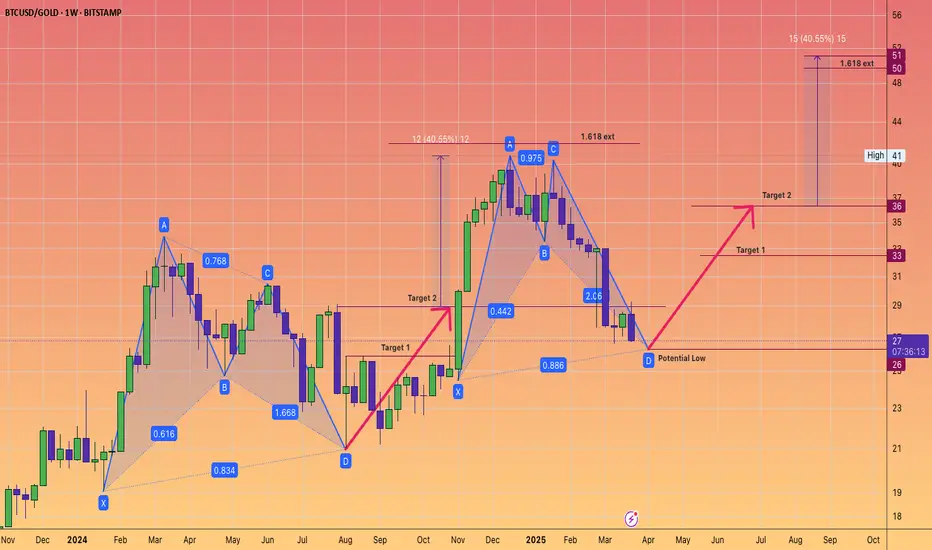
Bitcoin harmonic pattern. Back to back Gartley. BTCGOLD ratio.The BTC/GOLD ratio has experienced a significant correction, currently standing at 27 gold ounces per 1 Bitcoin, down from a peak of 41, representing a decline of 34%.
Gold, priced at $3,114 in US Federal Reserve notes, is in a sustained bull market.
It is reasonable to anticipate that the digital equivalent of gold will gain traction once gold stabilizes at a higher price point.
The Gartley pattern is recognized as the most prevalent harmonic chart pattern.
Harmonic patterns are based on the idea that Fibonacci sequences can be utilized to create geometric formations, which include price breakouts and retracements.
The Gartley pattern illustrated indicates an upward movement from point X to point A, followed by a price reversal at point A. According to Fibonacci ratios, the retracement from point X to point B is expected to be 61.8%.
At point B, the price reverses again towards point C, which should reflect a retracement of either 38.2% or 88.6% from point A.
From point C, the price then reverses to point D. At point D, the pattern is considered complete, generating buy signals with an upside target that aligns with points C and A, as well as a final price target of a 161.8% increase from point A.
Often, point 0 serves as a stop-loss level for the entire trade. While these Fibonacci levels do not have to be precise, greater proximity enhances the reliability of the pattern.
Will these consecutive Gartley patterns succeed in bolstering Bitcoin's strength? We will soon discover the answer.
Buy now BTCUSDFibonacci Retracement Levels
The chart uses Fibonacci retracement from a low of around $60,290 to a high of $107,187 to find potential support and resistance levels.
Key levels:
0.236 (23.6%) at $96,119 (resistance)
0.382 (38.2%) at $89,272
0.5 (50%) at $83,738 (current price zone)
0.618 (61.8%) at $78,205 (strong support)
0.786 (78.6%) at $70,326
Current Price Action
BTC is currently trading around $83,361.
It has retraced to the 50% Fibonacci level, which is often seen as a critical zone for trend continuation.
Trend Projection
A downward trendline was broken, suggesting a possible trend reversal.
A bullish move (red arrow) is projected, targeting the green resistance box around $116,000 - $120,000.
The price needs to break above $89,272 and $96,119 to confirm this upward move.
Key Takeaway
If BTC holds above the 50% retracement level and continues upward, it could be aiming for a new high.
If it fails, it may retest the $78,205 or $70,326 support levels before another attempt at breaking out.

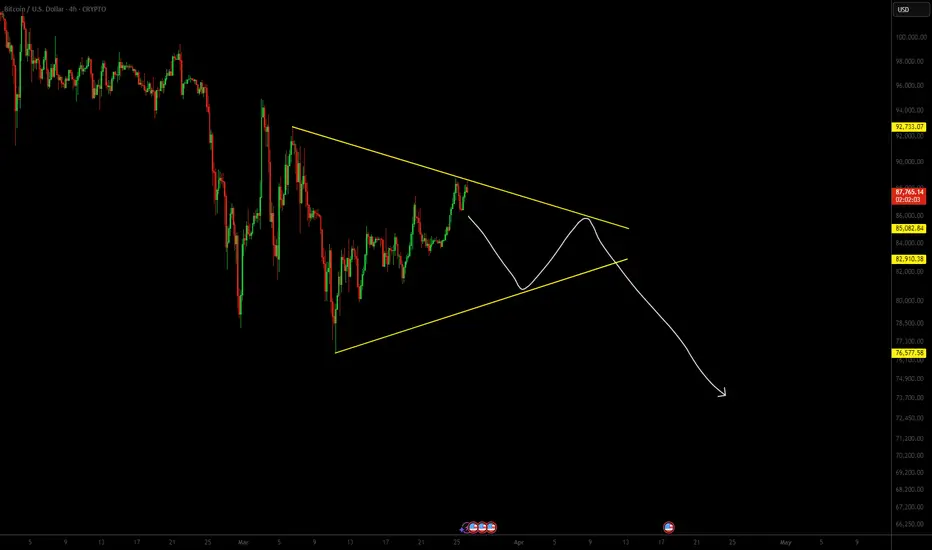
BTCUSD SHORT📉📊 BTC/USD – Calm Before the Storm? 📊📉
Bitcoin (BTC/USD) remains in a downtrend, forming LL - LH structures. Currently, it’s making a short-term bullish correction, approaching a key resistance zone. 🚀 However, a strong sell-off could be just around the corner! 🔥
📌 Expected Scenario:
🔹 Price moves towards the SPLINE1, forming a channel ⚡
🔹 Big players may start taking profits, triggering bearish momentum 🚨
⚠️ The market always surprises! Wait for confirmation signals before jumping in too early. Stay sharp! 🧐
#BTCUSD #Bitcoin #CryptoTrading #Bearish #PriceAction 📉🔥

March 26 Bitcoin Bybit chart analysisHello
It's a Bitcoinguide.
If you have a "follower"
You can receive comment notifications on real-time travel routes and major sections.
If my analysis is helpful,
Please would like one booster button at the bottom.
This is a 30-minute Bitcoin chart.
There is no Nasdaq indicator announcement today.
With the purple finger on the left,
I connected the long->short switching section in the existing strategy.
4-hour chart MACD dead cross imprint released.
The short-term pattern is broken and Nasdaq is moving sideways.
*Long position strategy when the red finger moves.
1. 87,141.5 dollars long position entry section / cut-off price when the green support line is broken
2. 89,177.2 dollars long position 1st target -> Top 2nd target
For those who are maintaining a short position,
Check if it breaks through the pink resistance line
The 1st section at the top and the 2nd section at the bottom are sideways sections. In particular, the first section at the top is the resistance line section of the Bollinger Band daily chart, and since it is pressed, adjustments can occur when touched.
Therefore, even if a rebound occurs at the red finger 87.1K,
if the daily candle is created tomorrow,
it should touch the first section 89.1K at the top to open the resistance line,
so that it can safely rise to the top section, right?
Since the mid-term pattern is broken from the green support line deviation,
it must unconditionally succeed in the rebound,
and it would be good to operate while watching the Nasdaq movement.
Up to this point, I ask that you simply refer to and use my analysis,
and I hope that you operate safely with principle trading and stop loss prices.
Thank you.

Bitcoin Intraday Analysis – Triangle Formation Developing?In today’s analysis, we are focusing on Bitcoin’s intraday price action, where a potential triangle formation appears to be taking shape. However, more data is needed to confirm this pattern. From a non-biased perspective, price action is still projecting lower highs, and for a bullish shift to occur, we need to see a transition into higher lows.
Currently, Bitcoin is testing the 0.618 Fibonacci level, which aligns with dynamic support/resistance (SR) resistance. If a rejection is confirmed, it could lead to a liquidity sweep at lower levels, ultimately testing dynamic SR support. This would further validate the triangle formation, providing an equilibrium zone for price to break out of.
Key Takeaways:
• Bitcoin remains in a lower high structure, needing a shift to higher lows for a bullish transition.
• Price action is testing the 0.618 Fibonacci retracement, which aligns with dynamic SR resistance.
• A confirmed rejection could lead to lower levels, testing dynamic SR support and reinforcing the triangle formation.
• Volume remains low, and a breakout will need increasing volume to be considered valid.
At this stage, Bitcoin is likely to remain range-bound in equilibrium unless a breakout occurs in the next few hours. If no breakout materializes, price action will likely continue to trend towards dynamic SR support. Traders should monitor volume levels closely, as an increase in volume will indicate a true breakout direction.
BTC -- BearishBTC bearish believe it should drift down to around 67k ish according to price action, and pattern

Bearish on Bitcoin (BTC) – Target Price: ~$70,000Technical Analysis:
The provided chart illustrates Bitcoin's (BTC/USD) current position within a descending channel, marked by red resistance and green support lines. The series of lower highs, indicated by the red arrows, reinforces the prevailing bearish momentum. A potential breakdown from the current trading level of approximately $85,079 could lead to a decline toward the green support line, aligning with a target price around $70,000.
Fundamental Analysis:
Recent developments provide additional context to this bearish outlook:
Market Sentiment: Betting markets suggest that Bitcoin has likely peaked for the year, hovering just above its January high of $109,000.
Macroeconomic Factors: Concerns over President Trump's tariff policies and broader economic conditions have contributed to Bitcoin's recent decline. Analysts warn of further downside risks due to ongoing uncertainties in global trade and inflation.
Trading Strategy:
Entry Point: Consider initiating a short position on BTC at the current price of approximately $85,079.
Target Price: Set a price target of $70,000.
Stop-Loss: Implement a stop-loss order at $88,000 to manage potential upside risk.
