Solana Vs Bitcoin: New All-Time High In Late 2025Solana vs Bitcoin has not been bullish since March 2024 and is about to go bullish now after more than a year of no growth. It went sideways first and then it produced a crash but finally, the market found support.
What we have here is simply awesome because there is no better trade than to trade a

Sol Extremely Bullish FractalHi
Please click like
So this is as fractal from previous bull run in 2021, and used the same fibonacci targets for this bull run.
The chart here is SOLBTC, so if peak on this chart is 0.01BTC and BTC today is 100K =
SOL 1k.
If BTC peak is 200K -> Sol is 2K... etc.
----
This is a dreamy target

Sol/BTCHi, I wouldn’t want to be in Sol right now. It’s draining in sats. Janover wants to buy up Solano as a reserve asset, and become the “Strategy” of Sol. I think this is a major error in judgement, and the failure of such a ploy, a coin at #7 in the total marketcap, to put such a shitcoin up agai

SOL in Accumulation?COINBASE:SOLUSD
When taking a look at the strength of Solana compared to Bitcoin, there are clues on the 4HR chart that suggest SOL may be in accumulation, rather than further continuation to the downside.
Price is currently in the 1:272 ratio band of a larger time frame. On March 10th price hit

$SOL/BTC Will CRYPTOCAP:SOL build strong dominance beside CRYPTOCAP:BTC ? As we know CRYPTOCAP:SOL is a top pick by many, and can eventually become something like CRYPTOCAP:ETH price wise.

4H SOLBTC [R:r 5:1] long the pullback by March 3rd or 4thSolana is going to pullback to the 4H support line before moving up. We are extremely oversold on the daily RSI and this along with the bullish news means that once the consolidation and correction after the Trump Strategic Reserve hype dissolves, we will resume our bullish SOLBTC pattern. Keep a st

SOL vs BTC has triggered a Head and Shoulders.LA Vape Cabal
Donald Trump
Dave Portnoy
Libra
The band of thieves operating on Solana has stripped away all the opportunities for retail investors. Their relentless stealing has created a bitter experience for newcomers, while the veteran retail investors are barely hanging on.
The SOLBTC chart cl

Wave5 in making against BTCWe been consolidating for over 9 months, wave4 retrace 0.5 (0.0018) become strong support at this point. Now can be used as soft stop at this point.
Shall we break above peak of wave3, 1.272 target around 0.0035 and 1.618 around 0.0043 will become zone of interest for wave5. We simply revisit peaks

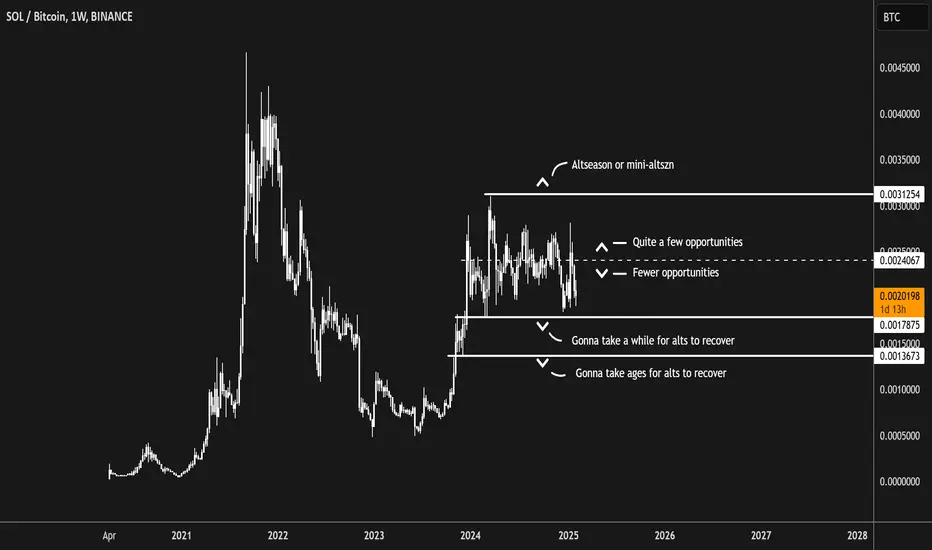
SOL/BTC as a ProxyMore readable than the BTC.D or TOTAL3 chart (it includes stables and is lagging).

See all ideas
Summarizing what the indicators are suggesting.
Oscillators
Neutral
SellBuy
Strong sellStrong buy
Strong sellSellNeutralBuyStrong buy
Oscillators
Neutral
SellBuy
Strong sellStrong buy
Strong sellSellNeutralBuyStrong buy
Summary
Neutral
SellBuy
Strong sellStrong buy
Strong sellSellNeutralBuyStrong buy
Summary
Neutral
SellBuy
Strong sellStrong buy
Strong sellSellNeutralBuyStrong buy
Summary
Neutral
SellBuy
Strong sellStrong buy
Strong sellSellNeutralBuyStrong buy
Moving Averages
Neutral
SellBuy
Strong sellStrong buy
Strong sellSellNeutralBuyStrong buy
Moving Averages
Neutral
SellBuy
Strong sellStrong buy
Strong sellSellNeutralBuyStrong buy
Displays a symbol's price movements over previous years to identify recurring trends.