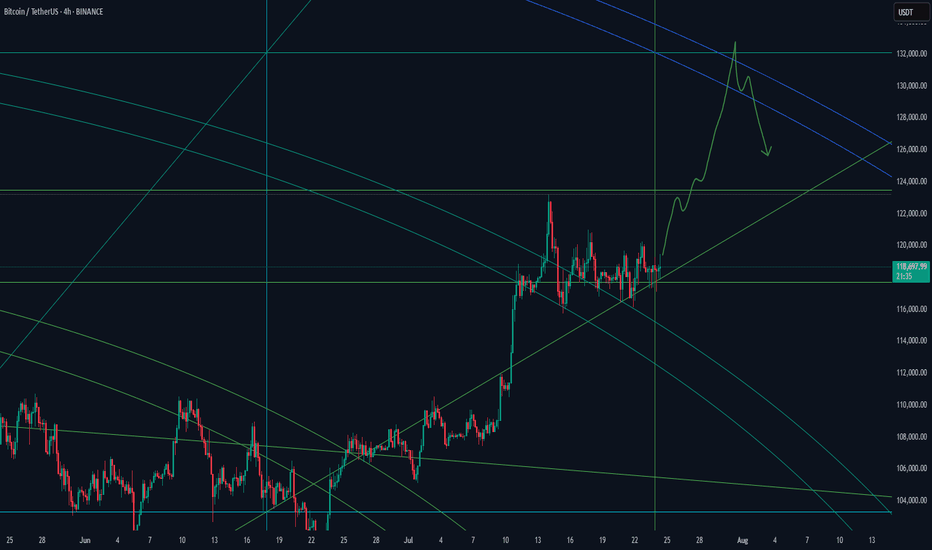
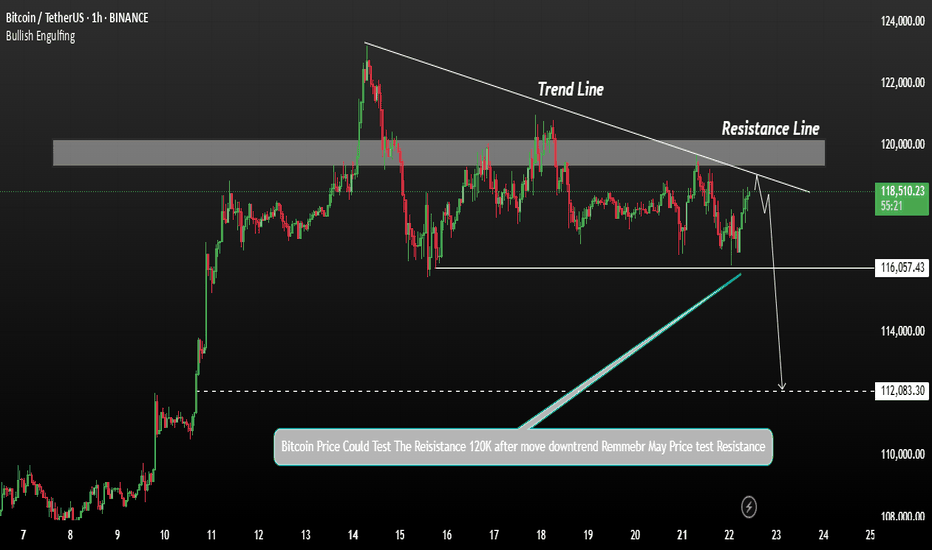
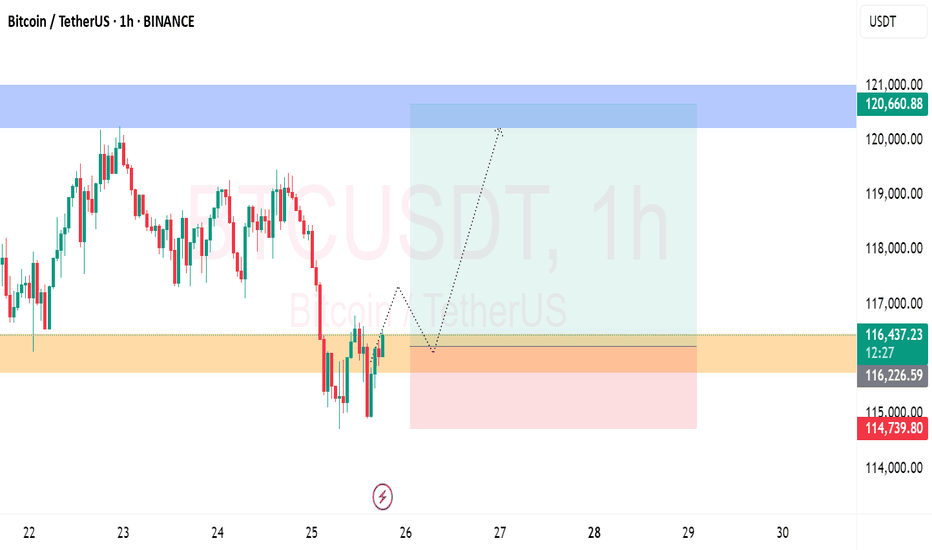
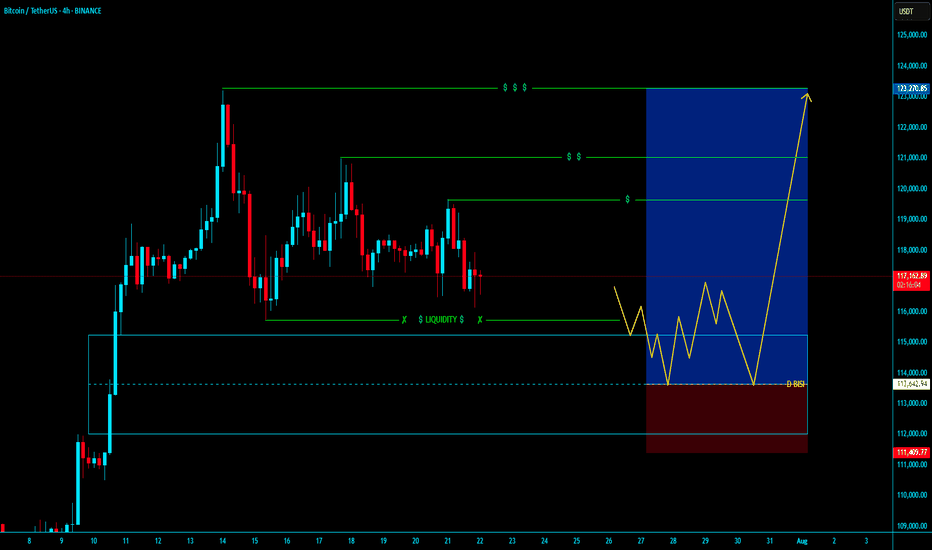
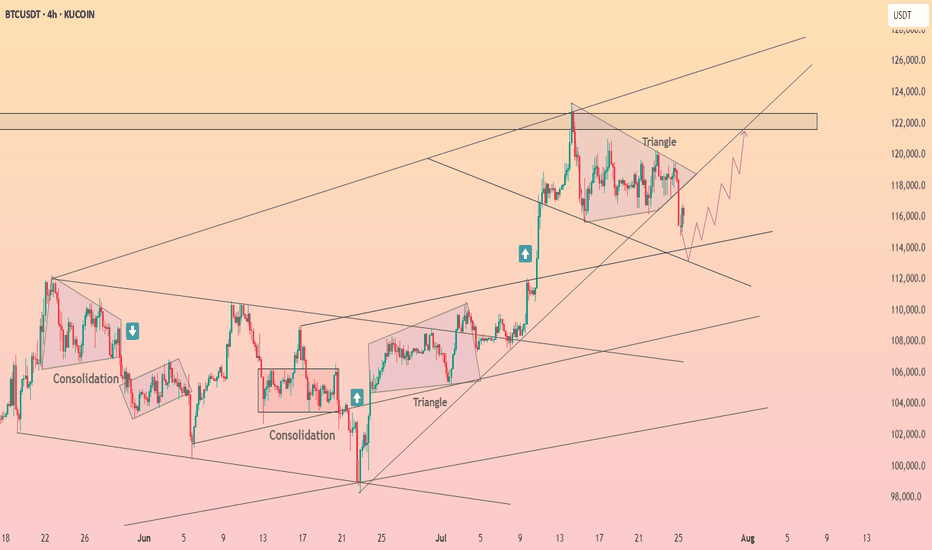
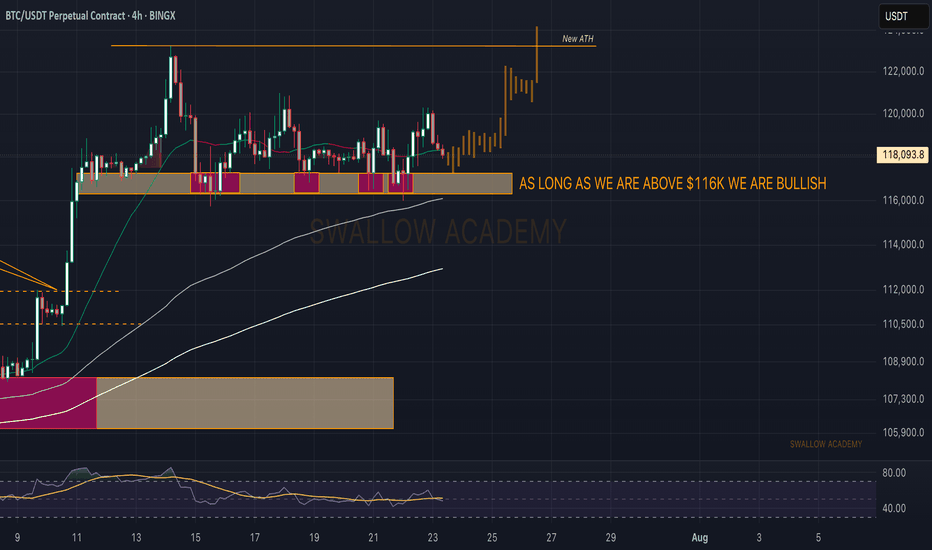
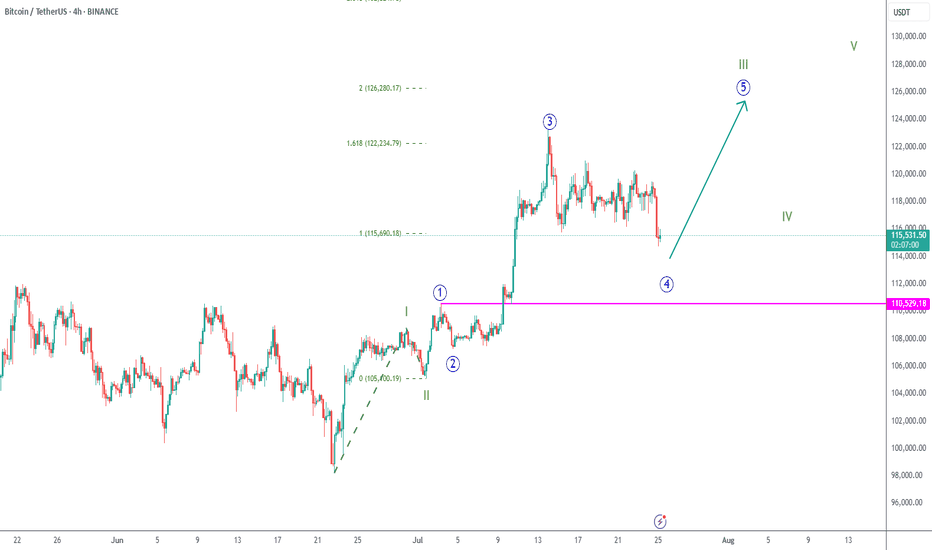
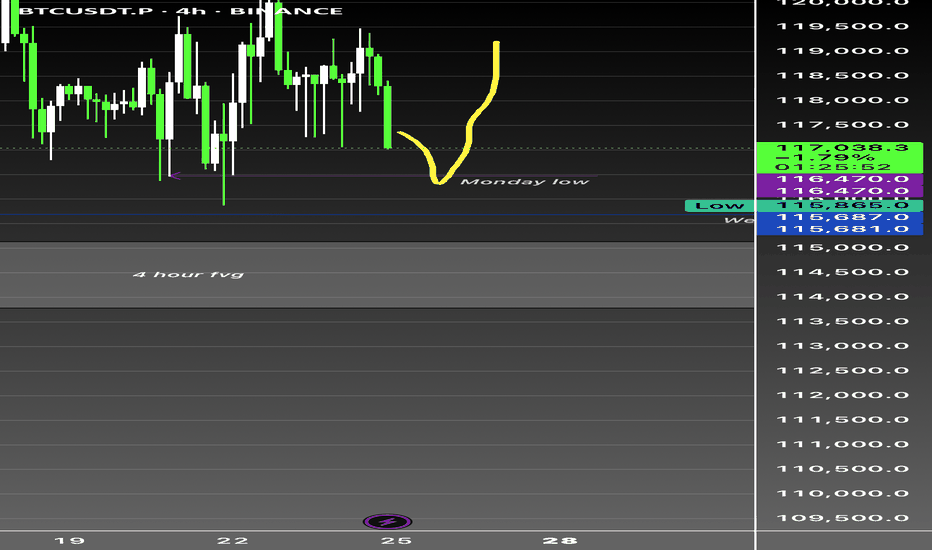
BTC RAINBOW ON THE HORIZON This structure of BTC shows that it may either break the arc upwards confirming more BULLISH trend or will be rejected by the arcby CryptoGoat_01220
Bitcoin long setup📈 Bitcoin Long Setup 🚀 🔹 Entry: $97,803 🔹 Stop Loss: $96,892 (-0.93%) 🔹 Take Profit: $101,676 (+3.70%) 🔹 Risk/Reward Ratio: ~4.0 Bitcoin has broken out of the descending channel and is now testing key resistance levels. If momentum continues, we could see a push towards $100K and beyond. 🎯 📊 EMAs aligning bullishly, confirming trend strength. Watching for a retest and confirmation before further upside. What do you think? Will BTC break $100K soon? Drop your thoughts below! 👇🔥 #Bitcoin #CryptoTrading #BTC #LongSetup #TradingViewLongby Ehsan_payahou2
Bitcoin has been accumulating momentum for a long time The daily chart of Bitcoin shows a volatile upward trend. The current price is $97,761.84, with a daily increase of 0.27%. It can be observed from the chart that Bitcoin has experienced a round of strong rise since the fourth quarter of 2024, breaking through the previous downward channel. After forming a breakthrough point in November, it opened a clear upward channel. At present, the price of Bitcoin is running near the middle track of the rising channel, and the lower support level is roughly around $91,644, which has been supported by buying many times. The upper short-term resistance level is between $106,660 and $107,455. These two price levels are the stage highs formed in the previous two rises, indicating that there is strong selling pressure in the market in this area. From a technical perspective, Bitcoin is currently operating in the rising channel, and the price is close to the middle track of the channel. If the price further breaks through and stabilizes the $100,000 integer mark, it is expected to challenge the upper track of the channel at $112,000. Judging from the future trend forecast path marked on the chart, there may be two development scenarios in the market: Strong breakthrough: If the price of Bitcoin can break through the key pressure zone of $100,000, it is expected to quickly rise to $105,000 or even $110,000. Oscillating callback: If the price fails to break through $100,000 under pressure, it may fall back to the lower track support of the channel in the short term, that is, the $91,000 to $95,000 area. Once the support is confirmed to be valid, it may launch another upward attack. In addition, the longer-term red rising trend line, which forms a resonance support with the lower track of the channel, further consolidates the buying power below. This means that even if there is a short-term callback, as long as it does not fall below the trend line, the overall upward trend of Bitcoin remains intact. Fundamentally, the market pays close attention to the upcoming Bitcoin halving event in 2025, and this positive factor further strengthens the market's bullish sentiment. At the same time, the continuous entry of institutional investors has enhanced the liquidity of the Bitcoin market and the price fluctuation range has converged compared with previous years. In summary, Bitcoin is currently in a strong upward channel. In the short term, we should pay attention to the breakthrough of the $100,000 pressure. If it breaks through, it is expected to start a new round of rising market. If it encounters resistance and pulls back, we need to pay attention to the support strength of the $91,000 to $95,000 range. Investors can flexibly adjust their holding strategies according to market performance, buy on dips near the channel support level, and pay attention to risk control to cope with possible sharp fluctuations in the market.Longby RonPeter_Trading1
BTCUSDA surge on BITCOIN as it has already reacted to the OB. Which is the low of the previous weeks candle .............Watch how it reacts to the IFVG as it accumulate more orders for long Longby D_Market_Maker2
BTC's Potential Up to 77K & Down to 130K? Here’s WhyBINANCE:BTCUSDT has both bullish and bearish scenarios in play now. These days, the crypto market has been stagnant—no real pump, no real dump. 🔻 If it drops, how low will it go? There’s a potential multiple-top pattern. If CRYPTOCAP:BTC breaks below the neckline at $92,000 with volume—or fails to reclaim it—then the target drop sits at $77,000. 🚀 If it pumps, how high can it go? A potential multiple-bottom pattern is forming. If MARKETSCOM:BITCOIN breaks above the neckline at $107,000 with volume—or successfully retests it—then the target is $130,000. 🔥 Short-term strategy The Feb 3rd candle had significant volume and has been a key resistance level multiple times. This makes it a strong reference point for entries. (See orange & light blue arrows.) 1️⃣ Long Setup Entry trigger: $102,500 (Feb 3rd high) Stop loss: $91,231 (Feb 3rd low) 2️⃣ Short Setup Entry trigger: $91,231 (Feb 3rd low) Stop loss: $102,500 (Feb 3rd high) 💡 Prices vary across exchanges. Use the prices from your trading platform. 🔴 Read my signature & publications for more info you don’t want to miss. 🔥 for more future script "guesses" like this!by Harold_1232
Bitcoin is expected to fallDiamond pattern + The price of bitcoin is struggling to stay above the critical $100k mark, and analysts are starting to sound the alarm over changing economic factors. Amid the broader market downturn, cryptocurrency trader Jason Pizzino warns that the likelihood of a bitcoin crash is increasing. He highlights key market indicators, such as falling interest in bitcoin and declining trading volume, that suggest the bearish trend is gaining momentum. But he's not the only one, saying that Peter Brandt and Robert Kiyosaki have also recently issued similar warnings. Pizzino is noticing warning signs in the marketplace Analyzing the blood trail, Jason Pizzino, a well-known cryptocurrency trader, believes that bitcoin is showing clear signs of weakness. He points out that interest in bitcoin is waning, as seen in Google Trends data. Fewer and fewer people are searching for bitcoin and cryptocurrency, with bitcoin searches dropping to 24 out of 100 and the total number of cryptocurrency searches dropping to 12. This suggests that the hype around cryptocurrency is waning, which often leads to lower prices. Translated with DeepL.com (free version)Shortby Timofei81827DE6
BTCUSDT 4H - Update✅ #BTCUSDT 4H - Update 📊 4-Hour Timeframe Analysis Bitcoin is currently in a neutral trend on the 4-hour timeframe. 🔹 Support Level: $90,000 🔹 Resistance Level: $108,000 💡 Key Points: 🔸 The closer we get to the $90,000 support level, the more attractive the buying opportunity becomes. 🔸 The closer we get to the $108,000 resistance level, the more attractive the selling opportunity becomes. ——————————————————— 📢 Analyst: @MohsenHasanlu 📅 Date: 2025/02/04by Mohsen_HasanluUpdated 2
not confident, but yes I am still bullishThe chart looks low confidence bullish. This looks like the chart that just goes straight up after you press play on a tradingview idea. From a fundamental standpoint, I think BTC will still get a bid from ETFs, from countries, etc. From a technical standpoint, we are near a bid cluster. This doesn't mean we cannot break down, but this is starting to look okay (lower confidence bullish pattern recognition). Longby r900001
BTC/USDT: Between 94K and 100K, the Market Must DecideTechnical Context and Multi-Timeframe Trends • Short-Term vs. Mid-Term Divergence Several indicators (MA, Ichimoku, RSI, etc.) highlight a divergence between short-term timeframes (1H to 4H, which are mostly “Down”) and longer-term timeframes (12H, 1D, and even Weekly, which are in an “Up” trend). The market is currently in a state of hesitation; shorter timeframes show exhaustion, while the broader trend remains bullish. • Key Support Zone: 94–95K USDT On intraday charts (2H–4H), this level emerges as a critical support, confirmed by AVWAP (loVWAP) and liquidation clusters. This is the key pivot zone for any short-term buying strategy. A confirmed breakdown (especially on 4H/1D close) could open the door to 92K or even 90K USDT. • Major Resistance: 98–100K USDT Several technical elements make this area difficult to break: • Daily moving averages (e.g., MA 50, Ichimoku Kijun). • Recent highs tested without a clear breakout. • New selling blocks identified (indicating resistance from short sellers). • Longer-Term Perspective If BTC climbs above 98–99K and confirms on a daily close, the probability of an extended move toward 105–110K increases, given the identified liquidation clusters and open interest positioned higher. On the other hand, a rejection below 98K would prolong the consolidation, increasing the risk of a deeper retracement below 94K. Key Indicators Analysis 1. MTFTI (Multi-Timeframe Trend Indicator) • Short-term (1H, 2H, 4H): “Down” or “Neutral.” • Medium and long-term (12H, 1D, 1W): “Up.” • Overall average (AVG): “Neutral” (reflecting an undecided market). 2. ISPD Div Pro • In 2H/4H, Investor Satisfaction (white line) is near 0.15–0.16, indicating a potential rebound zone. • In daily charts, the value rises to ~0.60, signaling a more neutral-to-bearish stance. • Interpretation: Buyers may attempt an entry on lower timeframes if support holds, but higher timeframes do not yet confirm an extreme oversold condition. 3. HPI (Hybrid Pressure Index) • On 4H, the index is at 89, approaching a potential local overbought level. • On 1D, it drops to around 30–35, closer to an oversold zone. • This contradiction suggests that short-term markets may pull back, while the daily timeframe could still support a later bullish move. 4. Koncorde Divergence • Asymmetrical readings across timeframes. • On 4H, the “Azul” zone dominates (often linked to institutional buying). • On 1D, “Verde” (red) is stronger, indicating profit-taking. • The lack of agreement between timeframes reflects the current “all-or-nothing” sentiment in the market. 5. Mason’s Line Indicator • 2H/4H: Green Satisfaction > Blue SMA → potential bullish signal. • 8H/1D: Green line below its moving average → suggests a slowdown or consolidation. Trading Scenario & Risk Management 1. Bullish Scenario (Rebound): • If the price holds above 94–95K , a rally toward 98–100K remains possible. • A confirmed daily close above 98–99K would reinforce the case for an upward move toward 105–109K . 2. Bearish Scenario (Breakdown): • A 4H/1D close below 94K signals caution. • A potential wick to 92K or even 90K is possible due to the liquidation clusters. • Below 89–90K , a deeper correction could unfold. 3. Trade Management: • Aggressive traders may look for bounce signals at 94–95K (RSI divergences, ISPD at 0.15, etc.). • Conservative traders should wait for a breakout above 98–99K for a safer momentum-driven entry. Conclusion The BTC/USDT market is in a high-risk zone, with major support at 94–95K USDT and strong resistance at 98–100K USDT . Technical indicators vary across timeframes, suggesting a possible short-term rebound, but without strong confirmation on daily timeframes. If support breaks, a drop to 92K–90K could materialize. Conversely, if 98–99K is reclaimed, BTC could extend gains toward 105–110K . Key Technical Levels to Watch: • Immediate Support: 94–95K • Lower Support: 92K (potentially 90K ) • Resistances: 98–100K , then 105K+ Given the current market uncertainty, a clear signal on the 4H/Daily timeframe will be the key trigger for any decisive trading action.by Ox_kali3
BTC's Potential Up & Down Price Target (Short-Term)BINANCE:BTCUSDT has both bullish and bearish scenarios in play now. These days, the crypto market has been stagnant—no real pump, no real dump. 🔻 If it drops, how low will it go? There’s a potential multiple-top pattern. If CRYPTOCAP:BTC breaks below the neckline at $92,000 with volume—or fails to reclaim it—then the target drop sits at $77,000. 🚀 If it pumps, how high can it go? A potential multiple-bottom pattern is forming. If MARKETSCOM:BITCOIN breaks above the neckline at $107,000 with volume—or successfully retests it—then the target is $130,000. 🔥 Short-term strategy The Feb 3rd candle had significant volume and has been a key resistance level multiple times. This makes it a strong reference point for entries. (See orange & light blue arrows.) 1️⃣ Long Setup Entry trigger: $102,500 (Feb 3rd high) Stop loss: $91,231 (Feb 3rd low) 2️⃣ Short Setup Entry trigger: $91,231 (Feb 3rd low) Stop loss: A$102,500 (Feb 3rd high) 💡 Prices vary across exchanges. Use the levels from your trading platform. 🔴 Read my signature & publications for more info you don’t want to miss. 🔥 for more future script "guesses" like this!by Harold_1232
Will Bitcoin Rise in Late March or Early April? Possible Scenari Currently, Bitcoin is entering a highly unique cycle where it’s attracting almost the entire market capitalization and staying at elevated levels. This contrasts with previous cycles when altcoins had more distinct opportunities, causing frustration for holders of large altcoin positions. Bitcoin moved from the 27k level to form a peak, corrected down to 59k, then rallied to 107k to form a second peak on the monthly timeframe. At this point, Bitcoin appears to be starting a corrective wave within the larger uptrend structure. Based on the current downtrend structure from the weekly (W) timeframe downward, here are two potential scenarios for Bitcoin: Scenario 1 🔸 The price undergoes a correction, but it’s short-lived and soon reverts to the uptrend. Specifically: 🔹 A drop to around the 88k zone, followed by a minor rebound 🔹 Another correction down to the key levels of 83k or 75k 🔹 If a bottom forms at one of these zones, price could start a new upswing on the weekly chart, aligning with a fresh monthly uptrend Timing: 🔸 Potentially in the first two weeks of April 🔸 If things move faster, it could happen in the last two weeks of March Target: 🔸 A new all-time high (ATH) near 130k–140k Scenario 2 🔸 The price drops to the 75k zone, accumulates there but fails to continue upward, instead forming a lower low. Specifically: 🔹 A further drop toward 68k–70k, or slightly lower 🔹 If this unfolds, Bitcoin might not rally in March or April 🔹 The corrective phase could extend into May–June 2025, after which the market completes its accumulation Target Post-Accumulation: 🔸 A new peak near the previous level of 110k Trading Approaches in the Current State of Bitcoin For Traders (Futures / Margin): 🔸 Look for SELL swing opportunities 🔸 Scalp BUYs at key support/resistance zones For Spot Investors: 🔸 Identify critical zones to accumulate BTC 🔸 During corrections, watch for short-term bounces to buy select altcoins on spot and aim for profits of about 50%, 80%, or even 150% 🔸 Use the Rainbow MG3 indicator to screen a broader list of assets and filter for strategic spot buy entriesShortby rainbow_sniperUpdated 1
#BTC reaches overlapping support zone, beware of rebound📊#BTC reaches overlapping support zone, beware of rebound⚠️ 🧠From a structural perspective, the highs are falling and the lows are falling, so we are still in this downtrend. But we just touched the overlapping support zone, so there is an expectation of rebound, be cautious about bearish! A more accurate bullish signal can focus on whether the long structure here is established. ➡️From a graphical perspective, we formed a descending wedge near the support zone, and we generally start to rise according to this model. Let's see👀 🤜If you like my analysis, please like💖 and share💬 BITGET:BTCUSDT.P Longby wolf_king8884
Lingrid | BTCUSDT mid-term PRICE Action PerspectiveBINANCE:BTCUSDT continues to consolidate below the 100,000 level. Over the past couple of days, the market has been printing doji candles, indicating indecision. Following a false break of the resistance zone, the market is now moving sideways. When we take a step back, we can see that the price has not achieved a 1/3 correction of the bullish move that occurred from August 2024 to January 2025. I believe the market will likely continue this sideways movement and may retrace to the area below 90,000 before rising to higher levels. A deeper pullback would be beneficial for the market, as it would create an opportunity to move to those higher levels. My mid term goal is resistance zone around 107,000 Traders, if you liked this idea or if you have your own opinion about it, write in the comments. I will be glad 👩💻Longby Lingrid6633
Is BTC Gearing Up for a Bullish Reversal? Here’s My Game Plan!👀 👉 In this video, we analyze BTC, which is currently rangebound. On the 4-hour chart, I’m noticing equal lows followed by a liquidity sweep, then a higher low and a higher high. If Bitcoin breaks above the current range high, I’ll be looking to buy. However, if it trades lower, breaks the range low, and fails a retest, a short setup would be more suitable. We’ll cover trend analysis, price action, market structure, and both bullish and bearish scenarios. Not financial advice.03:28by fxtraderanthony3319
BTC ready for LONGWe're waiting for confirmation on breakout in Bitcoin/USDT. But we can't say it will go upwards before confirmation, there's a possibility of going down for hard liquidations on GETTEX:92K before upwards.Longby Freknah991
Daily Market Outlook: BTC & Forex Setups (#3) | CPI ImpactBefore jumping into today’s analysis, let’s quickly revisit yesterday’s key event – the CPI report. As expected, it triggered a major sell-off in both crypto and stock markets. 📌 BTC Daily – Bulls Still Holding the Line? Despite the heavy selling pressure and low volume, BTC managed to close above the $95K support level yesterday. 📊 Key Observations: Sellers dominated, but buyers are still holding ground within this daily range. No confirmed breakdown below $95K, so yesterday’s short scenario is invalidated. Market remains extremely volatile, making clean trade setups difficult. 📌 Plan: Sitting out of crypto today until we get a clearer structure. 📊 DXY – Time-Based Correction or Breakdown Incoming? The Dollar Index (DXY) is currently in a time-based correction and testing a key support at 107.372. 📊 Potential Scenarios: ✅ If support holds, we might see DXY push higher, adding pressure to risk assets. ❌ If it breaks down, expect further declines toward 105.692 and possibly 103.451 (Fib levels). 📌 Bias: Short-term bearish, but cautious due to the overall uptrend. 📉 USD/JPY – Short Setup in Play? USD/JPY has completed its corrective phase within a major downtrend and seems to be resuming its bearish momentum. 📊 Key Trade Setup: 🔹 Short Entry: 153.391 (if triggered) 🔹 Take-Profit Zone: 152.473 support If momentum continues, this could be a clean short opportunity. Final Thoughts & Risk Management ⚠ Market is still choppy—wait for clear confirmations before entering trades. ⚠ FOMO is your worst enemy, risk management is your best friend. 💬 I’m Skeptic, and I’ll see you tomorrow with another market breakdown! 🤍 ⚠ Disclaimer: These trade setups are based on my personal analysis and are not financial advice. If you don’t have a solid risk management plan, these triggers may not be suitable for you. Always do your own research (DYOR) and trade at your own risk. 💡by SkepticWise112
Bitcoin short back to $94000I just recently opened a bitcoin short. I think the market will likely dump back down to $94000 today in an attempt to make new lows. I think thats most likely what the bears want to do as they are still in control. Potential early exit at $95000 area. Will start to scale out at $94500 if trade goes according to plan.Shortby Filnft1
BITCOIN - Time to buy again!As you can see, the price is forming two bullish patterns on the daily timeframe, If my view is correct, btc will rise to 120k . And if this pattern is correct and breaks, higher targets are possible. Give me some energy !! ✨We spend hours finding potential opportunities and writing useful ideas, we would be happy if you support us. Best regards CobraVanguard.💚 _ _ _ _ __ _ _ _ _ _ _ _ _ _ _ _ _ _ _ _ _ _ _ _ _ _ _ _ _ _ _ _ ✅Thank you, and for more ideas, hit ❤️Like❤️ and 🌟Follow🌟! ⚠️Things can change... The markets are always changing and even with all these signals, the market changes tend to be strong and fast!!Longby CobraVanguard4482
BTCUSD Daily Chart For Long TermI think BTC trend after a bear trend will be upward to 125000 $.by bhabibi5
BITCOIN - Long Analysis The crypto market is gearing up for a significant surge, with Bitcoin poised to skyrocket to $111,000 in the near future. This upward momentum is expected to continue, potentially reaching $125,000 by summer. As Bitcoin's dominance begins to wane, altcoins are poised to break out, with Ethereum leading the charge. The BTC.D chart indicates a critical resistance level, hinting at a drop to 48% and paving the way for altcoins to shine. Now is the time to invest in carefully selected altcoins, and the potential for growth is vast. Join the conversation and share your favorite altcoin to receive a personalized analysis and stay ahead of the curve in the crypto market.Longby LegendaryTomUpdated 5
Next Volatility Period: Around February 16 Hello, traders. If you "Follow", you can always get new information quickly. Please click "Boost" as well. Have a nice day today. ------------------------------------- USDT and USDC are both renewing their ATH. I think the gap increase of USDT and USDC is a sign of funds flowing in. Therefore, we can see that a lot of funds are flowing into the coin market. (BTC.D 1M chart) If BTC dominance rises above 62.47, altcoins are likely to show a larger decline, so you should think about a response plan for this. The rise in BTC dominance means that funds in the coin market are concentrated toward BTC. BTC dominance does not mean that BTC is rising or falling. (USDT.D 1M chart) The rise in USDT dominance is likely to lead to a decline in the coin market. If USDT dominance rises above 4.97, the coin market is likely to plummet. Also, it is likely that it is already in a downward trend. - Why is it falling when funds are flowing into the coin market? I think it's because there's been a lot of upside, so it's expensive to buy now and profit taking is happening. BTC is still in an ambiguous position to say that the downtrend has started. I think that in order for the downtrend to start, it needs to fall below the Fibonacci ratio point of 1.618 (89050.0) and show resistance. - (BTCUSD 1D chart) What we need to pay attention to is the trading volume. If the price falls as the trading volume increases, it is likely to lead to further declines. In other words, the possibility of continuing the downtrend increases. - (BTCUSDT 1D chart) I think indicators such as Bollinger Bands or Price Channels well express the nature of returning to the mean by forming a channel and confirming the convergence and divergence of the channel. Currently, since it is maintaining a state of falling below the lower line of the Price Channel indicator, it shows that the force to fall is strong, and at the same time, it shows that the force to return to the mean is getting stronger. Accordingly, if it rises above the lower line of the Price Channel indicator and maintains the price, it is expected to quickly return to the mean. The currently set Price Channel indicator uses the MS-Signal indicator as the median, so the key is whether it can rise above the MS-Signal indicator and maintain the price. - The newly added indicator this time is the StochRSI 50 indicator. The most commonly used interpretation of the StochRSI indicator is the movement when it leaves the overbought or oversold zone. However, as I mentioned earlier, the basic principle of the chart is regression to the mean, so the 50 point of the StochRSI indicator has an important meaning. Therefore, it is judged that when the StochRSI indicator passes the 50 point, it is likely to act as support and resistance. However, since the StochRSI indicator is located at both ends of the price candle as an auxiliary indicator, it may be difficult to intuitively see and interpret, so it was added to the price chart. - Due to this decline, the HA-High indicator on the 1W chart is likely to move from the 94742.35 point to the 97226.92 point. Accordingly, the existing 97461.86 point is expected to play an increasingly important support and resistance role. Therefore, when the MS-Signal (M-Signal on the 1D chart) indicator falls to around 97461.86, the key is whether the price can rise and be maintained around that level. - This volatility period is expected to continue until February 10. The next volatility period is expected to be around February 16 (February 15-17). - If the price falls while trading spot, it is not a good idea to wait without taking any action because you are at a loss. However, if you respond too hastily, you may suffer double losses due to volatility, so you need to be careful. Therefore, you need to check the point where you can realize profits in the big picture and have the mindset to sell a portion of the purchase principal at any time. For this, I provide the MS-Signal indicator, BW (100), and HA-High indicators as representative indicators in my chart. The fact that BW(100) and HA-High indicators were created means that it has fallen from the high point, so it means that the indicator point is likely to be the resistance point. Therefore, it means that when it shows resistance near the indicator point, it is the time to sell in parts. Since the MS-Signal indicator is an indicator for viewing trends, a drop below the MS-Signal indicator means that the trend is likely to turn downward. If you sell some of the coins when these indicators show resistance and buy back the amount sold when the price drops, the number of coins (tokens) you hold will increase. Ultimately, the longer the investment period, the greater the profit will be. I call this method increasing the number of coins (tokens) corresponding to profit, or increasing the quantity. If you sell the amount corresponding to the purchase principal in this way, the number of coins (tokens) corresponding to profit will eventually remain, and this will be in a state where the average purchase price is 0. If you increase the number of coins (tokens) with an average purchase price of 0 in this way, you will always be in a state of profit even if there is a large volatility. Then, you will be able to conduct transactions more stably. At this time, what you need to pay attention to is the average purchase price provided by the exchange. You should ignore this and conduct transactions based on the purchase price. - Thank you for reading to the end. I hope you have a successful transaction. -------------------------------------------------- - Big picture I used TradingView's INDEX chart to check the entire range of BTC. (BTCUSD 12M chart) Looking at the big picture, it seems that it has been maintaining an upward trend following a pattern since 2015. That is, it is a pattern that maintains a 3-year uptrend and faces a 1-year downtrend. Accordingly, the uptrend is expected to continue until 2025. - (LOG chart) As you can see from the LOG chart, the uptrend is decreasing. Accordingly, the 46K-48K range is expected to be a very important support and resistance range from a long-term perspective. Therefore, we expect that we will not see prices below 44K-48K in the future. - The Fibonacci ratio on the left is the Fibonacci ratio of the uptrend that started in 2015. In other words, it is the Fibonacci ratio of the first wave of the uptrend. The Fibonacci ratio on the right is the Fibonacci ratio of the uptrend that started in 2019. Therefore, this Fibonacci ratio is expected to be used until 2026. - No matter what anyone says, the chart has already been created and is already moving. How to view and respond to this is up to you. When the ATH is updated, there are no support and resistance points, so the Fibonacci ratio can be used appropriately. However, although the Fibonacci ratio is useful for chart analysis, it is ambiguous when used as support and resistance. This is because the user must directly select the important selection points required to create Fibonacci. Therefore, since it is expressed differently depending on how the user specifies the selection points, it can be useful for chart analysis, but it can be seen as ambiguous when used for trading strategies. 1st : 44234.54 2nd : 61383.23 3rd : 89126.41 101875.70-106275.10 (Overshooting) 4th : 134018.28 151166.97-157451.83 (Overshooting) 5th : 178910.15 ----------------- by readCryptoUpdated 13
Recovery On Cards*BTCUSDT:* Expect recovery towards 99,962 and 101,967. Support in 96,717 and 95,256. Risk under 94,713Longby triggershark15
BTC buyA simple entry method Previous low take out A break of previous structure A creation of internal liquidity 🥃 close to order block Market have been ranging and is giving some little movesLongby Krasa_TA1