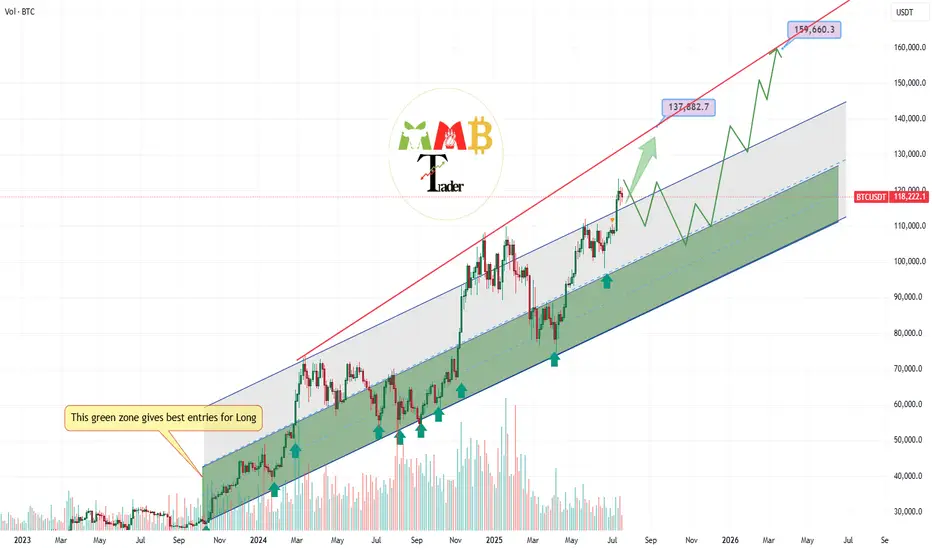
BTCUSDT Forming Bullish WaveBTCUSDT is currently forming a bullish wave pattern, signaling a potential continuation of its upward momentum. This technical setup suggests a series of higher highs and higher lows, indicative of strong buyer demand and consistent market optimism. With volume remaining robust, the foundation for a significant breakout is solid. If the pattern plays out, analysts expect a 09% to 10% gain in the mid to long term, which could be fueled by renewed institutional interest and global adoption.
Bitcoin has historically responded well to bullish wave formations, often leading to aggressive rallies once key resistance levels are breached. As the largest cryptocurrency by market cap, BTCUSDT not only reflects investor sentiment in Bitcoin itself but also often sets the tone for the broader crypto market. The current price action shows consolidation with positive volume spikes, which further supports the bullish thesis and provides a potential launchpad for another major leg upward.
With increasing attention on macroeconomic shifts, regulatory developments, and halving cycles, Bitcoin continues to position itself as a hedge against traditional market uncertainties. The bullish wave pattern now forming could signal that Bitcoin is entering a new phase of growth, especially as global interest in decentralized finance, ETFs, and blockchain innovation surges.
Traders and long-term investors alike should closely monitor this structure. A breakout with volume confirmation could offer an excellent entry point, backed by strong technicals and a solid fundamental backdrop. The combination of a bullish pattern and broader adoption trends makes BTCUSDT one of the most watched assets in the market right now.
✅ Show your support by hitting the like button and
✅ Leaving a comment below! (What is You opinion about this Coin)
Your feedback and engagement keep me inspired to share more insightful market analysis with you!
BTCUPUSDT trade ideas

BTC NEW VOLUME TREND 122KThis is a small time frame update, where BTC can try to target 22K again in the coming time frames. Since the last 15H breakdown volume, BTC can enter new uptrend volume
From the box level, there is a good chance for a new uptrend.

A bearish 12 Month candle could be in the cardsBitcoin made an yearly high of 20% after 6 months in on the yearly candle
This does not make me feel great about the rest of the year
a clear sell signal would be an higher timeframe close under 100k after an upthrust to new ath around 110k - 120k
around 50k-54k for me is an good buy level to build an longterm position:
0.382 fib retracement for an primary 1-2 wave
0.500 fib retracement from the 25k low
0.886 fib retracement from 49k low
50% pullback from current high to projected low
where will bitcoin go ? i don't know, but i do know where i want to buy and when i want to sell

BTC Triangle Consolidation: Ready for TakeoffBTC is gearing up for its next move following a triangle consolidation
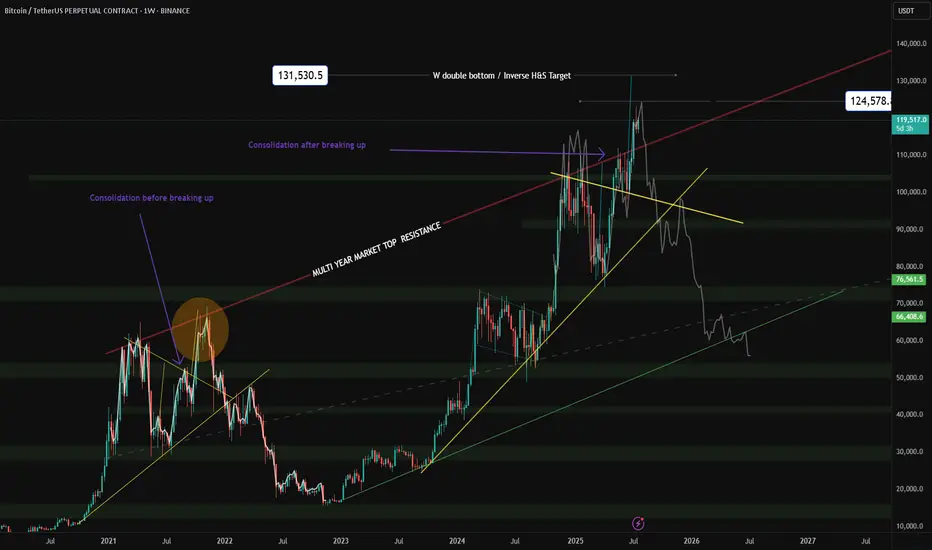
This time it's not different. Still The same macro structure. This time it's not different. we are in the last phase of the bull market cycle.
BTCUSD Long Trade BITSTAMP:BTCUSD Long Trade - this trade is basically based on Key Levels, prices are very intact as exactly shown.
This is good trade, don't overload your risk like greedy, be disciplined trader.
I manage trade on daily basis.
Use proper risk management
Looks like good trade.
Lets monitor.
Use proper risk management.
Disclaimer: only idea, not advice

BTC - Long SET-UP BINANCE:BTCUSDT
Bitcoin AMC Pattern Forming?
BTC is showing signs of an AMC-style accumulation after a range-bound consolidation. A clean breakout is possible if price respects the 113k–113.8k support zone — potential entry zone for smart money 📈
Alternatively, deeper liquidity may be tapped at the 110k–112k OB zone, offering another high-probability buy setup🔁
Watch for signs of bullish intent in these key zones — price structure suggests upside potential once liquidity is swept✅

$BTCXAG - BITCOIN TO SILVER - BULLMARKET IS NOT OVER!I bet you haven't seen this chart anywhere! The Bitcoin to Silver chart is preparing for another explosion!
And yes, BULLMARKET IS NOT OVER!

Bitcoin shows signs of a potential declineBitcoin's price shows signs of a potential decline after testing resistance levels. A correction at this stage is generally a healthy sign for the market, allowing for consolidation before any strong upward move.
Bitcoin may test the resistance line after the current decline. If the price falls below 118,000, there is interim support, but further downside may be expected. 116K and 112K A break below 112,000 could open the door for deeper bearish momentum.
You May find more details in the chart.
Trade wisely best of Luck.
Ps Support with like and comments for better analysis Thanks for Supporting.

BTC possible failed range breakout - Aggressive Move The BTC ATH rally began post cash close and had very thin volume on the break out before setting this range on the higher time frames. Normally, a range after ATHs are made I would be extremely bullish and I am.
Aside from the failed breakouts at the highs, the attempts paired with nuances such as the crypto week impulses, the day of signing GENIUS and new regulatory acts being drafted now, the attempts to break those ATHs were nudged off.
Sometimes come failed moves come fast moves, and so I have to be prepared that BTC will trade between these thin areas on the volume profile from 111k to 115k. 113k being the most noticeable node in the entire profile.
Similar to my analysis on the break to ATHs, I would expect this move to be aggressive and remind us of a 2020 cycle style flush in Altcoins. Kind of already seeing it with the performance of alts today preempting the failed move up on BTC at range highs.
I will NOT be shorting anything in crypto, these are just areas that I am heavily interested in buying. Currently flat perps and will wait for BTC to make its mind up.

Bitcoin Wave Analysis – 22 July 2025
- Bitcoin reversed from support level 116065.00
- Likely to rise to resistance level 122775.00
Bitcoin cryptocurrency recently reversed up from the key support level 116065.00, which also stopped the earlier minor correction 2 at the start of June.
The support level 116065.00 was further strengthened by the support trendline of the daily up channel from June and the 38.2% Fibonacci correction of the upward impulse from July.
Given the strong daily uptrend, Bitcoin cryptocurrency can be expected to rise further to the next resistance level 122775.00 (which stopped the previous impulse wave 1).

Bitcoin first target and short-term pump at least to 137K$ aheadAs we can see stop and next range zone for price can be near 135K$ to 137K$ and also major support zones now are 115K$ and 105K$ that can pump price once again if they touch.
Red trendline was strong resistance and it usually stop the pump and it is daily high detector now unless it breaks this time.
DISCLAIMER: ((trade based on your own decision))
<<press like👍 if you enjoy💚
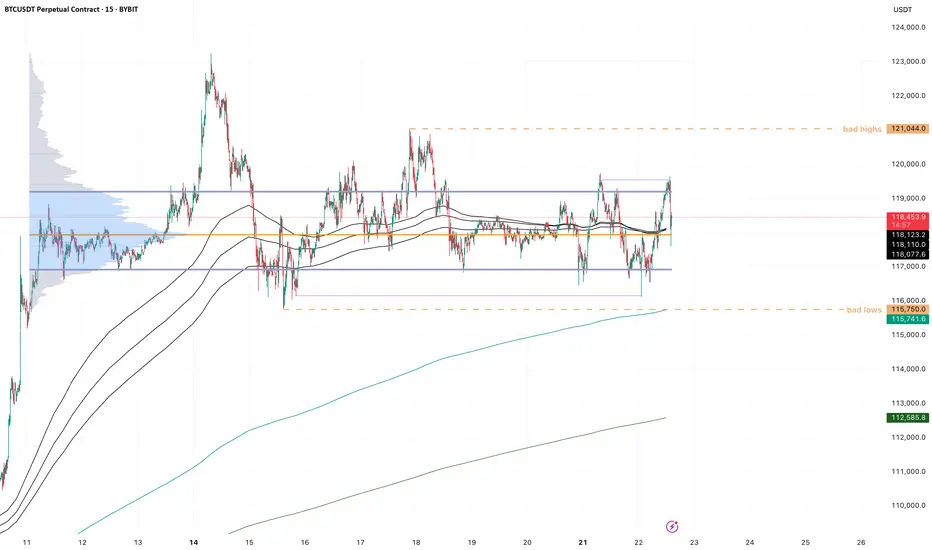
Lingrid | BTCUSDT Consolidation Expansion ScenarioBINANCE:BTCUSDT is coiling within a bullish continuation zone after rebounding strongly from the 115,930 support and holding above the blue ascending trendline. Price formed a higher high inside the rising channel, followed by sideways consolidation, suggesting preparation for another bullish leg. The triangle pattern breakout and price stability above the trendline favor upward continuation toward the resistance at 126,500. Momentum remains intact while the structure supports the next breakout push.
📉 Key Levels
Buy trigger: Break and hold above 120,000
Buy zone: 117,500–118,200
Target: 126,500
Invalidation: Close below 115,930
💡 Risks
Loss of support at the trendline
Strong rejection near red channel resistance
Weak market sentiment or macro news shocks
If this idea resonates with you or you have your own opinion, traders, hit the comments. I’m excited to read your thoughts!

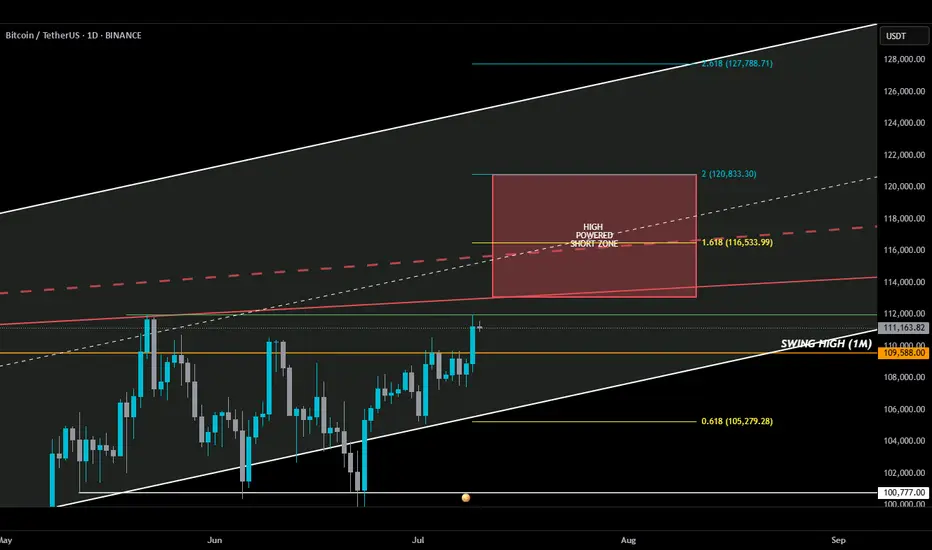
HIGH POWERED SHORT ZONE 2.0HIGH POWERED SHORT ZONE ⚡️
Usually, a 3% move doesn’t make anyone blink—but this one? It sent BTC into all-time high territory. I almost popped the champagne… until I remembered I’m in a short.
Not because I don’t believe in upside—but because my add zone in the HIGH POWERED SHORT ZONE hasn’t been tagged. Yet.
Here’s the breakdown 🧵👇
________________________________________
Before anyone goes bUCK wilD and cracks open that dusty bottle of Veuve, double-check something:
📅 The July 10th daily candle needs to close above the monthly swing high (orange line).
If BTC bulls lock that in, then a move deeper into the HIGH POWERED SHORT ZONE becomes real...
play-the-game real…
________________________________________
Where’s this HIGH POWERED SHORT ZONE coming from?
🔻 Solid red line – a trendline from Dec 2024 that has held strong through three separate tests — marking it as a key line on the sand.
🔻 Dashed red line – goes all the way back to Dec 2017. A seasoned veteran of resistance.
I also drew in a white ascending channel—not just for looks. If BTC breaks out, this channel will help us ask:
“How high is too high?”
________________________________________
Now enters Fibonacci — where nature maps out key alignments on the chart. 🌱
🟡 Gold lines = Fib golden ratios
🔵 Teal lines = Fib Degen Ratios
It’s wild how they just line up:
• 2.618? Right on the top of the channel.
• 1.618? Sitting on the 2017 trendline.
• 0.618? Near current support + bottom of the channel.
Also had to draw that horizontal support white line to keep an eye on.
A Bounce or bust? Ask the bUCKmOON!
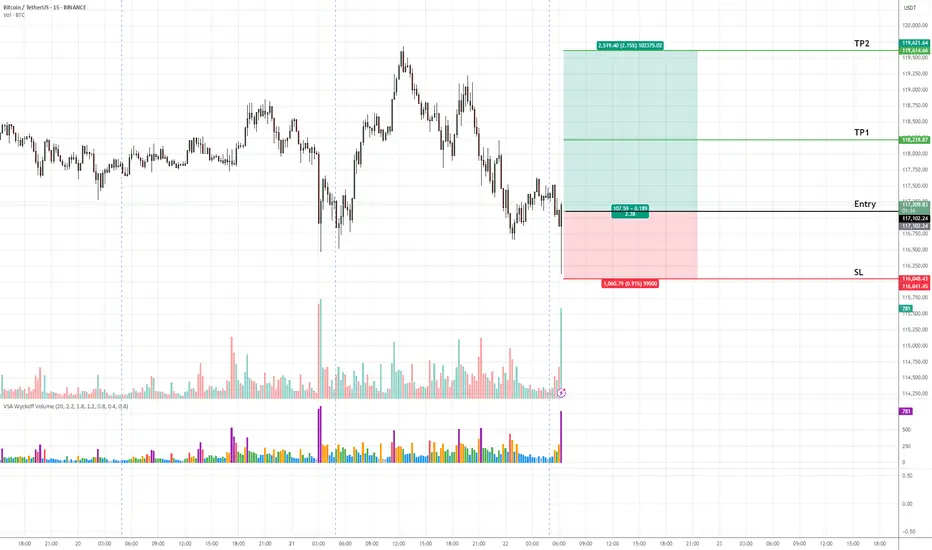
BTCUSD (Bitcoin) Buy Setup – VSA & Market Structure Analysis✅ Entry: As marked on chart
🎯 Take Profit 1 (TP1): Highlighted zone on chart
🎯 Take Profit 2 (TP2): Highlighted zone on chart
🛑 Stop Loss (SL): Defined below recent demand zone
📊 Technical Insight (VSA & Market Structure):
The recent decline into the support zone occurred on diminishing volume, indicating a lack of selling pressure.
A climactic volume spike (stopping volume) followed by a wide spread bullish candle suggests strong professional buying activity.
Subsequent bars show narrow range candles with low volume, characteristic of an absorption phase, hinting at smart money accumulation.
Price is now attempting to break above the previous minor resistance, which would confirm demand overcoming supply.
The broader market structure aligns with this setup: Bitcoin is in a higher timeframe accumulation range, and this move could initiate a markup phase as per Wyckoff/VSA principles.
📍 As long as price holds above the stop loss zone, we expect a bullish leg towards TP1 and TP2, in line with the emerging demand dominance.
My thoughts on Bitcoin.. ABC -> 129K Top?I think we correct down to 112K area to fill the FVG and CME then we Turn up, topping at 129K and then the rest of the Alts blow off top from there..
Thoughts?

$BTC Macro UpdateBitcoin Macro Outlook BINANCE:BTCUSDT.P
Weekly
Bias & momentum remain bullish. Price is pressing toward new ATHs despite last week’s pullback.
Next macro target: ~$133,550 (extension of the current DeCode V-Range: 111,959.5 – 77,111.0).
A weekly close back inside that range (<111,968.0) = Failed Auction → serious red flag for reversal.
Daily
Clean rejection off the 21-Day Rolling VWAP + bounce at the structural HL V-Level (116,862.4).
A strong bullish engulfing today would set the tone for follow-through this week.
10-Hour
Structure is still bullish. Multiple Failed Auctions from ~116,960.0 are driving price toward the ATH.
Intraday
Choppy and hugging range lows → harder read. That behavior near balance edges triggers AMT Rule #5: “If time/volume builds at the edge of balance, price is likely to push through.”
Auction Market Theory – Quick Reminders
Price : advertises opportunity
Time : regulates opportunity
Volume : tells you if the auction is succeeding or failing
Rule #5 (above) is in play right now. Stay patient, wait for confirmation, and don’t FOMO.

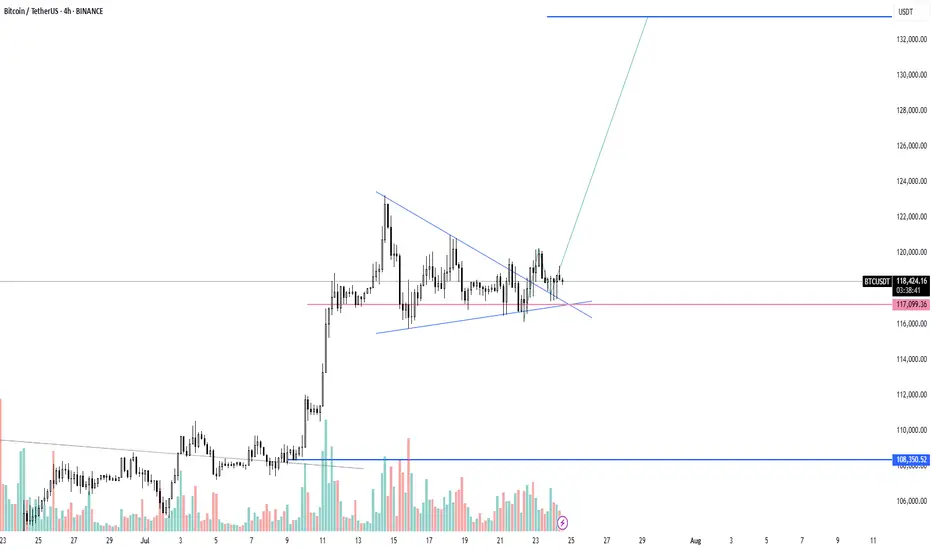
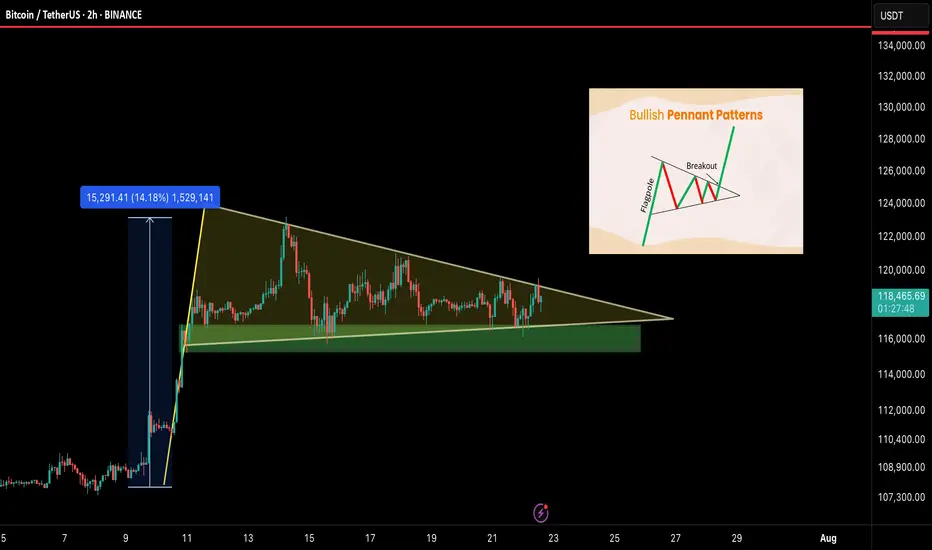
BTC/USDT – Bullish Pennant Setting Up for the Next Leg!Bitcoin is currently forming a bullish pennant — a classic continuation pattern — right after a strong 14% impulse move. This type of structure often leads to a breakout followed by another powerful rally. And it’s coiling up nicely.
🧠 Technical Breakdown:
🟢 Bullish pennant formation in progress
🔽 Support zone: $115.5K – $116.5K
📏 Flagpole projection targets $135K+ on breakout
⚠️ Currently consolidating with lower volatility — breakout could be near
🔍 What to Watch For:
Clean breakout above pennant = breakout confirmation
Daily close below $115K = invalidation zone
Volume spike will likely signal the next move
📢 Final Take:
BTC is showing healthy consolidation after a strong move, and this pennant could launch us toward $135K and beyond. Keep your eyes on the breakout and manage risk wisely.
💬 Share your thoughts below & smash that ❤️ if you’re watching this move!
targetRemember, day trading is risky and most traders lose money. You should never trade with money you can’t afford to lose. Prove profitability in a simulator before trading with real money.
❗❗My results are not typical. We do not track the typical results of past or current customers. As a provider of trading tools and educational courses, we do not have access to the personal trading accounts or brokerage statements of our customers. As a result, we have no reason to believe our customers perform better or

Guys. Thoughts?Just having a conversation with a trading jedi master and then they taught them to set a buy stop with heavy risk above the lower high at the top of the market cycle in the sell side of a previously resolved block after exceeding the statistical high of the dealers range for the day. Just for some more insight, this all happened while venus was in retrograde. Hopefully that paints a clear enough picture. Don't hesitate to ask questions.
Signing off, yours faithfully,
ChartCharmer.

Trading plan for BitcoinLast week, Bitcoin established a new ATH at $123k before entering a corrective phase. The price action has since developed into a clear consolidation pattern and currently trades below the weekly pivot point.
Key Observations:
Proximity to last week's low increases probability of a full ABC correction targeting $113k
Break above noted resistance could invalidate bearish scenario and suggest ATH retest
Critical Levels:
Resistance: $119,500
Support: $113,000 (ABC target)
Trade the range until the market declares its next direction.

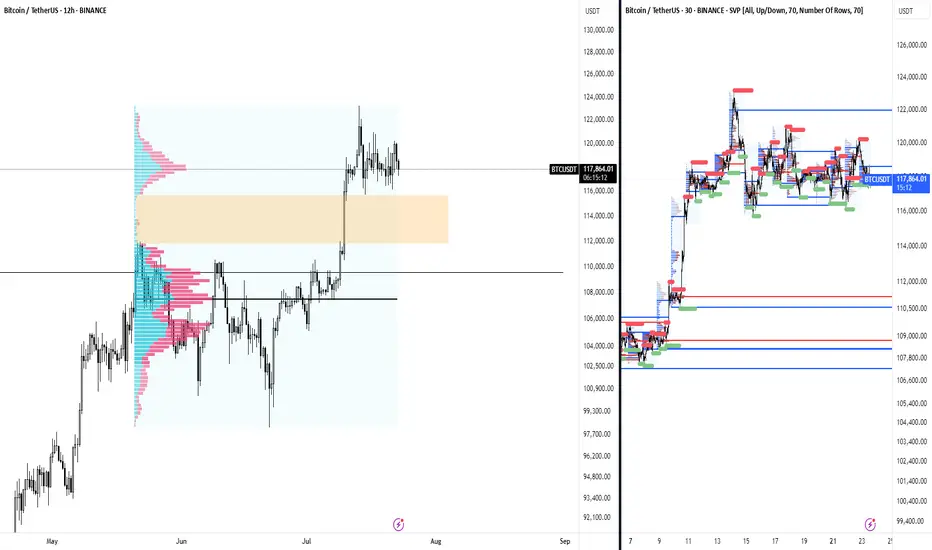
BTC - Sideways forever?!Compressing really hard here on BTC, look at:
- volume range becoming very concentrated, clean pingpong between VAL and VAH
- H4 trend compressing to almost a single point
- you can see from the purple lines that only internal liquidity is being taken on both sides
imo this sets us up for a potential fake out setup. There is so much liquidity on both sides in this small range, that on a very clean sfp of one side, the other side would have to rush out which pushes price quickly to the other side. We saw a little bit of that already with the sweep during the asia session today.
Of course the sfp needs to be valid, wait for a reclaim setup, there is always the chance the breakout/breakdown is valid, you don't want to be on the wrong side of that either.