Strategic Multi-Swing Analysis – Pivots and Post-FOMC Outlook__________________________________________________________________________________
Technical Overview – Summary Points
➤ Sustained bullish momentum on BTCUSDT across all swing timeframes.
➤ Key supports: 116400–117400 (likely rebound), major supports: 105047–114674.
➤ Main resistances: 119000–120000 (short term), major ceiling at 123240 (1D/12H).
➤ Risk On / Risk Off Indicator: "Strong Buy" signal – tech sector leadership confirmed.
➤ Volumes normal to moderately elevated, no excess or behavioral anomaly (ISPD "Neutral").
➤ No euphoria or capitulation flags; general wait-and-see attitude, FOMC event ahead.
__________________________________________________________________________________
Strategic Summary
➤ Strategic bullish bias remains as long as 116400/117400 supports hold.
➤ Opportunity window: buy pullbacks towards 117400–116400 with tight stops; clear invalidation below 115900.
➤ Risks: FOMC-induced volatility, increased leverage on alts, potential capitulation if key support breaks.
➤ Catalysts: FOMC communication, geopolitical context (no immediate threat), background risk-off climate not yet triggered.
➤ Action plan: Prioritize post-event reaction over anticipation; maintain strict technical protection.
__________________________________________________________________________________
Multi-Timeframe Analysis
1D: Uptrend confirmed. Price above all major supports. Strong resistance at 123240, key support at 105047, normal volumes, Risk On / Risk Off Indicator "Strong Buy", ISPD "Neutral".
12H: Bullish bias. Resistance cluster 120002–123240. Intermediate supports 114674/111949. Momentum/volume supported, no excesses.
6H: Bullish near range top, supports at 114674/111949, ceiling at 120002–123240. Solid Risk On / Risk Off Indicator.
4H–2H: Up momentum, resistance 119003–120002–123240, supports 116474/117800. Moderate/normal volumes.
1H: Strong uptrend, thick resistance at 119000–120000, immediate supports 117800/116474. Slight volume uptick ahead of FOMC.
30min–15min: Resistance 119003–120000 (~H4 pivot). Intraday support 117400–117800/118200. Both Risk On / Risk Off Indicator and ISPD neutral, normal volumes, bullish as long as 116474 holds.
SYNTHESIS: Broad bullish confluence on MTFTI from 1H to 1D/W.
Supports at 116474/117400 are key pivots for maintaining bullish swing view.
No behavioral alerts or extreme volumes.
Consolidation/waiting likely before FOMC release – monitor reactions at pivot zones.
__________________________________________________________________________________
Strategic decision & macro
Opportunities: Swing bullish scenario favored as long as key supports hold, buy strategic pullbacks, reverse on clear break.
Main risk: FOMC volatility, altcoin excesses, possible post-announcement fake moves. Active monitoring essential.
Macro/on-chain: No excess, BTC realized cap > $1T; aggressive rotation into alts, high open interest. No capitulation. Major on-chain & technical support aligned at 114500–118000.
Action plan: Favor reactivity (post-FOMC), tight stops, progressive take profits at 119500–123240 resistance. No aggressive pre-positioning.
__________________________________________________________________________________
Macro catalysts overview
FOMC expected: status quo, market sensitive to any Powell tone shift.
Global macro: latent risk-off, geopolitical drivers closely watched.
BTC stable, no technical disruptor in the immediate term.
__________________________________________________________________________________
Final Decision Summary
Robust technical setup with a clear bullish bias. Optimal entries on 117400-116400 pullbacks, stops below support, active management needed during FOMC. No on-chain excess; constructive background unless exogenous shock or resistance failure (119000–123240). Stay alert for breakout/reject pivot.
__________________________________________________________________________________
BTCUPUSDT trade ideas
Market overview
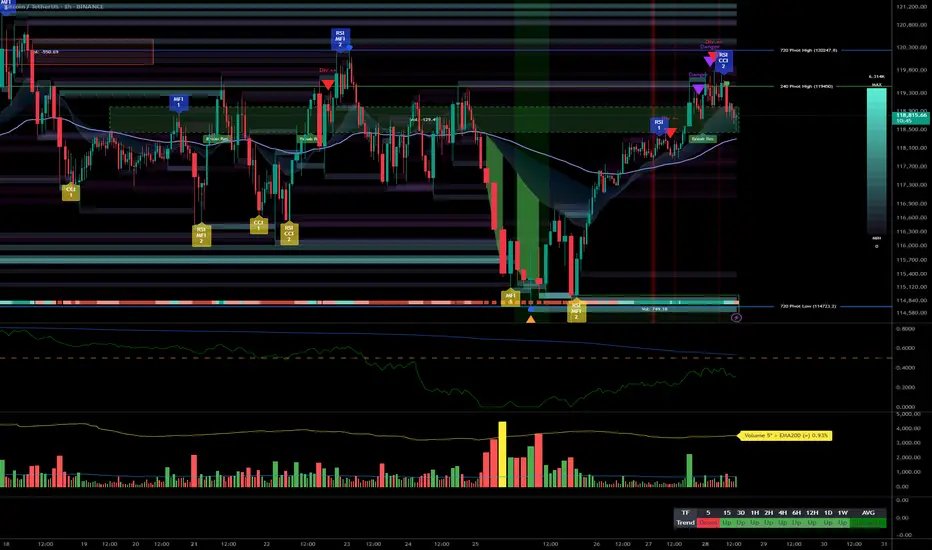
📈 WHAT HAPPENED?
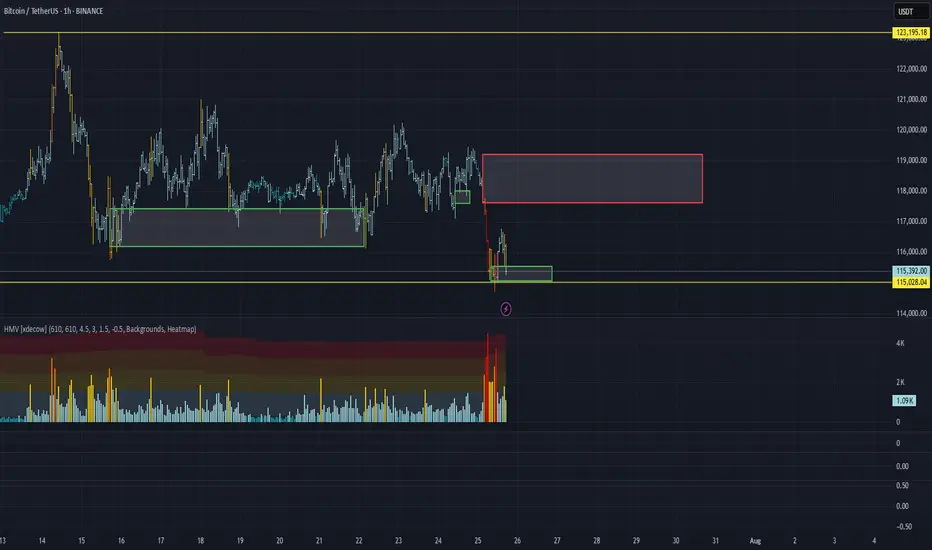
Last week, a less priority but expected scenario was realized for Bitcoin. We broke through the sideways in a downward direction and fell to the area of pushing volumes ~$115,000. At this level, strong volume anomalies were recorded, and a rebound occurred.
On Friday, the daily analysis on TradingView indicated a point to join the long movement, which confirmed its accuracy. The price reached the accumulated volume zone of the sideways at $117,600-$119,200 and was able to consolidate above without any significant reaction, which strengthens the buyers' position.
💼 WHAT WILL HAPPEN: OR NOT?
At the moment, the first protection from sellers has appeared. Let's consider possible scenarios:
1. A decline to the mirror zone of $118,300-$117,300, from which, if the buyers' reaction is confirmed, buys are expected to resume.
Next, a narrow sideways formation within the mentioned zone and a local sell zone of $119,500-$119,000 is possible, followed by a long position.
Another option is to develop a further long divergence from the current levels. In this case, the local sell zone of $119,000-$119,500 will provide additional support.
2. A less priority scenario is a decline to the volume anomaly zone of $116,200-$115,000, with a test of the local minimum. In this case, the recovery will take longer.
Buy Zones:
$118,300–$117,300 (mirror volume zone)
$116,200–$115,000 (volume anomalies)
$110,000–$107,000 (accumulated volumes)
Sell Zone:
$119,500–$119,000 (potential resistance if a correction develops)
📰 IMPORTANT DATES
Macroeconomic events this week:
• July 29, Tuesday, 14:00 (UTC) - publication of the US Consumer Confidence Index from CB for July;
• July 29, Tuesday, 14:00 (UTC) - publication of the US Job Openings and Labor Turnover (JOLTS) for June;
• July 30, Wednesday, 08:00 (UTC) - publication of Germany's GDP for the second quarter of 2025;
• July 30, Wednesday, 12:15 (UTC) — ADP's July change in the number of non-agricultural employees in the United States;
• July 30, Wednesday, 12:30 (UTC) — U.S. GDP for the second quarter of 2025;
• July 30, Wednesday, 13:45 (UTC) — Canada's interest rate decision;
• July 30, Wednesday, 18:00 (UTC) — US FOMC statement and announcement of the US Federal Reserve interest rate decision;
•July 30, Wednesday, 18:30 (UTC) — US FOMC press Conference;
• July 31, Thursday, 01:30 (UTC) — publication of the Chinese Manufacturing PMI for July;
•July 31, Thursday, 03:00 (UTC) — announcement of Japan's interest rate decision;
• July 31, Thursday, 12:00 (UTC) — publication of Germany's July Consumer Price Index (CPI);
• July 31, Thursday, 12:30 (UTC) — publication of the United States' June Personal Consumption Expenditure Price Index and Initial Jobless Claims;
• August 1, Friday, 09:00 (UTC) — publication of the Eurozone Consumer Price Index (CPI) for July;
• August 1, Friday, 12:30 (UTC) — publication of the average hourly wage, changes in the number of employees in the non-agricultural sector, and the unemployment rate in the United States for July;
• August 1, Friday, 13:45 (UTC) — publication of the U.S. Manufacturing Purchasing Managers' Index (PMI) for July.
*This post is not a financial recommendation. Make decisions based on your own experience.
#analytics

BTC Price Prediction and Elliott Wave AnalysisHello friends,
>> Thank you for joining me in my analysis. I think we will finish the 1st wave A in pink X wave as Gray ABCm. I am waiting for its confirmation.
>> Reminder about our previous confirmations:
* Day TF: Breaking 118451 for today and the next couple of days, and keep on above it, leads to ending the B wave successfully.
* 4Hr TF: Breaking 118451 for the past hours and keep on above it, we ended W wave successfully ( maybe also B ?)
Keep liking and supporting me to continue. See you soon!
Thanks, Bros

Consistency and reliable performance with real time validationMy cutting edge tech has been put to the test with daily real time validation
It's been correct for over 4 weeks
It's been my mission to defy market odds and revolutionize trading, and with thanks to AI my mission is being fulfilled
I would love to hear your thoughts...or if not, I hope you're getting really excited by what you see

BTC roadmap to new ATHBTC roadmap to new ATH
We're in a bullish flag pattern. Might chop around here for the next few days before we get the breakout, re-test, then make our way to test the last ATH.
I'm going to trade the flag hi/low until we get a break.
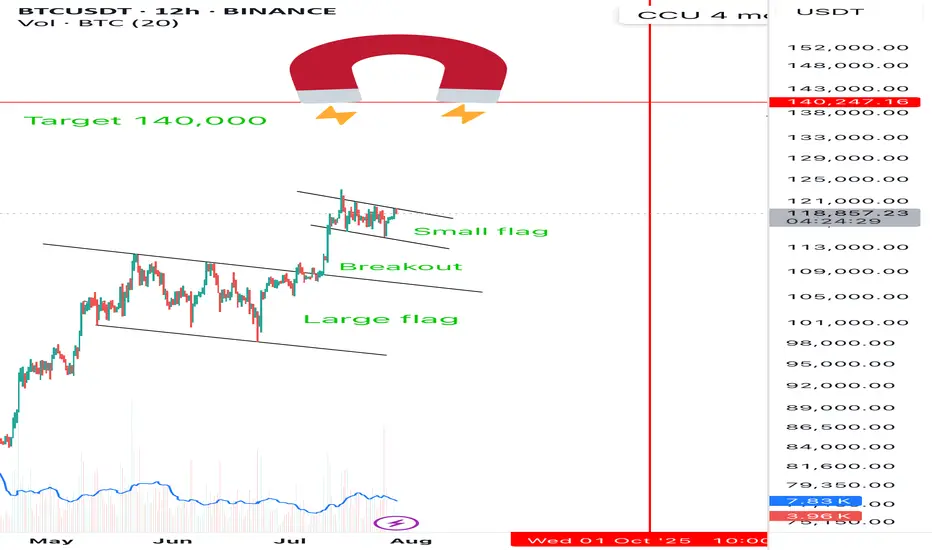
Bullflag double Double bull flag target 140,000 🚀
Everyone’s looking at 145,000
175,000 looks like the fib target
BTCUSDT NEXT Impulse !Hi fellow traders, BTCUSD will be ready to make a move higher from the blue box after it completes the expanding flat pattern in a WXY formation. Target will be 113604.87 USD. Good luck and trade safe!

BTC-----Buy around 119000, target 120000-1205000 areaTechnical analysis of BTC contract on July 28:
Today, the daily level of the large cycle closed with a small positive line yesterday, the K-line pattern continued to rise, the price was above the moving average, and the attached indicator was dead cross. The general trend of rising is still very obvious, but from the trend law, it is not a very strong trend at present. The trend of oscillating upward and range is highly likely. In this case, we must find a good rhythm for trading, keep short-term, and don’t be greedy, otherwise it is easy to have profit-taking problems; the short-term cycle hourly chart yesterday’s US market rose and then fell under pressure to correct the low position near the 118700 area. The current K-line pattern is continuous, and the price is at a high level. The attached indicator is golden cross and shrinking. In general, the trend is still strong and the retracement is relatively small. If we look at the continuation of the rise today, it is still the old rule. The retracement cannot be large and cannot break the intraday low.
Today’s BTC short-term contract trading strategy:
Trade in the 119000 area when retreating, stop loss in the 118500 area, target 120000 and break to the 120500 area;

btcusdtbtc might form deep crab harmin pattern. so far our lower high is 120952 .until this level is breached we may go lower to 112 k area

SellRejection Level
Daily Volume
Market Structure Shift
London US Session
Trend Line Break
Untapped Order Point
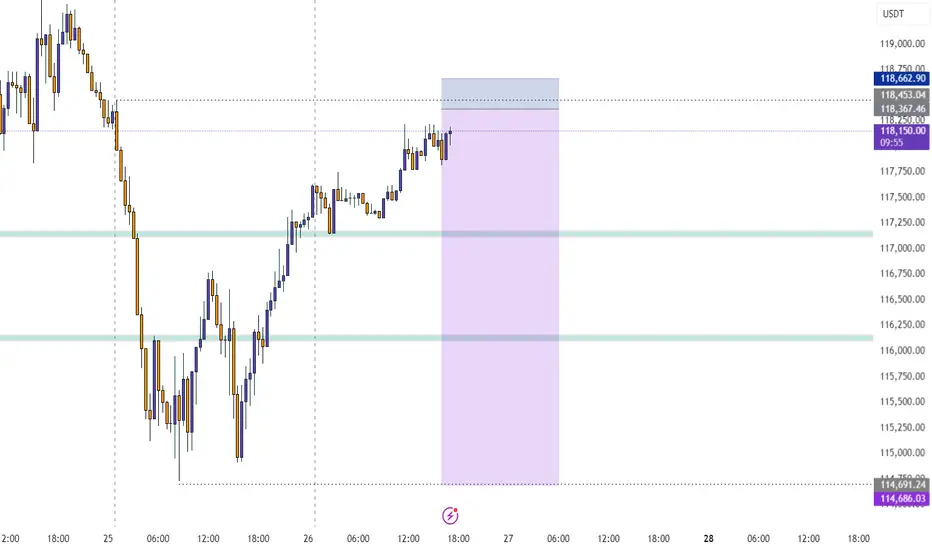
Fake Breakout at $116,522 Could Signal BTC Bull Continuation📈 Fake Breakout at $116,522 Could Signal BTC Bull Continuation — Watch Altcoin Triggers
After a fake breakdown below $116,522, Bitcoin is showing signs of resuming its uptrend.
A key bullish signal was yesterday's daily candle closing above this level — maintaining structure and giving bulls hope.
🔍 Current Strategy:
For BTC, I suggest watching $119,151 as a long trigger, only if BTC Dominance is rising.
If BTC.D isn’t rising, then it’s better to focus on altcoin long setups.
I’m still not opening any short positions — structure remains bullish, and risks of fake breakdowns remain high.
---
💬 Altseason loading? Drop your favorite alt setups in the comments!

Wyckoff ReaccumulationCurrent range looks like another reaccumulation range. Spring has just occurred and looking for a move back and then above the top of the range.
Bearish if we breakout then retrace forming an upthrust after distribution (UTAD).

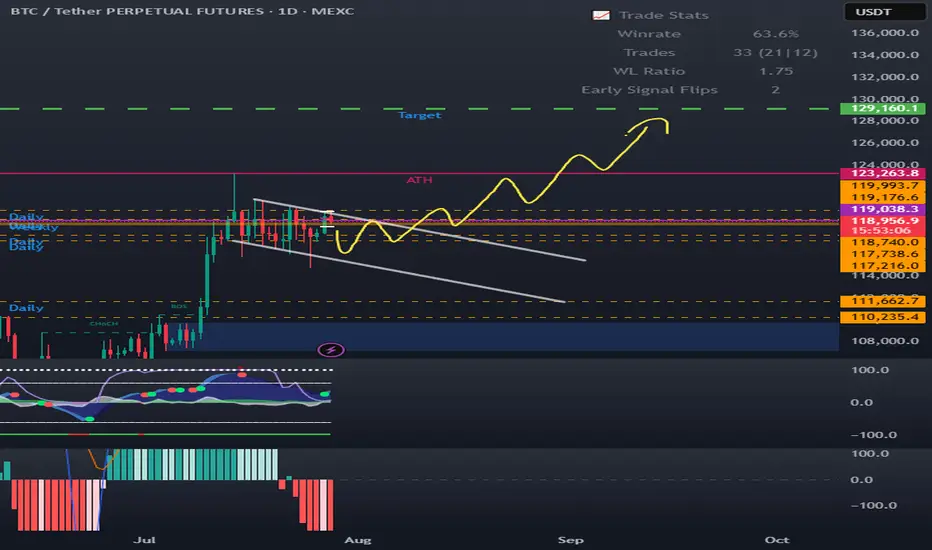
BTCUSDT ready to march towards 140k zoneHere is once again a view of what I had shared when BTCUSDT was trading around 95k in may 2025.
The price action has been similar to our expectation. A push towards 106k-110k and then drop around 95k-98k before boucing towards 137k.
So the next stop for the current upward move is 137k. The push from 98k has brought us into 120k zone and currently we were holding in that range from 114k-120k for a while.
However, this is going to change now. I believe the last drop towards 114k was a false breakdown from 4h support 4HS1 since the price quickly grabbed this region again by moving towards 117k.
I believe the path to 137k-144k is clear now and we see that in coming weeks. After that we shall likely see a correction towards 120k area before move to the target around 150k.
Lets see how the price moves. We will keep monitoring it time to time and I will provide updates. But till now it has been moving according to the plan.
#BTC #BTCUSD #BTCUSDT #BITCOIN #CRYPTO CRYPTOCAP:BTC $crypto

BTCUSDT 6H#BTC is currently working on filling the CME Gap between $115,635 – $114,060 in the Futures chart, as previously mentioned. On the 6H spot chart, a falling wedge has formed, and there's a high probability of a retest of the wedge’s support line.
This support line lies within the support zone at $114,723 – $114,159, and the 6H SMA100 adds another layer of confluence. A dip into this zone is normal and not a cause for concern.
📌 In case of a bounce and breakout above the wedge resistance, the next upside targets are:
🎯 $119,505
🎯 $120,805
🎯 $122,461
However, if the support zone breaks, the potential downside targets will be:
🔻 $112,021
🔻 $108,977
📉 According to the liquidity map, there’s a cluster of liquidity around $114,000, and a brief wick below it is likely. Be cautious with your entries and exits.
⚠️ As always, use a tight stop-loss and apply proper risk management.

BTC/USDT Analysis. Range Breakout
Hello everyone! This is the daily analysis from a trader-analyst at CryptoRobotics.
Yesterday, Bitcoin bounced off a local sell zone on the 15-minute timeframe (previously mentioned), but a full-fledged bullish move did not follow. Instead, the less likely scenario played out — we broke the range to the downside and tested an important buy zone around ~$115,000 (zone of initiating volumes). Almost immediately, anomalies appeared in the cluster search near this level, and we quickly saw an initial rebound.
At the moment, a retest of ~$115,300 is likely. If buyers show proper reaction there, we could resume an upward move toward the $117,600–$119,200 area (accumulated volumes). To continue the long scenario toward the ATH, we need to consolidate within this area or break through it without a strong seller response — which is less likely.
A short scenario becomes possible if there is no buyer reaction around ~$115,300. In that case, a decline toward the next major support zone is expected.
Buy Zone:
$110,000–$107,000 (accumulated volumes)
Sell Zone:
$117,600–$119,200 (accumulated volumes)
This publication is not financial advice.
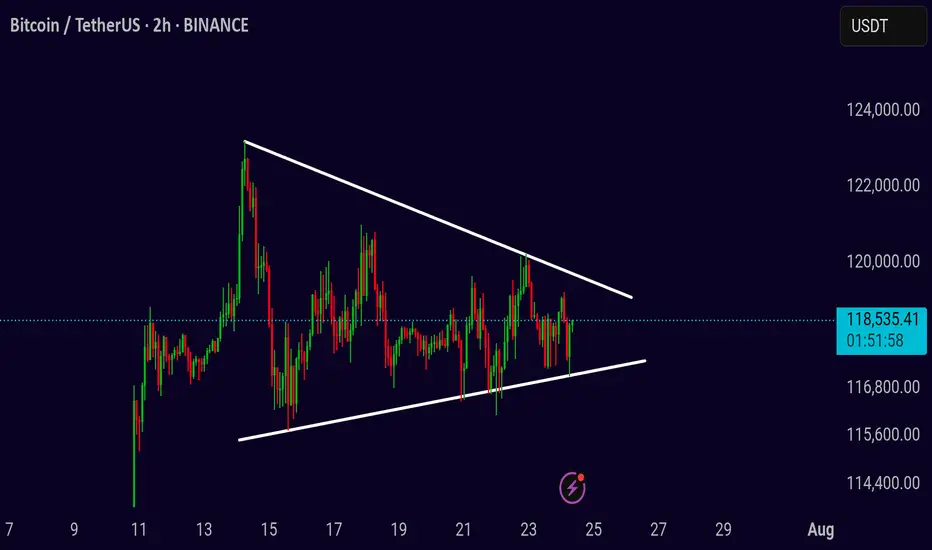
BTC Symmetrical Triangle – Decision Time Soon
BTCUSDT Idea (2H Chart)
BTC is consolidating inside a symmetrical triangle, creating pressure for a breakout. Price is currently ranging between 116K–120K, with volatility compressing.
Patience is key here — don’t rush entries.
A confirmed breakout or breakdown will give the real direction.
Break above the triangle = bullish continuation
Break below = further correction ahead
Wait for 2H close outside the pattern with volume
Watch levels:
* Upside: 120K → 124K → 128K
* Downside: 116K → 112K → 108K
Setup is maturing — breakout is just a matter of time. Let the chart lead, not emotions.
Cutting-edge Tech, Outperforming Traditional Tools Until now my AI has been defying market odds
The forecasts work on all timeframes, short, medium or long range
My AI is outperforming traditional tools, in real time, thats right...with real time validation
The question is, will the crown remain intact or be dethroned??

bitcoin, Stay heavy on positionsbitcoin, Stay heavy on positions
Short-term overbought is noise. Focus on the bigger picture. Keeping my position heavy—no plans to reduce yet

Btc 4hr time frame forward test3 possible scenarios,
Scenario 1 (Red): If it bounces at 1.272 and fails to break the previous high, a more bearish move is possible.
Scenario 2 (Green): This scenario involves a bounce at 1.272 and consolidation above the previous high.
Scenario 3 (Orange): This is a continuation of the bearish breakdown.
General Notes: All bounce points (indicated by the "yellow line") show a gap-up move (SMC entry area). TP3 is a good entry area, considering all confluences.

BTC-----Sell around 118000, target 116500 areaTechnical analysis of BTC contract on July 25:
Today, the large-cycle daily level closed with a small negative line yesterday, and the K-line pattern continued to fall. Although the price is at a high level, the attached indicator is dead cross. The current big trend is falling. From the overall trend and the trend law, the pullback is not strong. Instead of breaking the high, the decline is strong and continuous. Then the trend is also slowly changing. The key support position below is 115700 area, which is the position to pay attention to today and next week; the short-cycle hourly chart currently has a continuous negative K-line pattern, the price is below the moving average, and the attached indicator is dead cross. The continuation of the intraday decline is a high probability trend, and whether the European session can continue to break the previous low is the key. The current short-term resistance position is in the 118000 area.
Today's BTC short-term contract trading strategy:
Sell at the 118000 area of the pullback, stop loss at the 1118500 area, and target the 116500 area;

BTC - shake out!BTC Correction 📉
After observing the recent price action, it now seems clear that the inevitable correction is taking the stage.
I revisited the chart and drew potential bullish trendlines for a bull pennant on the 12h timeframe, but even those appear to be breaking down, confirming that we're currently experiencing a clear shakeout/correction.
I'm now expecting at least a full fill of the CME gap, and potentially even a drop toward $112,000.
Keep in mind that the CME price often lags behind spot prices on other exchanges, so in order to properly fill the gap down to $114,000 , a dip toward the $112,000 zone remains a very realistic scenario.
Take note that a lot of new retail investors are coming in recently by all the sounds of a ‘’possible altseason’’ around the corner, especially during the summer holidays when they have more time on their hands to look deeper into this.
all this in combination with a lot of long positions around and beneath the price range of 114k and 116k I expect a shake out and liquidity grab.
The only bullish short-term possibility that remains would be if this turns out to be a massive fakeout from the pennant structure, but I find that unlikely.
Personally, I’m watching for signs of a bottom sometime next week before looking for new upward momentum.
The BTC.D began a dive towards 60%, still: BTC remains dominant, which strongly impacts altcoins.
That’s why I’m currently staying cautious and holding off on entering new trades till we see clear support.
Let’s reach the summit together!
📝 Note
I'm currently building a portfolio of crypto analyses here on TradingView. Your feedback, tips, or validation are greatly appreciated, especially as I continue developing this skill further!


BTC / USDT : Broke down and now going for retestBitcoin Analysis:
Bitcoin has broken down and is now retesting the support zone. As mentioned earlier, a shakeout can happen at any time, and this looks like the potential retest phase.
Bullish Scenario:
Reclaims Resistance: If BTC manages to break through the resistance after the retest, it will stabilize for the short term. This could lead to a move towards higher levels.
Bearish Scenario:
Failure to Break Resistance: If the retest fails and BTC can't reclaim the resistance, further downside could be expected.
Targets: Keep an eye on the CME gap at $114,000 and 92K as key levels to watch for potential price action.
Note:
Manage your risk carefully. The market is volatile, and a shakeout could happen anytime. If BTC fails to break resistance after retest, more pain may be ahead.
