Bitcoin Bullish Structure Holds: Focus on Support Entries & Brea__________________________________________________________________________________
Technical Overview – Summary Points
__________________________________________________________________________________
Momentum: Uptrend synchronization on all timeframes (MTFTI Strong Up). Risk On / Risk Off Indicator: strong buy on larger TF, neutral intraday.
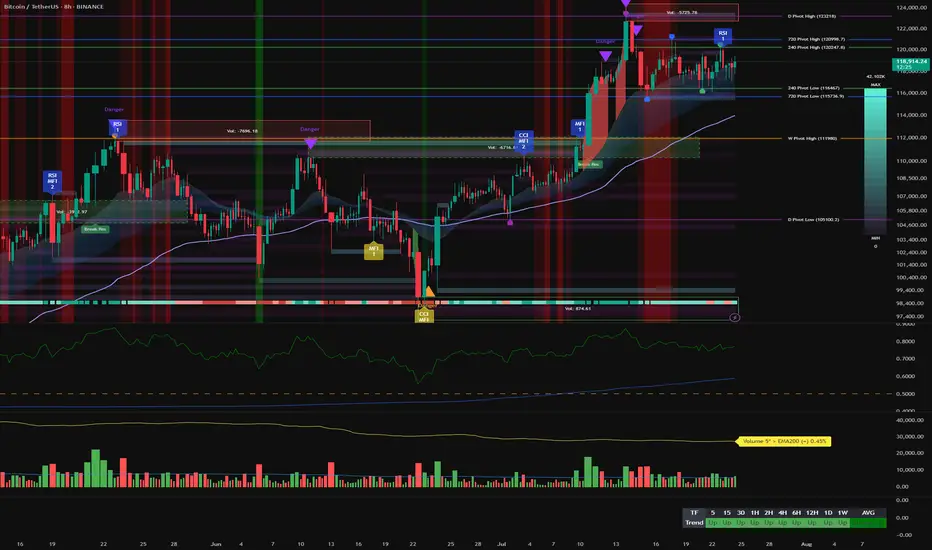
Supports/resistances: Main HTF supports well below current price (115,736–117,000, 111,980). Key resistances to break: 120,998.7 and 122,318.
Volumes: Normal to moderate, no climax, no distribution detected.
Multi-TF behaviour: No behavioural excess, no sell signal, intraday phases are consolidative just below resistance, which is normal.
__________________________________________________________________________________
Strategic Summary
__________________________________________________________________________________
Overall bias: Strong bullish, no end-of-trend alert. Buying retracement towards the Pivot Lows is preferred.
Opportunities: Entries on dips to 115,700–117,000 (2H/4H); breakout above 120,250/122,300.
Risk zones: Return below 115,700 or 111,980 = structural alert. Increased vigilance for macro releases (ECB/PMI/Jobless Claims).
Macro drivers: Fed in focus (no move expected), volatility risk around July 29–30 (FOMC).
Action plan: Entry on retracement, dynamic management. Stop-loss under 115,736 then 111,980. Partial exits on excess or confirmed breakout.
__________________________________________________________________________________
Multi-Timeframe Analysis
__________________________________________________________________________________
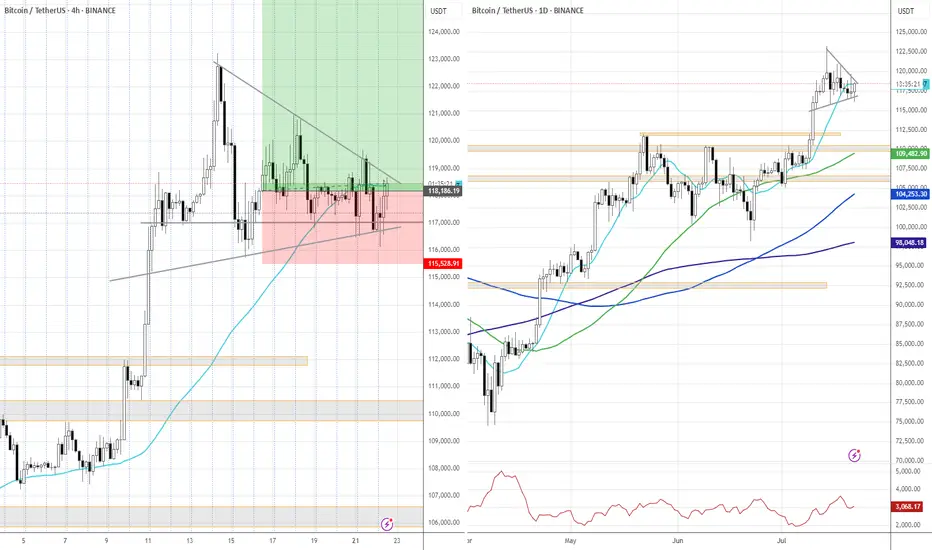
1D: Resistances 122,318, 120,998.7; supports 115,736.9, 105,100.2. Risk On / Risk Off Indicator: strong buy, all synchronized bullish, no exhaustion. Daily bias: robust uptrend.
12H/6H/4H: Bullish confluence. Strong momentum, stable volume, validated supports. No ISPD excess, sectoral strength intact.
2H/1H: Consolidation below resistance; healthy structure. Supports to be favored for swing/intraday positioning. Minor intraday hesitation, no reversal.
30min/15min: Behavioural neutrality, lateral movement. Volume normal to mildly elevated, no overheating. Structural risk absent.
Additional indicators:
Risk On / Risk Off Indicator: Strong buy up to 2H; neutral on short TF.
ISPD DIV: Neutral, healthy market, no excess detected.
Volume: No climax or distribution, multi-TF structural support.
Cross-timeframe synthesis: Multi-timeframe bullish alignment, no structural weakness. Opportunities on retracement, breakout plays above all-time highs.
__________________________________________________________________________________
Synthesis & Strategic Bias
__________________________________________________________________________________
BTC trend and momentum remain aligned, sector leadership (Risk On / Risk Off Indicator) intact.
Strong HTF support, major resistances must break for extension.
External risk: macroeconomic catalysts (Fed, ECB, US PMI).
Premium opportunities on dips to supports, dynamic management essential around macro events.
Final bias: as long as supports and indicator alignment hold, bull run continues. Partial exit at resistance; stops below validated pivots.
BTCUPUSDT trade ideas
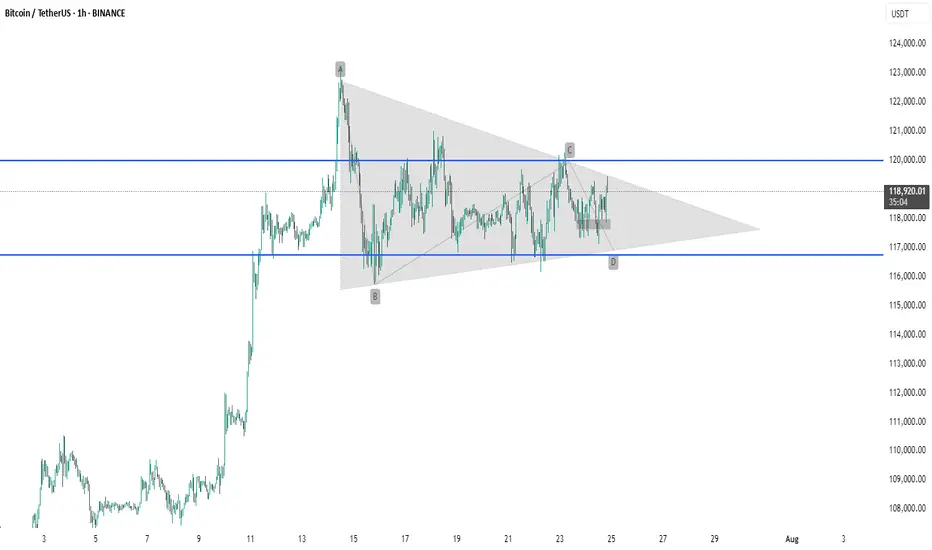
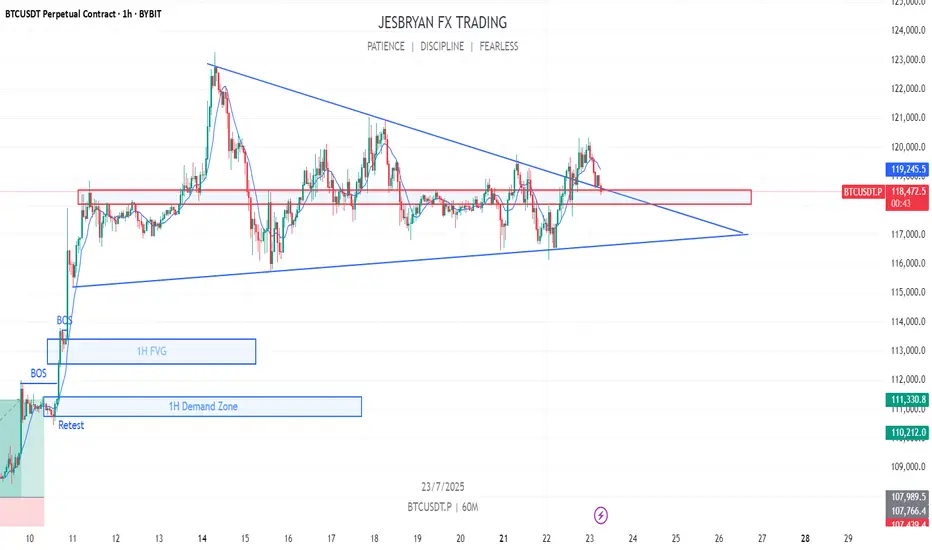
BTC #The chart shows Bitcoin (BTC/USDT) on a 1-hour timeframeThe chart shows Bitcoin (BTC/USDT) on a 1-hour timeframe forming a symmetrical triangle pattern, marked by points A, B, C, and D. This consolidation pattern indicates potential for a breakout as price volatility contracts. Key support is around $117,000, and resistance is near $120,000. A breakout above or below the triangle could signal the next major move. Traders typically watch for volume confirmation before entering a trade.
thanking you
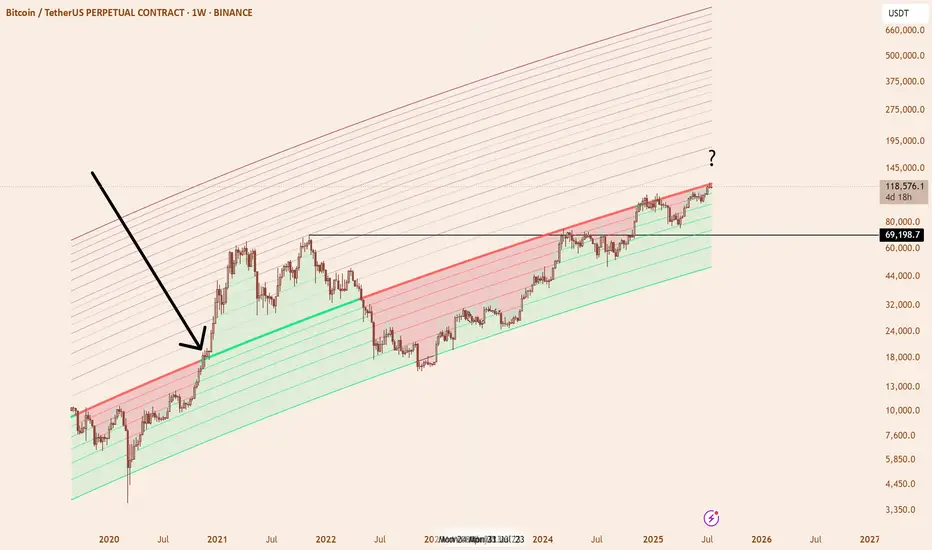
Historic moments for BTC?! Perhaps these are the most exciting weeks in BTC's history! The most persistent trendline many of us have been watching over the years is here on our horizon...!
Let's see what happens...

BTC LONG : Next Target - 133KBTC bull run is back in full swing with no visible resistance in sight.
Next area of interest according to fib extension is 133K.
Bulls in full control till then.

BTC/USDT Analysis. Inside the Range
Hello everyone! This is the daily analysis from a trader-analyst at CryptoRobotics.
Yesterday, Bitcoin tested the previously mentioned POC (the point of control — the area with the highest volume concentration within the range). A reaction followed: buyers prevented the price from falling below that level.
At the moment, we still expect a breakout from the range to the upside. On the lower timeframe, buyers are once again trying to gain control through delta. If the price breaks above $118,800, we can expect a move at least toward ~$120,000. A potential retest of the local zone at $118,000–$117,600 (signs of market buying aggression on the 15m timeframe) is also possible, followed by a continuation of the uptrend. Larger buy zones are marked below.
Buy zones:
~$115,000 (zone of initiating volumes)
$110,000–$107,000 (accumulated volumes)
This publication is not financial advice
Sell Signal on Bitcoin (1-week timeframe)The IQTrend indicator shows a Sell signal on the weekly timeframe for BINANCE:BTCUSDT .
I also noted the percentage of movement after previous signals so that you understand the seriousness of the situation.
Of course, this time it may be a little different, but I think it's worth keeping this signal in mind anyway.
DYOR

BTC market update Bitcoin Market Update:
Bitcoin is currently consolidating, and the market is indecisive. It's better to watch closely for a breakout or breakdown before making any trades.
Bullish Scenario:
Breakout above resistance could lead to a strong bullish rally. Target: Next resistance level.
Pro Tip: Confirm with high volume for a valid breakout.
Bearish Scenario:
Breakdown below support could trigger strong selling. Target: Next support level.
Pro Tip: Watch for confirmation with increased selling volume to avoid fakeouts
Conclusion:
Wait for clear breakout or breakdown to trade. Avoid entering blindly.
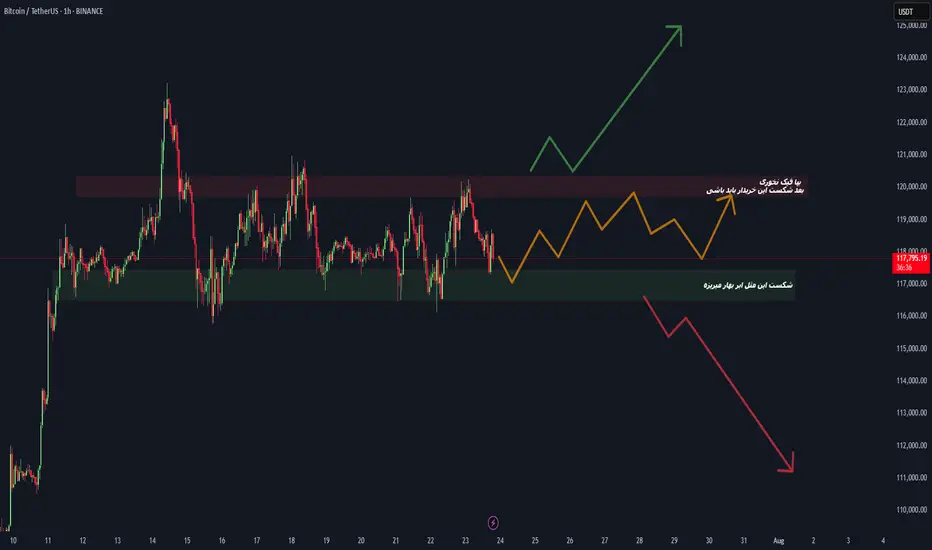
BTC at Make-or-Break Level! Which Side Are You On?#Bitcoin #BTCUSDT #CryptoTrading #TradeWithMky
📉 Scenario 1 – Bearish Breakdown
If BTC loses the green zone (~117K), expect a heavy drop toward 113K and beyond. This is a key demand zone — break it, and bears dominate.
📈 Scenario 2 – Bullish Reversal
Watch for accumulation between the green & red zones. A breakout above the red supply zone (~119K) will signal buyers are back in charge.
🗣️ As the chart says: "بیا فیک نزن، بعد شکست این محدوده باید بخری!"
🚀 Whether you're a breakout trader or a range player — this is the zone to watch.
📊 Chart by TradeWithMky — Where Altcoins Speak Louder than Bitcoin!
👇 Share your thoughts and setups below! Let's ride this move together.
Wave Analysis: "Peak Breeds Peak, Trough Breeds Trough".This chart presents a custom technical model relying on only two points to generate a series of expected price levels, integrating multiple factors for high-precision time and price forecasting.
Unlike the traditional ABCD pattern, this method provides both timing and pricing predictions and is designed to detect potential explosive moves (“pumps”) early on.
The analysis is applied to Bitcoin, highlighting key support zones, targets, and stop levels derived from a neural network approach.

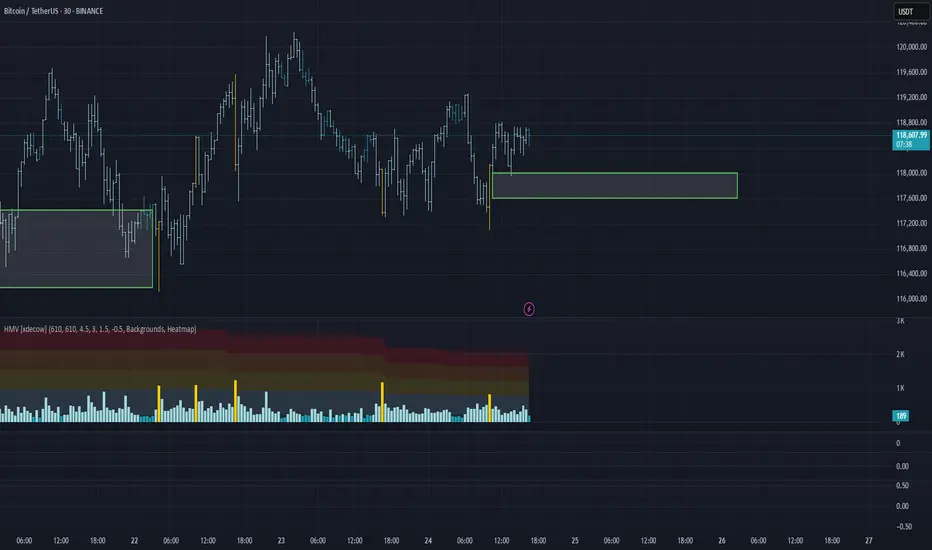
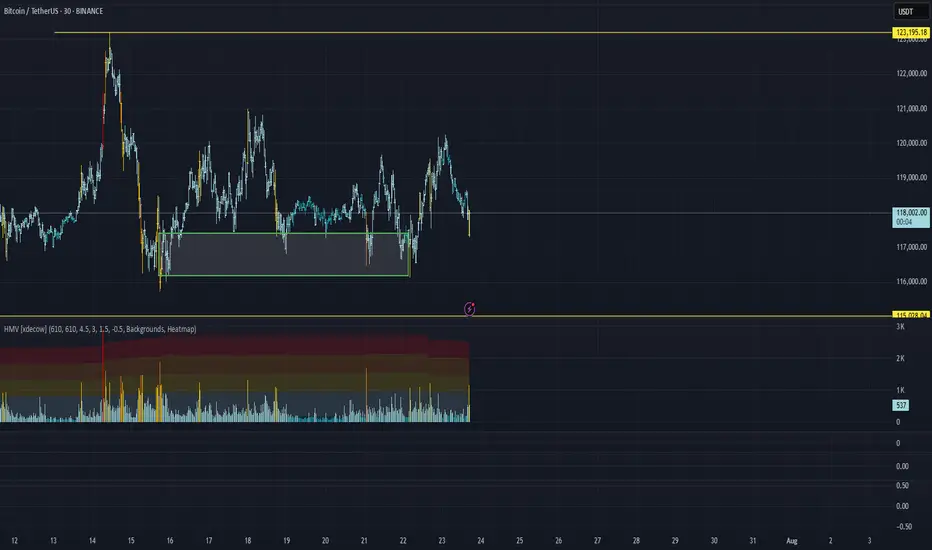
BTC/USDT Analysis: Inside the Range
Hello everyone! This is a daily analysis from a trader-analyst at CryptoRobotics.
Yesterday, Bitcoin continued moving toward the upper boundary of the sideways range. Strong market buying emerged near that level, but unfortunately, it was absorbed by sellers.
At the moment, we are testing the POC (Point of Control) of the current trading range. Buyer activity is already appearing at this level. If bulls regain initiative, we can expect a move back to the upper boundary. However, if the price drops below the current level, there is a high probability of stop-loss hunting and a liquidity grab near $115,000.
Buy Zones:
~$115,000 (zone of initiating/pushing volumes)
$110,000–$107,000 (accumulated volumes)
This publication is not financial advice.
BTCUSD 16.07.2025 ~+ General gloom over USD (pressure on Powell, tariffs, BB Bill)
* Mostly technical trade
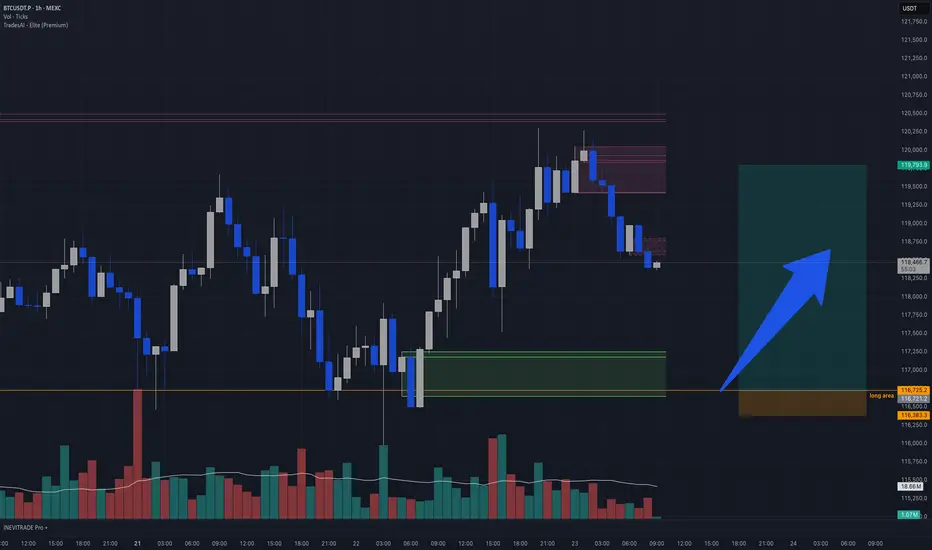
BTC intraday long idea BTCUSDT Intraday Idea | 1H Chart
Price recently pushed into a key supply zone and is now pulling back after a strong impulsive move. The highlighted green box marks a demand block or breakout origin, with confluence from high volume and previous rejection.
🟩 Long Area:
116,725 – 116,300
This area acted as a bullish breaker and low-volume node. Price previously wicked deep into this zone before a strong bullish push, suggesting unfilled orders remain. If price retests this zone, a reaction is likely.
Reason for Entry:
• Strong displacement from demand
• Price forming lower highs into potential mitigation
• Decreasing sell volume on the pullback → signs of absorption
• Clean R/R with tight invalidation
📉 Short-term Sell-off:
This retracement is likely a liquidity grab or order block mitigation, pulling into the long zone to refill institutional orders.
📈 Target Zone:
119,750+ – aligned with recent inefficiency and prior high.
BTC analysis: FOR 23 JULY 2025Bitcoin has broken out of the triangle pattern in an upward direction and is now set for a retest. If the price is able to hold above this level, we could see a continuation of the upward movement. The first resistance level is at $120,000, and a break above this could propel us toward a new all-time high.
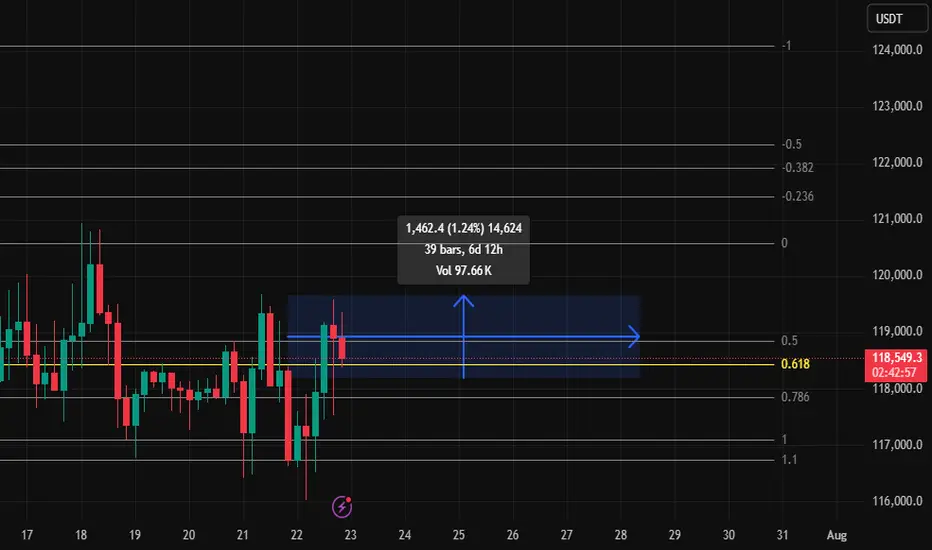
Can BTC Reclaim 118,700?1% a day can near 400% my life.
I Spot Longed BTC looking for a 1% up, might take awhile but, BTC is king, I will wait. and when it hits, a couple of memes have retraced on the daily, I will be looking for more riskier memes for a higher %pump.
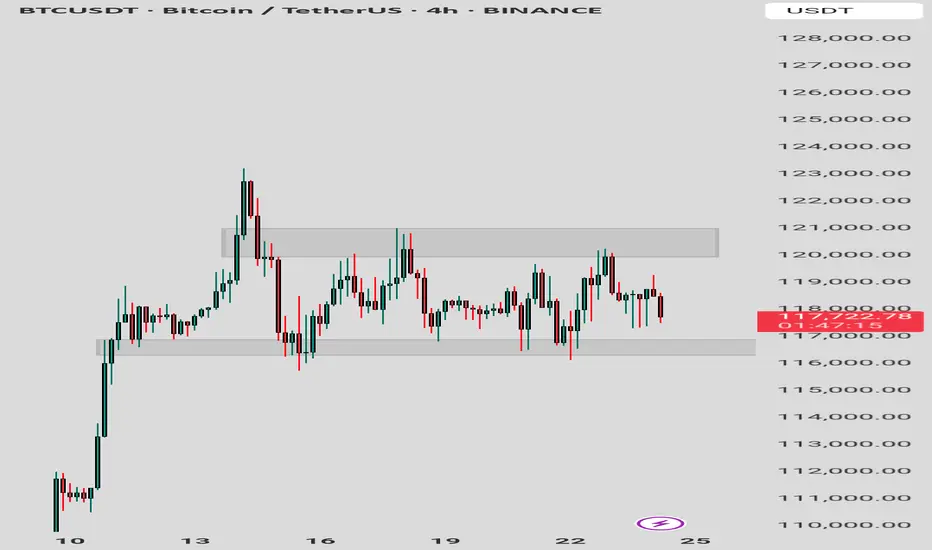
BTC/USDT – Range Formation Before Next Move?Bitcoin is currently consolidating between $117,000 support and $120,000 resistance, forming a tight sideways range after a strong breakout.
🔹 Structure Insight:
Bullish rally stalled at $120K resistance zone.
Range-bound candles with wicks on both ends = indecision.
Strong demand zone near $117K, acting as short-term floor.
🔸 Indicators Flash Neutral Bias:
RSI cooling off below overbought zone (~63) – no strong momentum.
ADX low and flattening – trend weakening.
MACD losing strength – bull momentum fading.
Volume declining during consolidation = awaiting catalyst.
🟢 Bullish Trigger: Break above $120K with strong volume could ignite next leg up → Targets: $122K–$127K
🔴 Bearish Trigger: Breakdown below $117K opens door to $114K–$112K retest.
🧭 Outlook: Sideways range – wait for breakout confirmation before positioning aggressively.
Power Law GrowthWhat you’re seeing is a Power‑Law Growth Corridor plotted over the weekly BTC/USDT price. In essence, it’s a dynamically‑sloped channel built on a power‑law fit of price vs. time, rather than the usual straight‐line
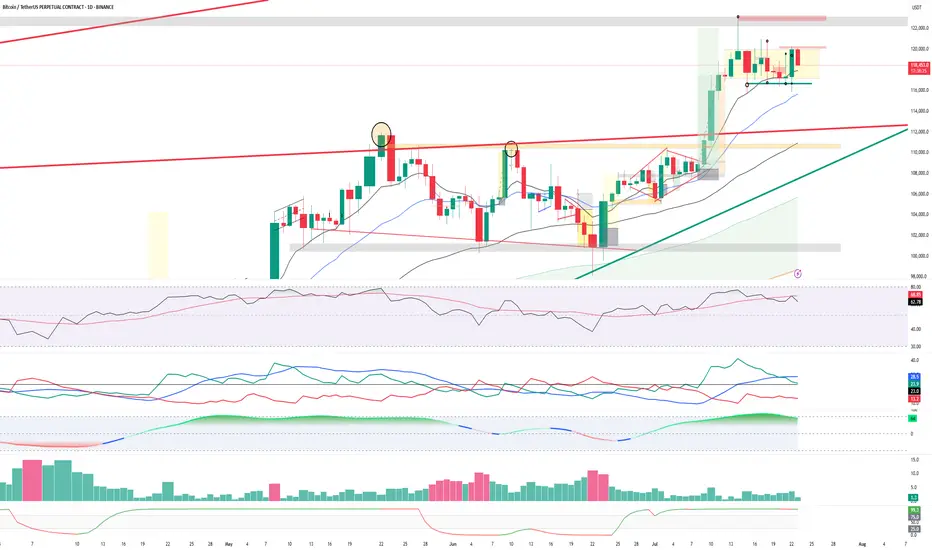
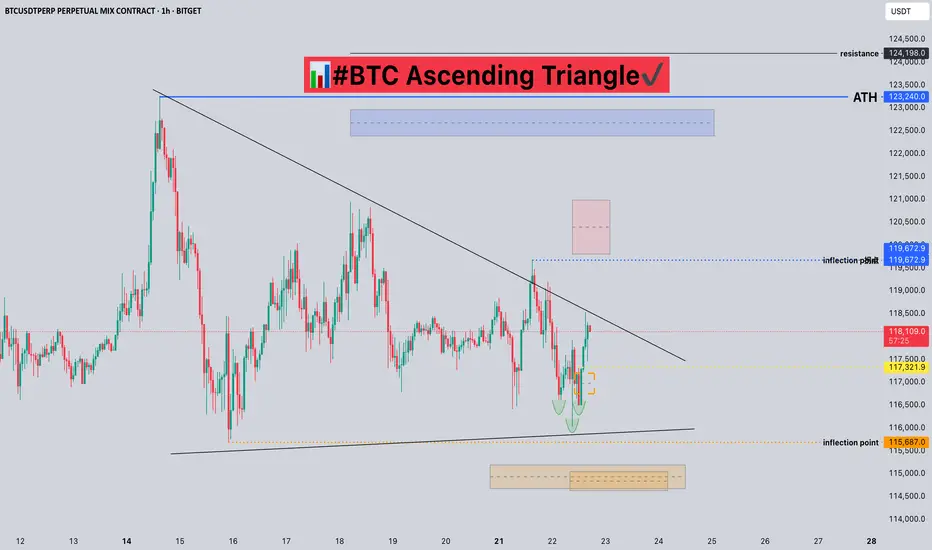
#BTC Ascending Triangle📊#BTC Ascending Triangle✔️
🧠From a structural point of view, we are still in a long-term bullish trend, and the short-term short structure of the small cycle is difficult to change the trend force of the large cycle. And we have been sideways here for a long time, digesting the selling pressure here, and it seems difficult to pull back. And the 15m level has built a bullish head and shoulders structure, so please be cautious about shorting!
➡️From a morphological point of view, the price is gradually compressed and formed into an ascending triangle. Generally, we will use this model to continue the original trend force.
⚠️Note that if we fall below the inflection point of 115687, it means a short structure at the 4h level. We need to be alert to further pullbacks. At that time, if we want to participate in long transactions, we need to find a lower support level to participate, such as around 112000.
Let's take a look👀
🤜If you like my analysis, please like💖 and share💬 BITGET:BTCUSDT.P
BTCUSD BULISH TRANDE Btuusd buy from 117,500
tp 118,500
tp 119,500
tp 120,590
Stope Lose 116,000
TRADE AT YOUR OWN RISK

long reng for mach timei thing we have reng sid for long time and 77500 / 133000 is on
but in line i see very opportunity fo trad
for just personal in other coin :)

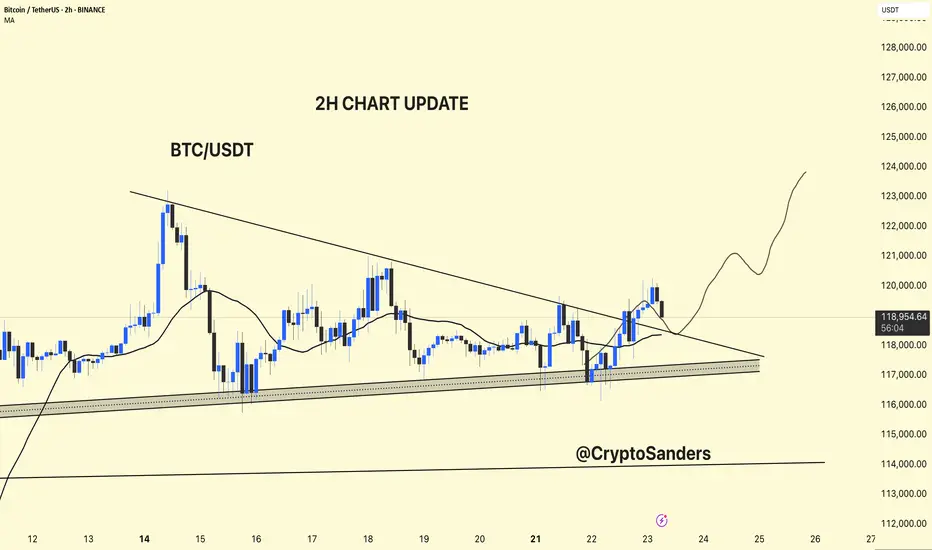
BTC/USDT – 2H Chart Update!!BTC/USDT – 2H Chart Update
Breakout Confirmed:
BTC has broken above the descending trendline but is currently facing resistance at around $ 119,500.
Support Zone:
Strong ascending support between $ 117,000 and $ 118,000 remains intact.
Moving Average:
Price is currently testing the 2H MA (~$118.3). Holding above this could confirm bullish continuation.
Outlook:
If BTC holds above $ 118,000, a move toward $ 123,000–$ 125,000 is likely.
Failure to hold may retest $117K support.
Bias: Short-term bullish unless price breaks below ascending trendline.
Thanks for your support!
DYOR. NFA
BTC # 15-minute BTC/USDT chart This 15-minute BTC/USDT chart shows a key breakout structure:
Ascending trendline (red) supported price before a breakout.
Horizontal line marks a previous resistance turned support post-breakout.
Vertical red line represents the breakout height.
50% retracement level of the breakout move is highlighted — a critical area for potential price reaction.
Price is currently pulling back after a recent high near $120,400, trading around $119,059, nearing the breakout support zone.
This setup suggests a possible bullish retest scenario if support holds near the 50% level
thanking you

BTC - A POSSIBLE SCENARIO (MARCH 2025)BTC - A POSSIBLE SCENARIO (MARCH 2025)
BTC is still showing weakness. Overall, I remain bullish, but it may dip to $68K–$73K.
Alts are a real bargain now in March 2025. They won’t stay like this forever—soon, they’ll surprise everyone. But obviously they are extremely risky assets.

HolderStat┆BTCUSD consolidatedBINANCE:BTCUSDT is consolidating between $129K and $137K. Breakout above $137K could lead to new highs. Key support remains at $125K.
